
For the past few months, I’ve been thinking about the question answered in this post: What contribution to our carbon reduction goals should we expect from improvements to the energy efficiency of existing homes — envelope upgrades like insulation and air sealing. This post first considers available data about the basic weatherization package offered by Mass Save, asking: How much additional reduction in residential heating energy consumption can we expect through continuation of basic weatherization efforts? The answer appears to be: very roughly three percent at the population level. The post then considers the viability of deeper energy retrofits. The bottom line is that we are likely to have to get most of our carbon reductions by decarbonizing heating systems as opposed to improving building envelopes.
Weatherization
Summary of analysis
This section builds out an estimate that the remaining population-level energy savings that we will achieve through standard weatherization will likely be about 3%, and are very unlikely to be more than 7%. We consider a lot of data, but the basic reasoning is simple to summarize:
- Weatherization yields roughly 10 to 15% savings in the average home.
- From Mass Save experience, roughly 35% (not more than 70%) of homes have viable weatherization projects to do.
- Roughly 1/3 of homes have already been screened out through Mass Save activity, so the remaining opportunity has to be found in the other 2/3.
- Multiply these through to get 3% as an expected population savings level: 15% * 35% * 2/3 = 3.5%.
- Use the 70% high-side from step 2 to get to get the high side savings limit: 15% * 70% * 2/3 = 7%.
All of the data below serve to expose and test this basic reasoning.
“Weatherization” of existing residential buildings is a very standard product in Massachusetts, delivered by Mass Save’s “Residential Coordinated Delivery” program. At the request of a resident or owner of a home, Mass Save sends out an assessor who reviews a checklist of opportunities for improved energy efficiency. The main recommendations focus on (1) targeted air sealing and (2) insulation of attics, walls, and ducts. These are measures that can be achieved in many structures without reconstruction.
With the permission of the homeowner, the assessor will arrange for an approved weatherization contractor to come and implement the recommendations. Mass Save covers 75% to 100% of the costs, which average about $4,000. Mass Save also pays independent insulation contractors for delivery of the same standardized Home Energy Assessment (HEA) and weatherization package. Mass Save conducts quality control oversight of the insulation work through multiple channels. Full description of the Residential Coordinated Delivery program appears in the Mass Save Three Year Plan. Current volume of insulation and air sealing projects appears on the KPI2 tab of Mass Save’s Quarterly Key Performance Indicator reports. The HEA can also lead to heat pump and other equipment installation recommendations, but that is not the focus of this post.
The savings possible from weatherization depend on the condition of the home, but the upside is finite without reconstruction of the home. There is only so much room for insulation in the walls of a typical home built with 2 x 4 framing. Without thicker walls it is generally hard to insulate beyond an “R-value” of 13. And if the walls are already insulated, it is hard to add insulation. In attics, it usually possible to pile insulation higher, but there are diminishing returns after basic insulation is in place. The chart below is strictly illustrative; it shows the estimates of the heating load resulting from alternative degrees of weatherization from a commonly used modeling tool — BEopt. None of the bars are presented as typical of homes in Massachusetts — the only take away from the chart is that from “no weatherization” to “some weatherization” can be a big step, but subsequent improvements will likely have more modest impact.
Chart 1: Modeled heating load for illustrative home with illustrative alternative levels of weatherization
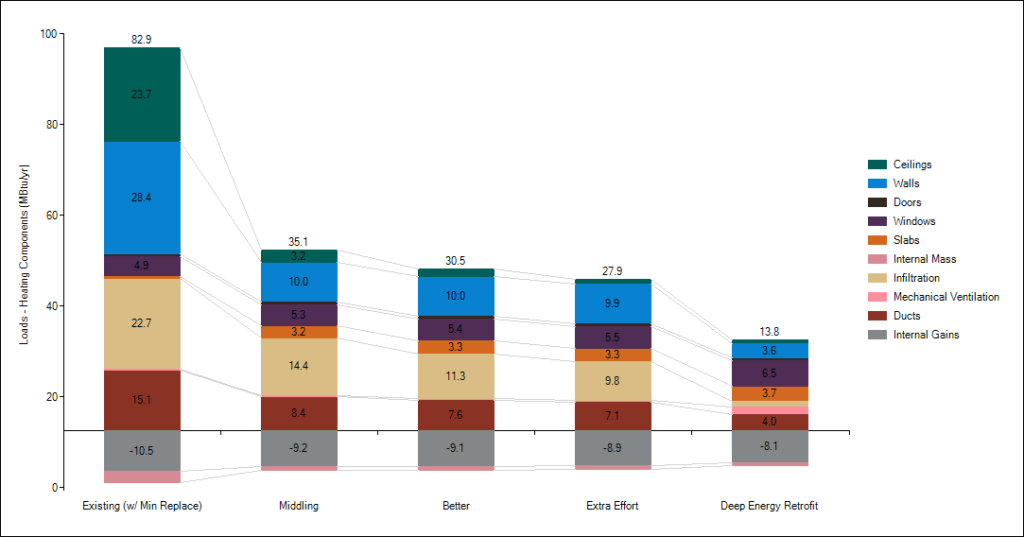
| Illustrative Scenario | Wall Insulation R-Value | Ceiling/Roof Insulation R-Value | Air Sealing ACH50* | MMBTU heating load |
|---|---|---|---|---|
| Uninsulated “Existing” | None | None | 15 | 82.9 |
| Middling | 13 | 19** | 10 | 35.1 |
| Better | 13 | 30 | 8 | 30.5 |
| Extra effort | 13 | 49 | 7 | 27.9 |
| Deep Energy Retrofit | 28 | 60 | 1 and install exclusive mechanical energy recovery ventilation | 13.8 |
*ACH50 refers to the number of air changes per hour due to leaks when air is blown into the house with 50 pascals of pressure. Lower is better. A 20 percent improvement from 10 to 8 would be significant improvement in a leaky existing home. One Massachusetts study of renovations used a baseline of 9.6 ACH50 based on existing prior studies of existing homes: See Renovations and Additions Market, Characterization and Potential Savings Study, Table 64.
**R-19 is about six inches of cellulose, a common level according to the 2009 Residential Appliance Saturation Survey.
Our previous reviews of the response to the energy crises of the 1970s and available historical information on building thermal characteristics suggest (a) that most homes had some level of weatherization even in 1980 and (b) that through the following decades there was continuing investment in improvement, although it is hard to quantify. As the table below shows, when the current Mass Save push began after the passage of the Green Communities Act in 2008, most homes in Massachusetts already had advanced windows and some level of insulation in both wall and ceiling.
Table 1: Envelope Indicators as of 2009 baseline survey (at the start of the current Mass Save push)
| Feature | Finding |
|---|---|
| Wall insulation | 75% of residential customers have insulation in all walls; an additional 16% have some walls insulated; only 4% have no wall insulation. |
| Attic insulation | 89% of residential customers have attic insulation of varying depths, most commonly 4-6 inches. |
| Windows | 76% of residential customers have all double and triple pane windows. Only 1% have exclusively single pane windows without storms. See also 2022 baseline study report, table 3-71. |
| Air sealing — leak rate | Not measured |
One paper reasoned from the 2009 survey findings in the table above and from general industry weatherization results to the conclusion that the total population savings available in Massachusetts were only 4%. We ultimately reach a similar conclusion further below, but it’s worth building a better foundation for that conclusion from more detailed Massachusetts results.
Building energy use depends on myriad variables. Building science offers estimates of how energy use depends on all these variables, but the variables are so numerous and so often hard to measure that modeling usually depends on simplifying assumptions. Some assumptions will be off for any individual home and valid assumptions are hard to reliably establish even for population averages. As a result, the only persuasive numbers about population savings are based on actual measurements of energy use changes achieved by weatherization within the target population of homes.
Fortunately, Mass Save has repeatedly commissioned third-party evaluations of its actual weatherization results. Table 2 below collects third-party study results as to the percentage reduction in heating load achieved through basic weatherization in Massachusetts homes. These results confirm a generally accepted rule of thumb: weatherization provides average heating energy savings of 10 to 15% in Massachusetts homes today. This basic finding seems unsurprising given the already high prevalence of existing insulation today.
Table 2: Third-party studies of savings rate from basic Mass Save weatherization program*
| Source | % Savings Estimate | Notes |
|---|---|---|
| Home Energy Services Impact Evaluation for 2010 (2012) | Insulation, 11% (90% confidence +/- 9% of estimate) Air sealing, 6% (90% confidence +/-18% of estimate) | Review of actual results from Mass Save projects. Results are for natural gas heated homes in Table 14. |
| Home Energy Services Impact Evaluation update (2013) | Insulation and air sealing, 11.6% | Review of actual results from Mass Save projects. Results are for natural gas heated homes in Table 5. (Not clear whether denominator includes non-heating gas uses). |
| RES34 Impact Evaluation Report (2018) | Insulation and air sealing, 13% | Review of actual results for 2015 and 2016.** Heating load reduction. |
| RES39 Realization Rate Assessment (2020) | Insulation and air sealing savings, average of 8% for gas homes and 8% for electric homes | Review of actual results for 2017– natural gas and electric heated homes*** (Not clear whether denominator includes non-heating gas uses). |
| Low Income Multifamily Initiative Impact Evaluation | Insulation and air sealing, 12% | Includes shell improvements, but also miscellaneous other measures like duct sealing that could not be easily separated. (Not clear whether denominator includes non-heating gas uses). |
| Mass Save Customer Dashboard | Does not provide usage granularity sufficient to compute savings as % of usage. | Combining data from multiple panels of report yields outlier results. |
| Mass Save Quarterly Result Reporting | Does not provide usage to compute savings as % of usage. | Focus is on savings vs goals, not savings as % of usage. |
| Included as comparison: Evaluation of Efficiency Maine Programs | Insulation and air sealing, 17% savings for gas customers, 13% for delivered fuels. | See tables 3-5 through 3-8. Maine results are for program years 2014 through 2016. Includes review of other programs (some with additional measures), achieving from 9% to 18% savings (excluding one program targeted to high energy users). |
| Included as comparison: Evaluation of Efficiency Maine Residential Direct Install Program | Targeted air sealing and insulation, emphasis on air sealing: 8.5% | See page 17. |
| Included as comparison: National Weatherization Assistance Program results — Single Family | Single Family, 17.1% — across all mixes of measures including not only basic weatherization but windows and equipment | 2010 Energy Impacts for Single Family home, Table 4.3 (heating load only) |
| Included as comparison: National Weatherization Assistance Program results — Multifamily | Multifamily, 14.9% — across all mixes of measures including not only basic weatherization but windows and equipment | 2010 and 2011 Energy Impacts for Multifamily Housing, Table 4.3 (heating load only). Note that 2008 results, Table 3.7 put most 2-4 unit multi-family projects in a few older northern states including MA; MA was not among the top states for larger multi-family projects. |
| Included as comparison: EPA’s modeled weatherization benefits | 16% | For climate zone 5 “typical” home. Weatherization includes attic insulation and weather stripping, but not wall insulation. |
| Included as comparison: Communicating thermostat study | 10-30% | “typical savings of approximately 10% to 30% from basic insulation and air sealing retrofits” (just a passing statement, not a study finding) |
| Included as comparison: Retrofit cost and benefit survey | 20% | Cluster of “basic” projects, mostly seal and insulate projects, from within broad national database of retrofit projects (includes some Mass Save projects) |
| Related result: Residential Customer Profile Study (2019) | Gas savings, 11% for owners, 14% for renters. Electric savings, 14% for owners, 16% for renters. | All Mass Save program savings (not just weatherization). See tables 4-56 and 4-59. |
** Published stat is annual absolute savings of 13 MMBTU (gas/oil), 4 MMBTU (electric), but engineering workbooks show pre and post values differing by 13%. See Building Characteristics – RES Tab of MA Energy Optimization Model 2021.
*** Showing savings weighted across estimating tools; accuracy of estimating tools was focus of study –Mass Save vendors use proprietary software to estimate savings potential in each home consistent with standards defined in the Technical Reference Manual.
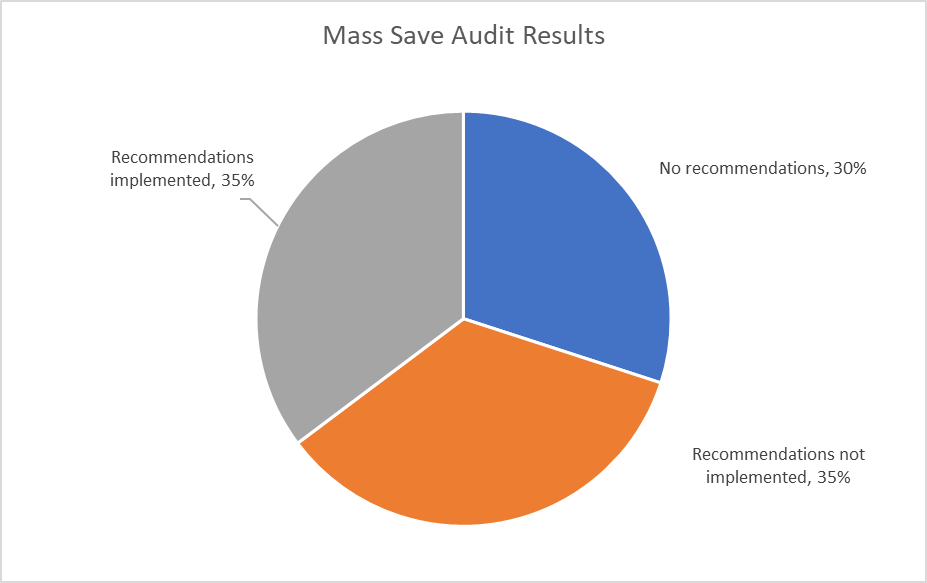
If the typical Mass Save weatherization project yields 10% or 15% savings, what should be our expectations for future population level savings? Only about 35% of Home Energy Assessments actually lead to projects. The results of Mass Save HEAs breakdown roughly along the lines of the pie chart below:
Chart 2: Mass Save Home Energy Assessments Results (2021 and first two quarters of 2022)
We could think of the Mass Save activity over the last ten years as an in-depth survey of homes. The Mass Save customer dashboard shows a total of 427,000 envelope projects completed from 2013 to 2021, suggesting roughly 3 times that many home energy assessments. It is not possible to determine housing unit duplication within the dashboard reports, but the Mass Save sample size is clearly huge. The table below summarizes the findings of Mass Save’s activity viewed as a survey.
Table 3: Findings from Mass Save as if it were a Survey
| Attribute | Finding | Notes | |
|---|---|---|---|
| (1) | Average weatherization project results | 10% to 15% | From studies arrayed in Table 2 (savings as % of usage). |
| (2) | Share of housing units with possible weatherization projects | 35% to 70% | From data in Chart 2 — 30% have no recommendations; 35% go forward on recommendations; 35% have recommendations but do not go forward. We lack a good characterization of the slice that does not go forward. Some homes may have more or less durable physical barriers to insulation, for example old knob-and-tube wiring or asbestos shingles; in other homes, the benefits may be too low to be worth the inconvenience of the project; in others, the benefits may be very strong, but either or tenant or landlord may lack incentive to move forward. |
| (3) | High side theoretical (“technical”) weatherization opportunity | 10.5% | 15% high side average project result from line (1) * 70% of population for which there are recommendations for a project from line (2) (assume that the homes not acting on recommendations had opportunities similar to those acting on recommendations — could be greater opportunities or could be less; see previous note) |
| (4) | High side population real (“market”) opportunity | 5% | 15% high side average project result from line (1) * 35% of population from line (2) (since subsidy offer for weatherization has been generous, assume that cost of weatherization was not usually the issue and infer that most of the 35% not going forward will be hard to move forward under any scenario). |
However, Mass Save is not just a survey — it is changing the housing stock at scale. Table 4 shows that Mass Save has already gone through roughly 1/3 of the housing units in the state.
Table 4: Approximate (~) share of housing units already addressed by Mass Save
| Attribute | Finding | Note |
|---|---|---|
| Total Housing Units in MA | ~3.0 million | American Community Survey 2022 |
| Less: Already weatherized | ~0.4 million | Mass Save customer dashboard (2013 to 2021) — envelope projects |
| Less: Audited, no recommendations | ~0.4 million | Inferred from weatherization project count based on ratios in Chart 2: (30%/35%) * 0.4 million ~ 0.4 million |
| Less: Durable barriers to weatherization | ~0.2 million | Recommendation-but-no-action count inferred from weatherization job count based on ratios in Chart 2: (35%/35%) * 0.4 million ~ 0.4 million. Guessing conservatively, based on only anecdotes, that half of those that don’t go forward will not go forward in the future; lack a solid basis for better guess, but it might be that most will never go forward since cost of insulation is so low that there are likely other, more durable barriers holding them back. |
| Available for attempted weatherization | ~2.0 million (2/3 of total) | Amount remaining after backing out three previous lines |
| Adjusted technical opportunity | 7% | 2/3 of 10.5% from Table 3 |
| Adjusted real opportunity | 3% | 2/3 of 5% from Table 3 |
As shown in the last two lines in the table above, we infer that the remaining real opportunity for energy savings and emissions reductions through weatherization amounts to 5% for 2/3 of the homes — roughly 3% of total emissions; theoretically possible savings are a little higher, roughly 10.5% of 2/3 or 7% of emissions.
But what if the Mass Save “survey” is not fully representative? In other words, what if the homes that have been assessed so far differ from those that remain unassessed. Most plausibly, older, low-income, rental homes could be under-represented. This concern pertains especially to older smaller multi-family rental structures — 2 to 19 units. (We will refer to all structures in the 2-19 unit range as “small”, although sometimes the “small” label is used only for the 2-4 unit range.) In larger apartment buildings, there is proportionally less energy loss through the envelope; additionally, the larger apartment buildings tend to be more recent. Table 5 breaks down the square footage of residential units in Massachusetts by vintage and structure and shows that 19% (looks like 20% due to rounding) are pre-1980 small multi-family units.
Table 5: Housing unit square footage by vintage and units within structure in Massachusetts (from latest assessors data available in August 2023)
| Unit Category | Pre-1950 | 1950-1979 | 1980-1999 | Post-2000 | Total |
|---|---|---|---|---|---|
| 1: Single | 19% | 21% | 14% | 10% | 65% |
| 2: Smallest multi-family (2-4) | 15% | 1% | 1% | 1% | 18% |
| 3: Larger small multi-family (5-19) | 3% | 1% | 1% | 1% | 5% |
| 4: Apartment Buildings (Over 20) | 2% | 3% | 3% | 5% | 12% |
| TOTAL | 39% | 26% | 19% | 16% | 100% |
Let’s attempt to compute a “straw-man” upper bound on the possible impact if the Mass Save “survey” were entirely missing Renter-Occupied Older Small Multi-Family structures (“ROOSMF”). Table 6 shows that at most, the population-level technical opportunity goes from 10.5% (unadjusted for progress already made) to 15%. The real opportunity is unchanged since, in this strawman, one is assuming that ROOSMF has been completely impervious to outreach — it would therefore be likely to remain so.
Table 6: Strawman worst case scenario for impact on weatherization technical opportunity estimate if Renter-Occupied Older Small Multi-Family (“ROOSMF”) units had been entirely missed by Mass Save
| (1) | “OSMF”: older (pre-1980) small multi-family (2-19 units), share of housing square footage from Table 5 | 19.4% |
| (2) | Renter-occupied share of SMF (including post-1980 SMF) by units from 2021 American Community Survey Table B25032 | 72.7% |
| (3) | “ROOSMF”: Estimated renter-occupied OSMF share of housing square footage — (1)*(2) | 14% |
| (4) | Non-ROOSMF estimated square footage — 100% less (3) | 86% |
| (4A) | Assume all ROOSMF radically neglected by all historical weatherization efforts: ratio of energy use intensity (kbtu/sq-ft) in ROOSMF to other housing (compare Building Sector Technical Report, Figure 15) | 2 to 1 |
| (5) | Assume high-side average technical savings opportunity in ROOSMF (top end of range suggested by experts) | 30% |
| (6) | Assume that technical savings opportunity estimate from Table 3 line (3), applies only to the non-ROOSMF universe | 10.5% |
| (7) | Square-footage-weighted-average state-wide technical opportunity estimate combining ROOSMF and non-ROOSMF universes — [ 1 – [86% * 1 * (100% – 10.5%) + 14% * 2 * (100% – 30%)] /[86% * 1 + 14% * 2]]. Note that actual average energy use intensity factors out of this computation, so we just use 1 and 2 for non-ROOMSF EUI and ROOMSF EUI) | 15% |
| (8) | Memo: Unadjusted real opportunity — unchanged from Table (4) since ROOSMF is presumed to be radically inaccessible in this strawman scenario. | 5% |
All critical variables are skewed towards overestimating the ROOSMF missed-opportunity in the Table 6 strawman estimate.
First, on line (4A), the assumption that ROOSMF EUI is twice as high as non-ROOMSF EUI (half as efficient) probably over-estimates ROOSMF energy use in comparison to non-ROOMSF energy use: Half of the non-ROOSMF housing square footage is in pre-1980 single family homes that may also be relatively inefficient. Again, compare Building Sector Technical Report, Figure 15.)
Second, the assumed technical savings of 30% in line (5) of Table 6 is likely too high as an average for all ROOSMF. More likely, while some ROOSMF units may offer very high savings opportunities, the average physically possible ROOSMF savings opportunities are closer to the average physically possible savings in non-ROOSMF units. To this point, we know the following:
- Not all ROOSMF exists in low-income neighborhoods where weatherization is likely to be poor. Boston and the “Gateway” cities account for only 55% of the OSMF in the state by square footage. See data in housing size tab of attached spreadsheet. (Note that we do not have census cross-tabs of tenure-by-units-in-structure at the municipal level, so cannot allocate ROOSMF; based on the assessors’ data we can only allocate OSMF.)
- Renter project savings (all measures) average only slightly better than owner savings. See Residential Customer Profile Study (2019) as shown in Table 2.
- Low-income weatherization project results from the Weatherization Assistance Program are consistent with typical Mass Save weatherization results — in the 10 to 15% range. See Massachusetts Low Income Multifamily Initiative Impact Evaluation and National WAP results shown in Table 2.
- Note: Since 1976, the Weatherization Assistance Program, a federally funded program administered through local community action agencies, has targeted low-income households with a package of measures similar to but broader than Mass Save weatherization. Given the length of that history, one might hope that a significant share of low-income homes have already been weatherized through WAP. However, WAP volume alone cannot prove that much of the ROOSMF weatherization savings have already been realized. The number of ROOSMF units in the state is approximately 600,000. The size of the WAP program has fluctuated, but it appears that the number of small multi-family homes reached annually by WAP in Massachusetts has stayed mostly well under 1,000 through the years, not enough to weatherize 10% of the ROOMSF universe even over a 47 year program life. A 2008 evaluation, Table 3-7, reports 387 multi-family units weatherized in Massachusetts in 2008 and the total number of homes of all types weatherized nationally at 97,965 (Table 3.4); the 2008 year was characterized as “typical.” (Note that the 380 includes only units in 2-4 unit buildings, but our Table 4 shows most of our ROOMSF universe is in that bracket.) The total national program tripled in volume to 331,865 during stimulus efforts in 2010 and 2011 (2010 evaluation, Table 1), but a 2021 DOE Fact Sheet puts the annual number of homes reached nationally at 35,000 and that includes many single family homes (77% in the 2008 evaluation, see Table 3.3). It appears that the WAP program has remained far below the level necessary to adjust the weatherization level in Massachusetts low-income homes at scale. See additional evaluation results here for 2008 and here for Recovery Act years.
Third, taking the entire ROOSMF universe as unrepresented in existing Mass Save results, as we do in lines (3) and (7) of Table 6, is not realistic. Some fraction of the ROOSMF category may be truly isolated from Mass Save due to language barriers, landlord disinterest, and other issues, but that fraction is far less than 100%.
- Mass Save makes strenuous efforts to reach this population in its programming. See generally the three year plan documents and regular discussions within the Energy Efficiency Advisory Council.
- The best data we have says that low income and rental customers are indeed under-represented in Mass Save participation, but not heavily:
- 34% of non-participants are renters, while 26% of participants are renters. (Similarly, 39% of non-participants are low income, while 34% of participants are low-income.) See Residential Nonparticipant Market Characterization and Barriers Study at page 12. (Note that this finding applies to participation generally, not to weatherization per se. See page 9 of the study. The differences could be greater for weatherization.)
- Demographic variables only account for 23% of the variance in participation. See the 2013 to 2019 Residential Customer Profile Study at page 2.
Summarizing: We estimated in Tables 3 and 4 that the remaining real or “market” opportunity for weatherization is near 3% of residential energy use and the remaining theoretical technical opportunity is likely under 7%. We then considered an alternative strawman scenario in which Mass Save’s programming (and its market studies) are outright missing a critical 14% of the housing units where the opportunity is large. We found that in that scenario, the resulting upward adjustment in population-wide technical opportunity was only 5 percentage points. We further found that most assumptions in that strawman scenario are implausible. The examination of the strawman scenario gives us more confidence that our original estimates are not unduly pessimistic. Note that the 3% estimate is consistent with one study based on the 2009 baseline study and industry estimates which placed the Massachusetts population-level savings opportunity at 4%. After 14 years of effort, and based on much better information, the remaining real opportunity for savings through weatherization appears to be in the vicinity of 3% of population-level energy use. Conceivably, substantial investments to overcome barriers to weatherization could push results somewhat above that, but a 7% overall savings appears to be the outer limit, unlikely to be achievable.
Deep Energy Retrofits
We have concluded that the future population reductions in energy use and emissions through Mass Save’s basic weatherization program are likely about 3%. So, while this program is cost-effective and absolutely deserves support, it will make only a modest contribution to our long term net zero emission goal.
In conversations with professionals, there seems to be a consensus that, while it might be possible to eke out a few more percentage points of savings in a percentage of projects by tweaking insulation practices, the only way to broadly raise the expected energy savings from residential energy conservation programs is to undertake “deep energy retrofits” — projects that go beyond the constraints of the existing structure of the building and essentially wrap the existing building in additional insulating layers.
Mass Save did conduct a Deep Energy Retrofit Pilot in 2010. In the first pilot year, only 12 homes completed projects; costs were found to be a prohibitive barrier.
High project costs were a major concern to all stakeholders, customers, and contractors. As currently structured, the pilot is not tenable for full deployment due to these high costs. As one stakeholder stated: “The rate payers cannot be expected to sustain the level of incentives at the current levels.” This cost crisis has led some stakeholders to question the pilot’s mission; other stakeholders identified cost reduction as the primary research goal for the pilot.
Final Report Massachusetts 2010 Residential Retrofit and Low Income Evaluation — Deep Energy Retrofit, page 2
The evaluation specifically found that the incremental costs of deep energy retrofits averaged $120,000 — incremental in the context of a much larger renovation — and that the projects were very far from financially cost-beneficial. See the Deep Energy Retrofit Evaluation, pages 33-34. Our family’s home was one of the handful of projects actually completed under that experimental program and I’ve written up our own benefit-cost analysis, which reached essentially the same conclusion. The program seems to have been quickly abandoned. We do not regret our project — our home is cleaner, more comfortable, and more resilient; additionally, we were glad to participate in an experiment that needed to be done to understand the financial challenges of deep energy retrofits.
It’s worth emphasizing that the costs of a deep energy retrofit cannot be sustained outside the context of a homeowner-funded major renovation or upgrade. The DER pilot study found that:
Those customers seeking to make their homes more efficient, but not simultaneously pursuing other upgrades, did not proceed far into the process. . . . Drop-outs almost always cited cost as a primary factor in their decision not to participate. . . .
When asked to characterize a good prospect for a DER project, contractors noted they looked for the following:
Deep Energy Retrofit Evaluation, pages 15, 19, 24.
- Complete house remodeling: doors, windows, walls, mechanical, roofing, siding.
- Environmentally aware and motivated customer, committed to doing “the right thing.”
- Customer with money and willing to put more money into the project.
In our case, the project required the pooled resources of two families, took over six months, and we had to live elsewhere while it was ongoing. A major general renovation like the one we undertook does not usually ever happen to a housing unit.
At this point, we appear to lack widely-accepted models for deep-but-not-so-deep retrofits that might be achieved at reasonable costs and yield acceptable environmental returns. There is a fundamental physical reality that makes it hard to develop cost-effective models that go beyond the basic weatherization package which already more-or-less maximizes the insulating potential of the existing structure of the building. Each additional layer of insulation or air sealing can only stop heat that has escaped through the inner layers. It will therefore tend to yield smaller environmental benefits, yet will likely cost much more as it will require reconstruction or structural extension of the building. See Chart 1 above.
A recent comprehensive literature review of deep energy retrofits found the following:
Emerging Pathways to Upgrade the US Housing Stock, 2021, page 141-143
- Most DERs are performed in pilot programs at small scale and [are] not clearly contributing to a larger market transformation. . . .
- Electrification [is emerging] as a core strategy to achieving deep carbon reductions in buildings and vehicles. . . .
- [There is a] shift in DERs away from high-cost super-insulation strategies, with increasing recognition that traditional weatherization/home performance strategies are adequate for most dwellings. . . .
- The costs [of deep insulation retrofits] remain too high. Finding the lowest cost way to save energy and reduce carbon emissions is likely to include PV, thermal storage, simple weatherization and electrification, rather than high-cost envelope upgrades. . . .
Released in December 2020, the Massachusetts Decarbonization Road Map (at page 53, footnote 40) envisioned seventy percent of Massachusetts buildings receiving “cost-effective deep energy retrofits” by 2050 and notes that failure to do so will raise the costs of electric energy transition. However, the Building Sector Technical Report (at page 52, figure 20), which underlies the Road Map, wildly underestimates the costs of deep energy retrofits — pegging them at only $56,000 for a single family home as a total project cost, not incremental, and including a heat pump! (See note below as to how these estimates were derived.) The only deep energy retrofits proposed in the current Mass Save three year plan are pilot projects for certain large buildings. In Massachusetts, as elsewhere across the country, the practical focus is on electrification with basic weatherization — deep energy retrofits are not being pursued at scale.
Conclusion
Basic weatherization is valuable and cost-effective, but will not take us far towards our decarbonization goals. At the same time, while deep energy retrofits do cut emissions dramatically, and while they do improve health, comfort, and resiliency, they are too difficult and expensive to constitute a major component of general decarbonization. We should stay open to new ideas, but at this point, we haven’t identified meaningful intermediate options between basic weatherization and deep energy retrofits. Accordingly, we have to focus on making electrification work, instead of chasing unacceptably difficult and expensive deep energy retrofits. Electrification does seem to be the focus of most Massachusetts policy makers.
Note on cost estimation in the Building Sector Technical Report
The authors of the Building Sector Technical Report were charged with a spectacularly daunting task:
- to classify, count, and size all the buildings in the commonwealth, and
- for each classified building type, to
- model current and future emissions,
- model emissions impacts of possible energy conservation measures, and
- model costs of possible energy conservation measures.
So, the BSTR authors, on one project budget, had to find or develop hundreds of difficult estimates. In fact, each of those estimates merit a full report on their own (comparable for example to the RES34 Impact Evaluation Report (2018), estimating the impact of typical weatherization measures in small residential structures in Massachusetts, or the Deep Energy Retrofit Evaluation). Of necessity, each estimate in the BSTR is developed very shallowly or borrowed from elsewhere.
As support for its energy conservation cost estimates, the BSTR relied primarily on two reports with similar spectacular breadth – reports conducting energy pathways analyses similar to the BSTR for Boston and for New York City.
Boston’s report, the Carbon Free Boston Buildings Technical Report report, acknowledges that “whole-building energy conservation measures . . . may require large upfront capital” and emphasizes the “large scale uncertainty” in its cost estimations. In fact, it does very little estimating on its own: It derives its retrofit estimates by combining numbers for specific measures from the New York City Technical Working Group Report. For small residential retrofits, it apparently applied no other validation.
The New York City Technical Working Group Report, in turn, struggles with the same spectacular breadth as the Massachusetts and Boston reports. It was primarily focused on assessing emissions and emissions reductions possibilities and gave very little attention to costs. It includes (at page 53) just one summary table on building envelope costs implying that they would be the same (per square foot) across a wide spectrum of building types. This implication is especially troubling since the New York Report is describing buildings in New York city. Large buildings are a much larger part of the housing stock in New York City and even the single-family homes are likely to be attached row houses, possibly with masonry construction. The report, at page 142, acknowledges the lack of city data on buildings under 50,000 square feet. The report states that it made up for this gap by compiling numbers from other sources. It states that the additional sources were used to develop emissions and savings estimates (apparently not cost estimates). It is entirely unclear whether any of the New York City cost data actually pertained to small residential structures, especially the stick-built free-standing structures that constitute most of the housing stock in Massachusetts.
We should, in general, fully disregard the cost data in the Building Sector Technical Report and consider that report only for its primary purpose, namely the identification of pathways to decarbonization. For cost data, we should rely on the very focused studies developed under the supervision of the Energy Efficiency Advisory Council.