
This post is a technical note collecting the data available as to the construction date, unit count, and square footage of residential buildings in Massachusetts. These data are relevant to understanding the history of greenhouse gas emissions from our residential building sector, a subject to be addressed in later posts.
This post highlights the MassGIS statewide compilation of data from municipal assessors and compares it to other data products, mostly from the Census. The outline of the post is as follows:
- Overview of data on residential structures from MassGIS
- Comparisons of MassGIS data to other sources
- Definition of the “residential” sector
- Working with MassGIS Tax Parcels (complete detail on steps for extracting building size data from the MassGIS repository)
- Source data for download
For construction date, unit count, and square footage of housing, we find that the MassGIS data is a credible source and the best source — consistent with Census data as to unit counts and much more complete and precise as to square footage.
Overview of data on residential structures from MassGIS
Data offered by MassGIS (and described in complete detail further below) gives us a useful tool for analyzing the size and quantity of buildings in Massachusetts.
The table below classifies Massachusetts land parcels as reflected in the MassGIS data. The table classifies as “Non-Residential” several categories which are classified as residential in some other frameworks: (a) hotels and motels; (b) transient group quarters like hospitals; (c) non-transient group quarters like dormitories; (d) tax-exempt properties including public and charitable housing. The classification follows the Energy Information Administration practice of treating these categories as “Commercial.” See definition discussion below.
Property Tax Parcels in Massachusetts — latest available data as of August 2023
| Tax Parcels | Housing Units | Square Feet | % of Sq. Ft. | |
|---|---|---|---|---|
| Single Family | 1,434,713 | 1,442,378 | 2,787,708,445 | 43.6% |
| Condominium | 352,399 | 351,191 | 443,589,356 | 6.9% |
| Two Family | 147,273 | 293,924 | 369,671,649 | 5.8% |
| Three Family | 54,987 | 164,827 | 185,546,658 | 2.9% |
| Apartments | 29,576 | 409,043 | 323,337,039 | 5.1% |
| Mixed Use | 27,767 | 120,656 | 160,832,666 | 2.5% |
| Other Residential | 25,204 | 76,633 | 65,940,202 | 1.0% |
| Mobile Home | 2,251 | 4,120 | 2,039,034 | 0.0% |
| Non-Residential | 461,201 | n/a | 2,055,542,220 | 32.1% |
| Total | 2,535,371 | 2,862,772 | 6,394,207,269 | 100.0% |
This table is roughly consistent with the Building Sector Technical Report, a Massachusetts climate planning document which appears to have used Fiscal 2017 MassGIS data and a slightly different classification. See note below.
The MassGIS data include both year built and square footage of structures in Massachusetts. This allows us to see the growth of the total residential square footage needing heating and cooling. The growth of square footage trends upwards more rapidly than units because units are getting larger as the second chart further below shows.
Massachusetts total residential square footage (orange line, right axis) and total housing units (blue bars, left axis): 1961 to 2022.
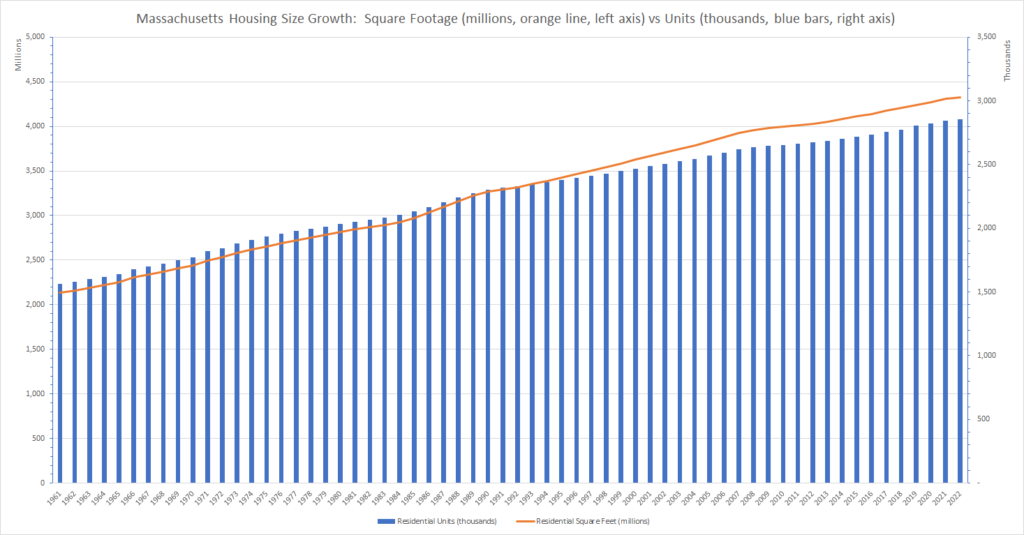
Note: Counts and square footage are as of January 1 of the year shown. Not all communities have submitted the latest assessors’ list as of our August 2023 download. January 1, 2022 counts include the FY2023 assessors’ list and therefore are likely missing approximately 36% of parcels changed in 2021 (percentage based on total community parcel count). 2021 counts are likely missing 7% of parcels changed in 2020; 2020, missing 1% of parcels changed in 2019. Every community was current for years 2017 and prior.
The growth in average square footage of both new single family homes and new multi-family units is striking in the chart below. Both categories have grown in size, but single family homes have grown faster.
Average square footage of single-family homes (gray) and multi-family homes (orange) in Massachusetts by year of construction: 1961 to 2021.
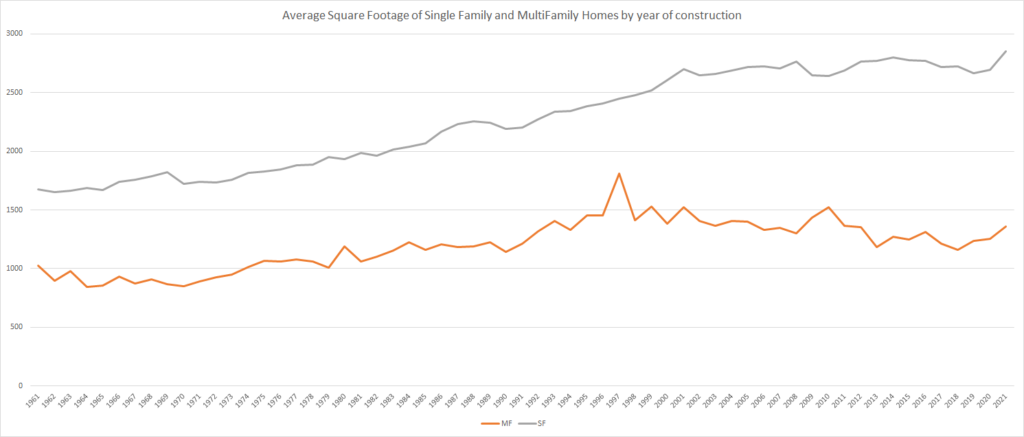
Note: Average square footage is based on the assessors’ data for year of construction. Not all communities have submitted the latest assessors’ list as of our August 2023 download. 2021 data is based on the FY2023 assessors’ list and therefore reflects only 64% communities (based on total parcel count); 2020, 93%; 2019, 99%. Every community is complete for use 2016 and before.
With our method of handling the MassGIS data, a condominium development will show as a multi-family building, even if it is actually a cluster development of detached homes. Just to check the trend data shown above, the chart below breaks out the size changes by individual property category based on Division of Local Services use codes. It shows only the most common codes. The data confirm the relatively large size of recent developments in every category.
Average Square Footage of Units by Property Type and Year Built (Properties classified by Division of Local Services Use Code)
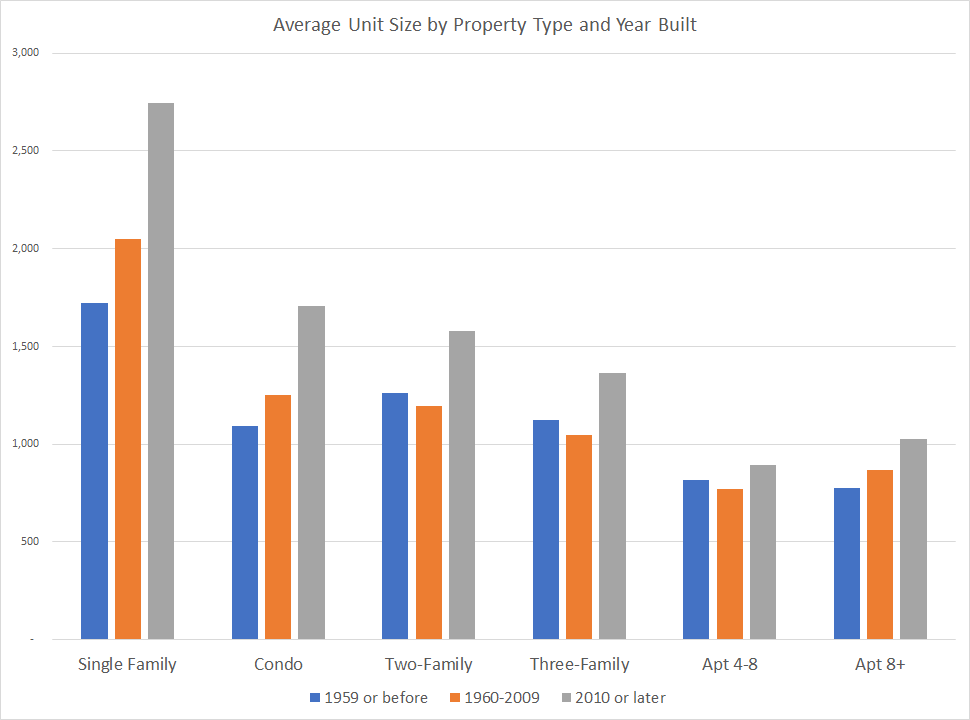
Note: The note on currency to the previous chart also applies to this chart, but the incompleteness of the most recent years is diluted in aggregation.
Several additional data wrinkles bear mentioning. We cannot precisely quantify any of these wrinkles, but we believe them to negligible.
- Average square footage for homes built in any given year is overstated to the extent that it includes homes that have been expanded since original construction. If a home were expanded after construction, it would likely appear on the property list with the original construction date, but with the later expanded square footage. This distortion would tend to slightly understate the growth trend of average size evident in the charts.
- Conversely, if an original single-family home were later divided into multiple units, it would appear in the multi-family count instead of the single-family count. It would overstate the historic unit count, but would not alter the historic total square footage. It might or might not affect the averages in the second and third charts, most likely by removing a large home from the single family average.
- Prior to 1980, it appears that the “YEAR_BUILT” is often only approximate.
A possibly more material wrinkle is that some units are demolished every year and these do not appear in the historical totals or averages. See discussion in the next section.
Comparisons of MassGIS data to other sources
Decennial Census vs MassGIS
The decennial census does not provide square footage data for housing structures, but it does provide a long time series of reliable housing unit counts. This series is of particular interest as a comparison point because MassGIS property records are often missing unit counts and we have had to impute unit counts as explained in the methods section. We also want to get a better handle on the loss of units through demolition and the extent to which that distorts our longer term historical data.
Massachusetts Housing Unit Count: Decennial Census vs. MassGIS Assessor’s Data (including imputed units) —
Legend for each pair of bars shows the % by which MassGIS is below Decennial Census.
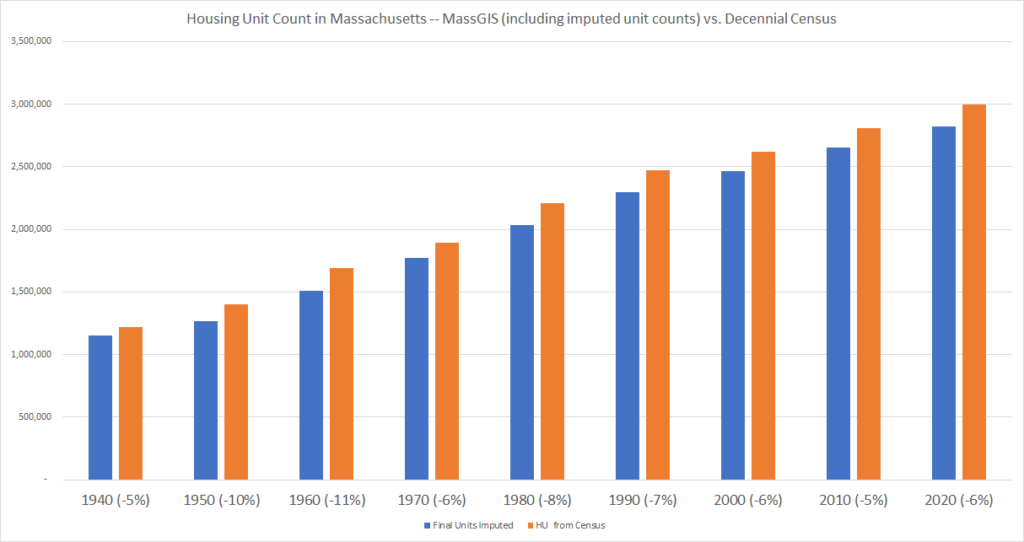
As the chart shows, the housing unit count from MassGIS usually runs 5 to 7% below the Census — approximately 150,000 to 200,000 units out of 3,000,000 total counted by the Census. Several factors contribute to this difference:
- The exclusion from our analysis of tax-exempt properties, including public and charitable housing, accounts for half or more of this difference. Public and charitable housing properties are included in the MassGIS list, but we exclude them in this analysis because (a) data for them is intrinsically less reliable since the assessors make no use of it and (b) they are grouped as commercial, not residential in the energy data that we intend to compare in a separate post. See the parallel reconciliation done with the American Housing Survey below.
- Mobile homes are not fully accounted for in the MassGIS data as they are not taxed individually in trailer parks.
- The census data considers boats, RVs and tents to be housing units if someone is living in them. (For more on Census definitions, see tab C1 of attached spreadsheet.)
- Our methodology in preparing the comparison above excludes from the MassGIS count the first quarter of housing production prior to the April 1 Census — perhaps five thousand units.
Within the 80 year horizon of the chart above, the demolition factor does not appear to be significant. The accounting difference between the two estimates does not grow much in magnitude as one moves back in time. Further, methods used by the Census Bureau’s Population and Housing estimate program suggest that the cumulative demolition decline should be 0.74% for homes built in 1980 and 2.69% for homes built in 1940. The annual demolition rates from the Census are not Massachusetts specific and are based on two-year follow up of a 2009 sample. They are not necessarily constant over the longer time, but they tend to confirm the small order of magnitude of the demolition factor. See Tab C2 in the source spreadsheet.
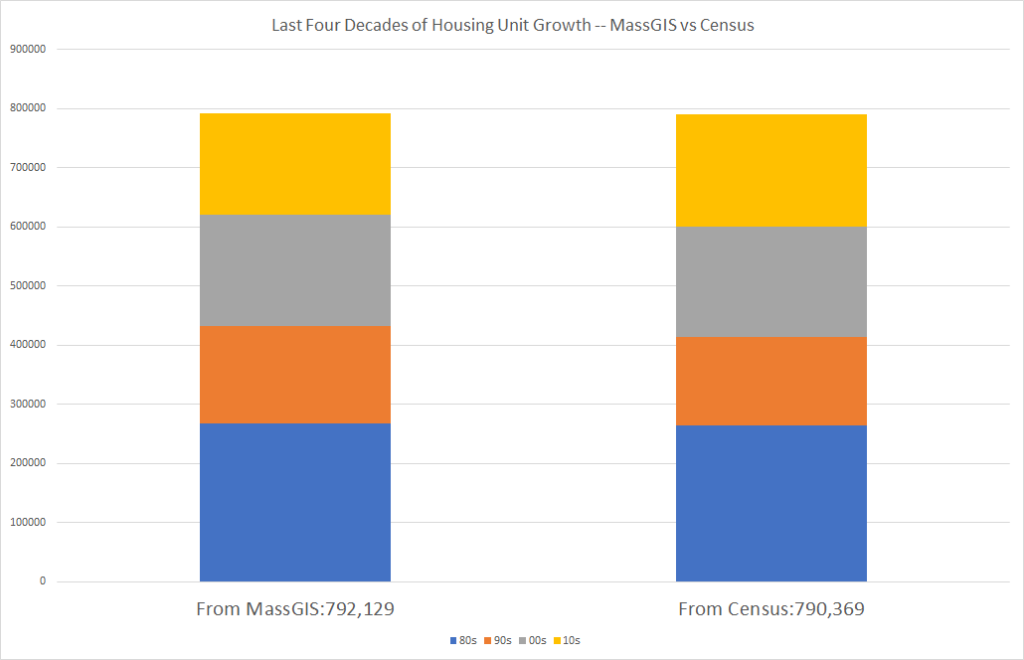
A final comparison offers additional comfort about the last four decades of unit counts: The number of units added from 1980 through 2019 foots almost exactly between the Census and MassGIS: decade-to-decade variations, possibly caused by timing issues, wash out in the total. See tab C1 in the attached spreadsheet for more detail. This consistency as to private housing fits with our understanding that few units of public housing were built during this period, so that new construction is all private and equally reflected in both MassGIS and the Census counts.
Last Four Decades of Housing Unit Growth (1980-2019) — MassGIS Total (with imputed units) vs Census Total
Building Permits vs MassGIS
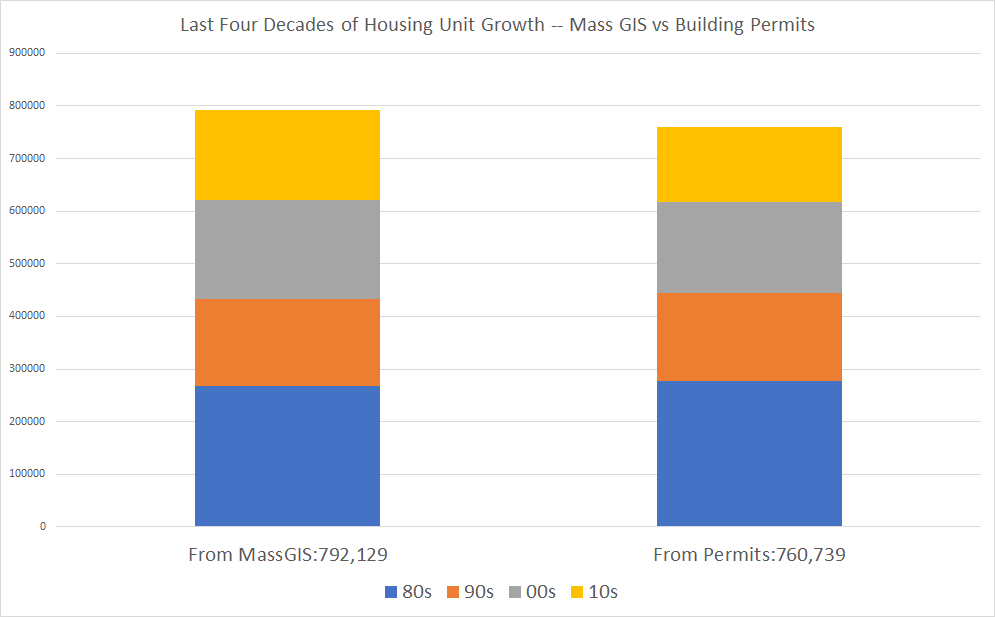
Building permit issuance does not compare readily to the stock of existing housing, but it should compare closely to the addition of housing units. Comparison with building permit data provides additional confirmation of our unit imputation method. The chart below compares total units from building permits issued over the last 4 decades to the MassGIS total with units imputed (consistent with the previous chart).
Last Four Decades of Housing Unit Growth (1980-2019) — MassGIS Total (with imputed units) vs Building Permits Issued
Note: For sources see tab C3 in the attached source spreadsheet. The building permit data were downloaded from MAPC, but are consistent with the Census building permit survey.
The comparison is close, but the count of units based on building permits issued comes in slightly lower than either our MassGIS count or the Census count. This may be due to incomplete reporting of permits, understatement of unit counts on some building permit applications, or to variations in the timing of building permit issuance to completion timing.
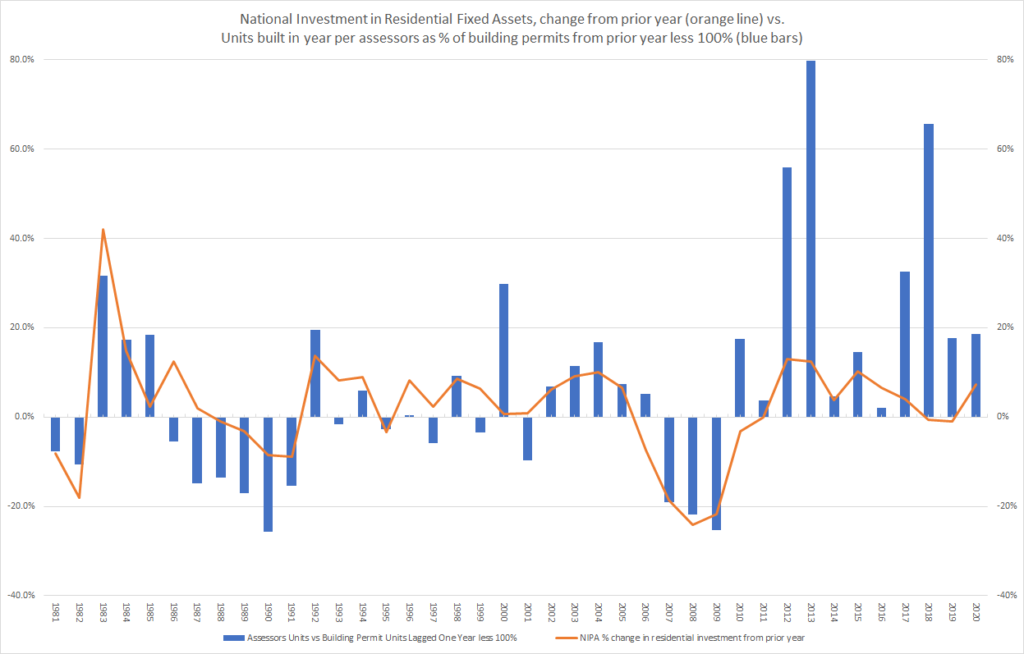
In the chart below, we attempt to match year-by-year building permit issuance to MassGIS YEAR_BUILT counts. We compare building permits issued in a given year to units assessed as constructed in the following year because there is a typical gap of 7 months or more between issuance of a building permit and completion of a building project, according to national survey data. See Tab C5 of the source spreadsheet. It emerges very clearly in the chart that the actual timing of building completion fluctuates with economic conditions. If we take the YEAR_BUILT unit counts as completion counts and compute issuance in each year as a percentage of completions in the following year, we find that, as one might expect, completions slow down when economic conditions are down and catch up when economic conditions are up. We take the change in national investment in residential fixed assets as our indicator of economic conditions in the building sector. The strong correlation (54%, regression F significance < .0003) between the variables shown lends additional credibility to the annual YEAR_BUILT values in the MassGIS data.
Percent by which unit completions (as reflected in MassGIS YEAR_BUILT counts) are above or below prior-year building permits issued (blue bars) as compared to change in national investment in residential fixed assets (orange line)
Note: For sources see tabs C3 and C7 in the attached source spreadsheet.
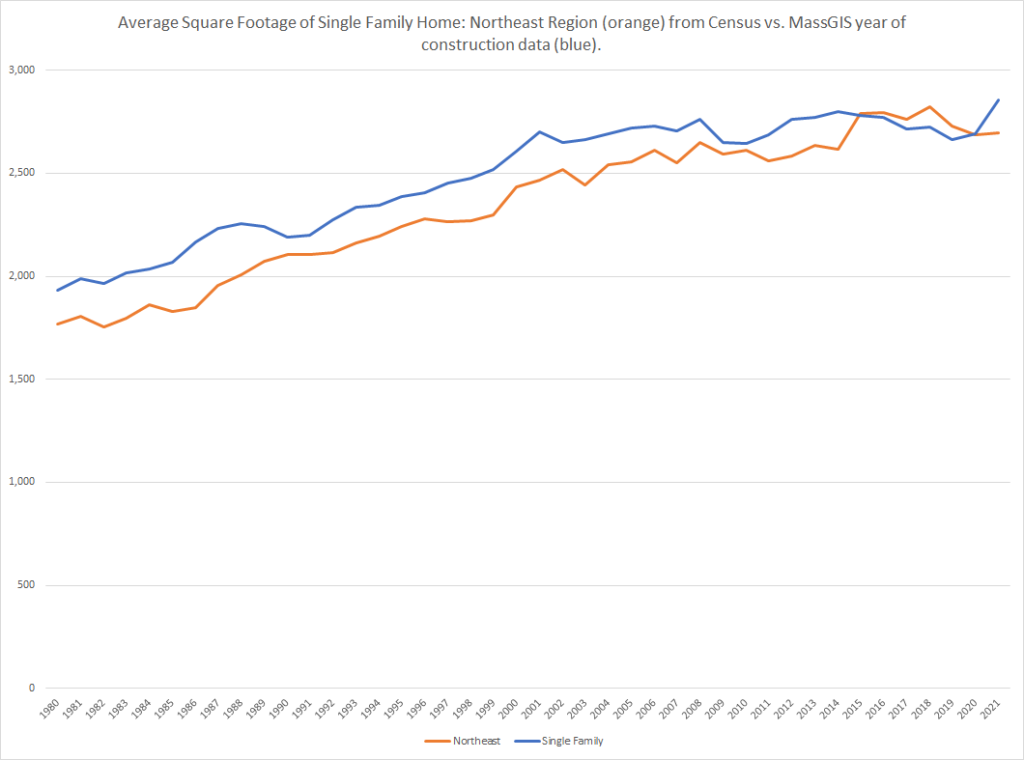
The building permit issuance data do not include building square footage values for Massachusetts. The census does sample building square footage and other building characteristics in its Survey of Construction. However, in the SOC, the lowest geographic aggregation is multi-state region of the United States. Data for the Northeast region as to average square footage turns out to be very consistent with MassGIS sizing data.
Average square footage of single family home — comparing data for the Northeast Region of the US (orange) to MassGIS “YEAR_BUILT” time series (blue)
American Housing Survey vs MassGIS
The Bureau of the Census samples housing units existing in the United States every two years through the American Housing Survey. The AHS samples enough households to produce estimates of many variables for larger states like Massachusetts.
It is not a full count, just a sample, so it is more useful for examining housing characteristics than for comparing housing counts. The AHS does include counts, but they are estimates based on trend data. We nonetheless compare total counts to see how they look. For comparability, we use the 2019 American Housing Survey and limit the MassGIS extract to structures built before 2020. The survey methods document explains that “[t]he universe of interest for the AHS consists of the residential housing units in the United States that exist at the time the survey is conducted.” The survey was conducted between June 26 and November 26, 2019, so housing completed in much of 2019 could be included. To include housing completed through 2019, we need Fiscal 2021 Mass GIS data, which we have for 97.1% of municipalities. If we used the 2021 AHS, we would need data from Fiscal 2023 which we have for only 62% of the municipalities.
The two data sources produce very similar total housing unit counts when a couple of adjustments are made. Like the MassGIS data, the AHS data exclude group quarters, hotels, and motels. Unlike the selected MassGIS data, the AHS includes public housing. Additionally, it includes house boats and other truly mobile homes, which are only partially available in the MassGIS data. See AHS survey definitions and the discussion below about mobile homes tax treatment under Imputing Missing Unit Count Values.
Total Housing Units in MA — comparing MassGIS Assessor’s Extract to AHS
| Housing Unit Estimate Component | (000s in 2021) |
|---|---|
| MassGIS total housing unit count (built before 2020) | 2,825.0 |
| Plus: Public Housing not included in MassGIS extract as processed | 81.0 |
| Plus: estimated Mobile Home count discrepancy (using 2021 AHS data since mobile home detail suppressed in 2019) | 16.1 |
| Adjusted MASSGIS total housing unit count | 2,922.1 |
| American Housing Survey 2019 total housing unit count | 2,928.7 |
While the total unit counts are very close between the two sources, the stratification of units by structure size is different. The AHS classification may be better because we classify any condo development as a structure with a unit count equal to the number of condos in the development: some of the structures showing as multi-family in our analysis based on MassGIS may in reality be townhouse condo developments in which each structure has one unit.
Housing Units in MA by structure size — comparing MassGIS Assessor’s Extract to AHS
| Units in Structure | Total Units MassGIS built before 2020 (without public housing) | Total Units AHS 2019 (with public housing) |
|---|---|---|
| 1 (attached or detached) | 1,440.4 | 1,771.6 |
| 2 TO 4 | 614.4 | 517.5 |
| 5 TO 9 | 152.0 | 156.8 |
| 10 TO 19 | 86.9 | 108.8 |
| 20 TO 49 | 160.0 | 167.5 |
| 50 OR MORE | 368.1 | 181.2 |
| Total, excluding Mobile | 2,821.9 | 2,903.4 |
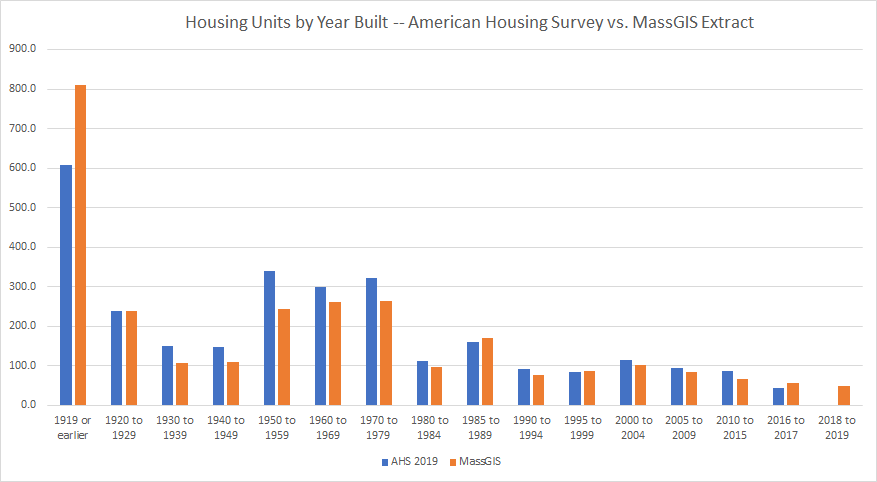
The assessor’s data in MassGIS and AHS both include a ‘Year Built’ variable. AHS occupant survey respondents will not know this with precision and it is not always critical to assessors either, but the the two data sets produce a similar distribution of responses. The 2018 to 2019 count is suppressed in the AHS results. The median year built is 1959 in the AHS data and 1957 in our MassGIS extract.
Housing Units in MA by year built — comparing MassGIS Assessor’s Extract to AHS
Both sources also report square footage for each unit. The assessors’ extract in MassGIS is much more complete than the AHS which understandably has a high non-response rate to the question: “Thinking about all the rooms you mentioned earlier, as well as the hallways and entry ways in this housing unit, about how many square feet is that?” See AHS Codebook definition for UNITSIZE. Responses to this question have to be very approximate. By contrast, assessors do rely heavily on square footage for valuation and take actual measurements. Square footage is available for 98.2% of the pre-2020 units on the MassGIS extract.
Housing Units in MA by square footage — comparing MassGIS Assessor’s Extract to AHS
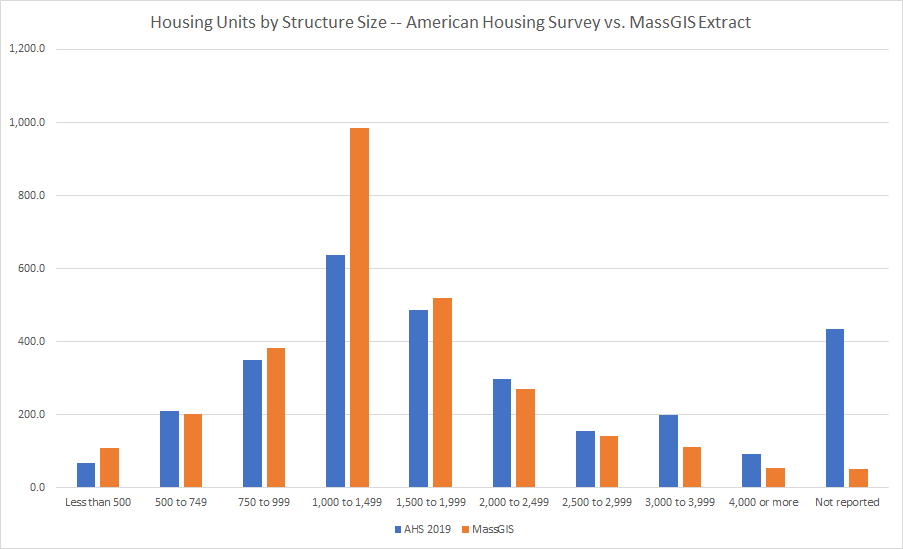
Mean/median square footage — comparing MassGIS Assessor’s Extract to AHS
As the chart above shows, the distribution of units by square footage is more tightly centered around the median (relatively smaller right tail) in the assessor’s extract, with the result that the mean square footage is closer to the median.
| Median Unit Square Footage | Mean Unit Square Footage | |
|---|---|---|
| American Housing Survey 2019 | 1,450 | 1,739 |
| MassGIS extract, built before 2020 | 1,506 | 1,540 |
Definition of the “residential” sector
This section explains in depth the principles that guide our classification of MassGIS properties as “residential.”
Since our interest in studying measures of residential building size is to understand how the growth of our residential building stock affects emissions, our classification of properties as residential attempts to match the definitions used in the state’s greenhouse gas inventory required by the Climate Protection and Green Economy Act, Chapter 21N of the General Laws.
Our “Road Map” legislation amending Chapter 21N in 2021 authorized the state’s Department of Environmental Protection to require direct reporting of greenhouse gas emissions from distributors of fossil fuels to homes in the state. It does so by redefining a “Greenhouse gas emissions source” to include “a person or entity that sells or distributes . . . heating fuels,” bringing distributors within the greenhouse gas registry and reporting system for greenhouse gas emission sources. The expanded reporting system will give the department more complete control over data on fossil fuel use and resulting emissions.
However, DEP has historically relied and continues to rely on the EPAs State GHG Inventory Tool (“SGIT”) for basic sectoral estimates of fossil fuel consumption. The most recent published inventory relies on the SGIT update from January 2023. The SGIT in turn relies on the State Energy Data System (“SEDS”) from the federal Energy Information Administration. SEDS derives its sectoral energy consumption estimates from surveys of energy suppliers who report the quantities of fuels that they distribute to each end-use sector. The supply survey estimates complement but do not necessarily foot to consumption data based on surveys of energy end users.
There are different surveys for each type of energy suppliers. The SEDS technical notes point to some ambiguity and inconsistency in the sectoral definitions. As to the definition of the residential sector as opposed to the commercial sector, the notes state:
SEDS bases its consumption estimates on data collected by various surveys that define the consuming sectors differently . . .. To the degree possible, SEDS assigns energy consumption . . . according to the following general definitions:
Residential sector: An energy-consuming sector that consists of living quarters for private households. . . . The residential sector excludes institutional living quarters.
Commercial sector: An energy-consuming sector that consists of service-providing facilities and equipment of: businesses; federal, state, and local governments; and other private and public organizations, such as religious, social, or fraternal groups. The commercial sector includes institutional living quarters.
State Energy Data System 2021 Consumption Technical Notes, p 3-4. Bold in original.
A 1988 EIA publication (cited in the current technical notes) further explains some of the possible variation in how different supplier surveys classify the residential sector.
There is no well-established definition of the residential sector as there is for the other sectors, The residential sector is generally considered to consist of all private residences, including single family homes (both owned and rented), multifamily housing units, apartments, and mobile homes. Secondary homes, such as summer homes, are also included. Institutional housing, such as school dormitories, hospitals and military barracks, are generally not included in the residential sector. Since there is no standardized definition of this sector, there will be variation in which dwelling units are included in it in different studies or data sources. . . .
The treatment of apartment buildings varies among the various supply surveys. Instructions for Form EIA-861, the current electricity survey form for collecting annual sales data, allows utilities some discretion in how they classify customers. Consequently, some utilities use rate schedules to determine sectoral sales and may therefore misclassify some residential consumption. In particular, large apartment buildings that are billed at commercial rates could be included under commercial sales. Apartment buildings are listed as being part of the residential sector on Form EIA-176 for the natural gas survey. However, in some cases, natural gas utilities use the billing rate classification for determining consumption by sector. Gas delivered to large apartment buildings that are billed under commercial tariff schedules would then be classified as commercial rather than residential sales. Apartment buildings are explicitly excluded from the residential sector in the petroleum surveys. The respondents are instructed to include apartment building consumption of fuel oil in the commercial sector.
Energy Consumption by End Use Sector, A Comparison of Measures by Consumption and Supply Surveys. EIA, 1988, p.7
Survey definitions for residential
The SEDS technical notes link to the individual supplier surveys, which do treat apartments inconsistently.
The notes to the EIA’s Sales of Fuel Oil and Kerosene page define residential as:
An energy-consuming sector that consists of living quarters for private households. Common uses of energy associated with this sector include space heating, water heating, air conditioning, lighting, refrigeration, cooking, and running a variety of other appliances. Sales to farmhouses are reported under “Farm” and sales to apartment buildings are reported under “Commercial.”
By contrast, the notes to the Natural Gas Consumption by End Use page define residential consumption as:
Gas used in private dwellings, including apartments, for heating, air-conditioning, cooking, water heating, and other household uses.
The survey form for electric utilities (EIA-861) defines residential as:
private households and apartment buildings where energy is consumed primarily for: space heating, water heating, air conditioning, lighting, refrigeration, cooking, clothes drying
The surveys do not include finer sub-sector granularity so the inconsistent treatment of apartment buildings cannot be adjusted out.
Survey definitions for commercial
All three energy source surveys place government agency buildings in the commercial sector. It appears that public and charitable housing will likely be counted as in the commercial sector by most energy suppliers responding to EIA surveys.
The notes to the EIA’s Sales of Fuel Oil and Kerosene page define commercial as:
An energy-consuming sector that consists of service-providing facilities and equipment of nonmanufacturing businesses; Federal, State, and local governments; and other private and public organizations, such as religious, social, or fraternal groups. The commercial sector includes institutional living quarters.
Italics added
Similarly, the notes to the Natural Gas Consumption by End Use page define commercial consumption as:
Gas used by nonmanufacturing establishments or agencies primarily engaged in the sale of goods or services. Included are such establishments as hotels, restaurants, wholesale and retail stores and other service enterprises; gas used by local, State, and Federal agencies engaged in nonmanufacturing activities.
The survey form for electric utilities (EIA-861) defines commercial as:
The commercial sector includes nonmanufacturing business establishments such as:
- hotels
- motels,
- restaurants
- wholesale businesses
- retail stores
- health, social, and educational institutions
- public street and highway lighting
- crypto mining and data centers
- municipalities
- divisions or agencies of states and federal governments under special contracts or agreements, and other utility departments, as defined by the pertinent regulatory agency and/or electric utility
All three energy source surveys place government agency buildings in the commercial sector. It appears clear that public and charitable housing will be treated as commercial by gas and oil suppliers. It appears likely they will be treated as commercial by electric suppliers, although the “special agreements” phrase in the electric survey is ambiguous.
Summary of definition of residential sector
In summary, it appears that to assess the impact of total residential square footage on reported residential energy use, we will want to carefully assess and include square footage of:
- Single family homes
- Two and three family homes
- Apartment buildings (recognizing inconsistent treatment for oil)
- Mobile homes
We need not carefully assess or include the following categories:
- Group quarters like dormitories, prisons, treatment facilities
- Hospitals, treatment facilities
- Hotels, motels
- Public housing
- Charitable housing
The second group of categories includes very little square footage as compared to the first group. See additional analysis below.
Working with MassGIS Tax Parcels — Methods
MassGIS, in collaboration with municipal assessors, has done a great service by compiling a basic summary of assessors’ data on all property tax parcels in the state in a single repository. The repository includes (a) polygons supporting GIS mapping of property tax parcels; (b) the list of property tax parcels with an extract of basic assessors’ data about each; (c) a common identifier (“LOC_ID”) linking each parcel polygon to a property tax list list item; (d) auxiliary data. In this post, we are primarily concerned with the property tax parcel list — we are not looking visually at land use patterns; we are only trying to develop historical estimates of the total square footage and unit count of housing in the state.
There are several different software systems in use by assessors in Massachusetts. As a result, although there is a well-defined standard for the assessors’ extract, there is some variation across communities in how the data fields in the extract are populated.
Data download
MassGIS offers data downloads in several formats. On August 4, 2023, we downloaded “most current statewide data” in shapefile format. The download is designed to be used in mapping software. It includes a complete layer of polygons, each corresponding to a tax parcel, that would allow mapping software to present all the property tax parcels in the state in a map; MassGIS offers also such a map online.
For each parcel polygon, the download includes data from the assessor’s list. The parcel data are compiled in two .dbf files L3_TAXPAR_POLY_ASSESS_EAST and L3_TAXPAR_POLY_ASSESS_WEST. These files can be processed directly in any database management product; mapping software is not needed. We will refer these two files together as “the downloaded list file.”
The downloaded list file includes only those list items for which there is a parcel polygon, so a threshold question is the extent to which it is complete. MassGIS does make the individual assessors’ lists available and it would be possible to download each of the 351 assessors’ lists and compile them together. This seems like an unnecessary refinement because the downloaded list file is very nearly 100% complete as explained next.
Data download completeness
The MassGIS Standard for Digital Assessor Parcel Files, version 3.0, released June 2022, states that all 351 communities in the state are contributing their assessors’ parcel polygons and list in compliance with that standard. One element of that standard is a “matching standard” — a standard defining both (a) the rate at which a list item is present for each parcel polygon and (b) the rate at which a parcel polygon is present for each list item.
The first part of the match standard — the rate at which assessors list data is present for every parcel polygon — is defined as follows:
[T]he match rate from the mapping to the assessor’s database for communities with more than 1000 parcels will be at least 99% and
Section G, Matching Standard, within MassGIS Standard for Digital Assessor Parcel
for communities with 1000 or less polygons will be at least 98%.
This rate is not directly relevant to our analysis. We are not concerned with the quality of the visual layer. However, we cleaned the downloaded list file by deleting polygon records for which there was no corresponding assessors’ data. The downloaded list file initially included a total of 2,547,010 records. From that we deleted 11,639 records (0.46% all records ) which only included parcel identifying data and no property data, leaving 2,535,371 property records for analysis.
The second part of the match standard effectively defines the completeness of the downloaded list file as a list of properties (since properties without a matching parcel will be excluded from the list):
For communities with over 1000 parcel polygons the match rate for tax records with a structure valued at more than $1,000 must be at least 99.8%. For all other tax records, the required match rate is at least 97%. The match rate for communities with 1000 or fewer polygons is at least 99% for tax records with a structure valued over $1,000 and at least 95% for all other records.
Section G, Matching Standard, within MassGIS Standard for Digital Assessor Parcel Files
Within the downloaded list file, there are 318 communities with over 1000 parcel polygons and they account for 99.1% of the parcels. So, the 99.8% match standard applies to approximately 99.1% of the properties across the state and no communities are subject to a match standard below 99%. It follows that the downloaded list file includes approximately 99.8% of the properties in the original assessors’ lists that have a structure valued at over $1,000.
Data Currency within the Data Download
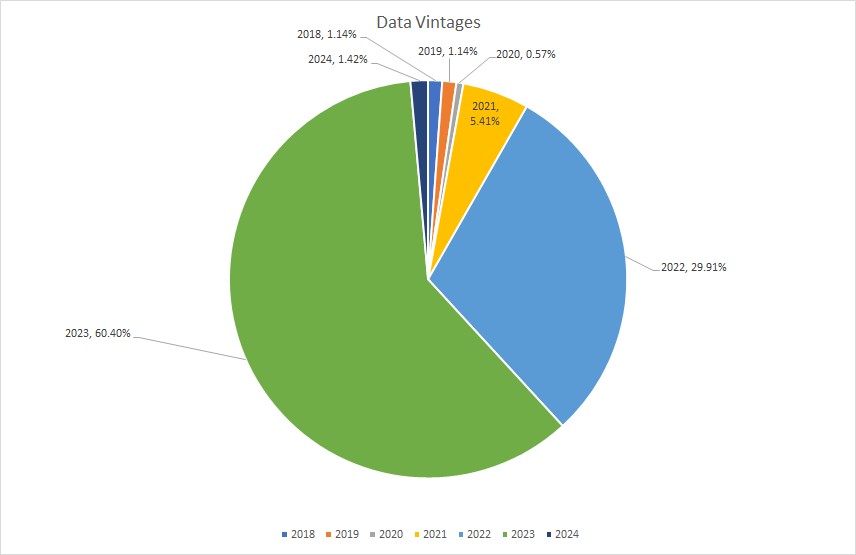
While all communities in the state have submitted assessors’ data meeting the MassGIS standard, not all communities are current in their submissions. The downloaded list file includes the latest submission for each community and therefore includes data of several different vintages. 97.2% of communities, including 98.9% of property tax list parcels, had submitted data current as of 2021 or after. Fiscal years for municipalities start on July 1 and end on June 30. Properties included for a particular fiscal year are valued as of the January 1 six months before the start of fiscal year. For example, data for Fiscal 2021 reflects properties as of January 1, 2020. The available vintage of data will be relevant in different ways to different parts of our analysis. Note that as of the download date, the chart below was consistent with the MassGIS parcel dashboard, which offers a mapping of the data vintages.
All 351 communities by fiscal year of assessors’ data present in downloaded list file (as of August 4, 2023)
Basic approach to using the assessors’ extracts
We think of the data on the assessors’ extract in three categories of descending reliability:
- Data items that directly determine the tax bill for a parcel — near certain to be accurate; subject to taxpayer appeal and litigation if not. We never impute values.
- Property use (which legally determines the applicable tax rate)
- Valuation
- Fiscal year
- Data items that strongly influence the valuation — very likely to be accurate. We never impute values, except in communities where local usage is clearly non-standard.
- Residential or building area
- Lot size
- Data items that less strongly influence the valuation — less likely to be accurate. Impute values on individual records when inconsistent with more reliable variables.
- Unit count
- Construction date (it does not turn out to be necessary to impute any construction date values)
Identifying properties as residential within the downloaded list file
Each property in the downloaded list file includes a USE_CODE based on the Property Type Classification Codes promulgated by the Division of Local Services. We use these codes to identify residential properties to include in our analysis following the principles discussed above. This code is present on 100% of the records; it has the value “000”, representing “unknown” on only 352 of the records (0.02%).
The DLS classification specifies 3-digit codes. The first digit classifies properties among broad legal categories of use. These broad legal categories have implications for property tax rates. The second and third digits further classify structures and uses.
| 1st Digit of DLS USE_CODE | High Level Legal Property Type Classification |
|---|---|
| 0 | Multiple-Use (second digit is primary use; third digit secondary) |
| 1 | Residential |
| 2 | Open Space |
| 3 | Commercial |
| 4 | Industrial |
| 5 | Personal Property (stock in trade, machinery, etc.) |
| 6 | Forest Property – Chapter 61 |
| 7 | Agricultural/Horticultural Property – Chapter 61A |
| 8 | Recreational Property – Chapter 61B |
| 9 | Exempt Property (Municipal and Charitable) |
Local property tax assessors occasionally employ three-digit codes that have been “intentionally left blank” by DLS. They also can add a fourth digit to further classify properties. As a result of this flexibility, there are a total of 1892 different USE_CODEs in the downloaded list file. The MassGIS data product does include a table a defining all of these codes as used idiosyncratically by communities, but for simplicity we have mostly limited our analysis to the first three digits of USE_CODE.
Most of the arguably residential property in the state falls in the small residential, condominium, and apartment categories, so definitional refinements are not critical. However we attempt to follow the EIA residential sector definition discussed above by excluding group quarters and charitable and public housing. This amounts to 1.55% of the residential square footage in the state. We include all residential mixed use and attempt to correctly classify non-standard 3-digit codes. See the source spreadsheet Use Codes tab for details.
Statewide total of RES_AREA (6. 0 billion sq. ft. before any imputation) by 3 digit Use Codes in downloaded list file
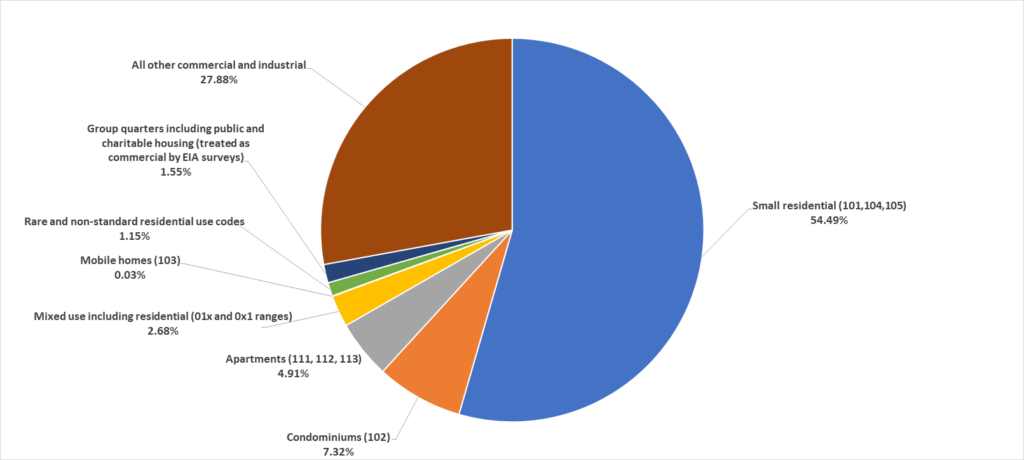
NOTE: The Building Sector Technical Report (“BSTR”) for the state’s climate plan used the same basic assessing data “as of 2016.” That likely means as of Fiscal 2017 (which is based on January 1, 2016 values). That report’s authors had to consider the same question — how to apply USE_CODEs to identify residential properties in their typology mapping (which went beyond residential). Appendix A to the Building Sector Technical Report inventories the USE_CODEs which they treated as residential. While the report cites the DLS code manual, it refers to the codes as MAPC codes. Possibly, the report relies on some partial reclassification of the USE_CODEs performed by MAPC, which could explain why the report omits USE_CODE 102 for residential condominium units, which account for 10.2% of the residential square footage in the state. Additional minor differences are inventoried in tab M4 of the attached source spreadsheet.
Imputing Missing Size Variables in the Data Download
Size variables in the data download
The downloaded list file includes three housing size variables: UNITS, BLD_AREA, and RES_AREA.
The UNITS field is defined as follows in the MassGIS standard:
UNITS – Number of living/dwelling units and also other units, for example, commercial condos and storage units in a warehouse (this was formerly named “LIV_UNITS” in previous standard version.)
Section D, Assessor’s Database Record Fields, within MassGIS Standard for Digital Assessor Parcel File
The BLD_AREA and RES_AREA fields ostensibly apply to different property classes — BLD_AREA to larger buildings; RES_AREA to smaller residential buildings. RES_AREA refers to “living area.” However, both values are present on 84.1% of residential records and they are equal on half of those. Both area constructs are based on exterior measurements (except for condominiums, where the measurement may be based on the condominium deed). Both area constructs come with a lengthy caveat that different communities may apply them differently.
BLD_AREA – This information applies primarily to apartment buildings and commercial/industrial properties; assessor’s data is based on exterior building measurements. Building area may be recorded as gross square-feet, adjusted gross square-feet, or finished area. Basement area may or may not be included
in finished area. Partial story-heights and attic areas may be treated differently by different CAMA systems. Gross area may include non-living areas such as porches and decks, or attached garages. Contact the specific community to be sure you correctly understand this information for that community.RES_AREA – Total residential living area in square feet (not gross building area) as defined by the assessor (e.g., this may or may not include only heated space). This is a useful attribute when evaluating development proposals relative to surrounding residences, but a difficult one to create because it may require adding areas from multiple fields in the assessor’s database. This information applies primarily to 1, 2 & 3 family dwellings based on exterior building measurements or residential condominiums based on deeded unit areas. Building area may be recorded as gross square-feet, adjusted gross square-feet, or finished area. Basement area may or may not be included in finished area. Partial story-heights and attic areas may be treated differently by different CAMA systems. Gross area may include non-living areas such as porches and decks or attached garages.
Section D, Assessor’s Database Record Fields, within MassGIS Standard for Digital Assessor Parcel File (italics added).
Choosing which area value to use as area metric
Following our basic approach of respecting the values entered by while recognizing local variations in data usage, our approach to choosing between RES_AREA and BLD_AREA as our area metric is as follows.
- For properties with a USE_CODE first digit of 0, the mixed use properties, we use always RES_AREA. If RES_AREA is zero, it could be a valid value reflecting that the only structures on the property have a non-residential use and the property is deemed mixed for some reason — perhaps the parcel includes a vacant area with residential zoning. Without reviewing and correcting individual records, we have no basis for replacing RES_AREA with BLD_AREA.
- For properties with a USE_CODE first digit of 1 — all of which should be purely residential properties — we generally assign RES_AREA even if it is zero. We never assume that assessors made an error. However, in particular communities and for particular residential use codes within those communities, if RES_AREA is non-zero for less than 10% of the properties but BLD_AREA is non-zero for over 90% of the properties, then we infer that the local assessors in that community are using BLD_AREA instead of RES_AREA to record residential area. In these cases, we will use BLD_AREA. For example, for single family homes, 346 communities populate the RES_AREA on 97.9% or more of their records. However, there are four communities that do not populate RES_AREA but do populate BLD_AREA for over 97.9% of their records. For those four communities, we use BLD_AREA for single family homes.
- For all other properties — commercial, industrial, and government — we use BLD_AREA.
The result of this algorithm is that for 98.79% of the residential parcels we use RES_AREA as the AREA_IMPUTED and AREA_IMPUTED is non-zero on 99.51% of the residential parcels. Both RES_AREA and BLD_AREA are zero on 0.44% of the parcels, so our choice algorithm is leaving an available value unused for only 0.05% of the parcels. Additional details at tab M6 of the attached spreadsheet.
There is little variation across different years of construction as to the completeness of area data. The AREA_IMPUTED is non-zero on over 98.7% of the parcels built in each year except 2017 where it is non-zero for 96.8%; it is non-zero for 99.7% or more parcels with units in all but 10 years. Details at tab M6A of the attached spreadsheet.
Validating AREA_IMPUTED
We are not concerned to validate the AREA_IMPUTED for individual properties. Our concern is only to assure that our analysis is not being heavily distorted either by a few unreasonably high AREA_IMPUTED values or by a large count of unreasonably low but non-zero AREA_IMPUTED values. Inspection of the chart below (which appears in the tab M7 of the attached spreadsheet) gives comfort on this concern. Outliers are insignificant for our purposes of looking at overall square footage.
Analysis of large and small AREA_IMPUTED values by USE_CODE_3 — looking for influence by outliers
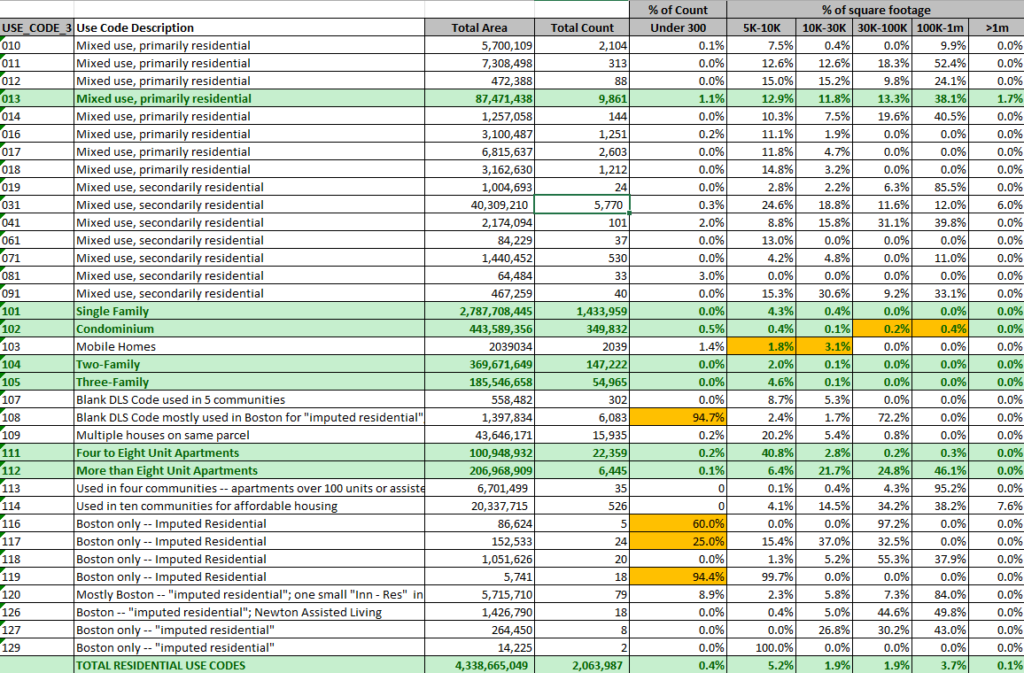
Some observations from the chart above:
- Among all residential property parcels, those with area under 300 square feet are only 0.4%. The count is not shown in the chart above, but there are 7,965 such properties in the state. Of these, 6,533 are in the city of Boston and all but 213 are parts of condominium properties; they are likely parking spaces. These Boston properties appear in all of the four yellow highlighted categories in the under 300 column.
- The yellow highlights in the mobile home row — mobile homes showing with unreasonably large square footage — are likely actually mobile home parks. They do not account for much area as a part of the total.
- The yellow highlights in the condominium row — condominiums units showing with unreasonably large square footage — are likely instances where the total building area is being attributed to the individual units. Again, not a large part of the total.
- The largest properties in the state — over 1,000,000 square feet — account for only 0.1% of total area and appear in multi-unit and mixed-use categories where large square footage is possible.
- Note that the percentages showing in the chart are percentages for each USE_CODE row. The chart therefore gives comfort about AREA_IMPUTED within all of the major property types which are highlighted in green. The under 5K area column is not displayed so details for area percentages do not add to 100%. But see tab M7 in the attached spreadsheet.
Imputing Missing Unit Count Values
On the downloaded list file, roughly half of the residential records in every major residential housing USE_CODE category have a zero UNITS value. This reflects varying data maintenance practices within communities. For example, focusing on USE_CODE 101 (single family homes), 168 communities have zero values in the UNITS field for over 95% of those properties. Other communities populate UNITS quite consistently. See attached spreadsheet tab M8 for more on population of the units value.
Additionally, some properties have non-zero unit counts inconsistent with their type. For example, focusing on USE_CODE 101, among the 183 communities that do populate the UNITS field, only 4 have exclusively the value one in the UNITS field, although 170 of them have the value one on more than 95% of their single family records. Among the 7465 single family property records with non-zero UNITS values other than one, 7,228 have a value of two. However, only 265 use any special fourth digit for the USE_CODE; among these, most indicate an in-law apartment. Among the bulk not specifically identified as having in-law apartments, no explanatory pattern jumps out.
UNITS appears to be a less reliable and less consistently populated field. Accordingly, we do override UNITS values not consistent with likely reliable data on the records — USE_CODE, BLDG_VAL, AREA_IMPUTED. We took the following steps for imputing missing UNITS and, in some cases, correcting UNITS.
- Among mixed use properties (01x or 0x1), 031 and 013 are the most common. We cannot use BLDG_VAL as it may reflect non-residential for these codes. We applied the following rules.
- if AREA_IMPUTED > 0, we impute missing units based on the statewide average area per unit for the class
- if AREA_IMPUTED = 0 and BLDG_VAL > 0, we impute missing units equal to the average number of units for the class — we cannot do a computation based on BLDG_VAL because it could include non-residential value.
- if AREA_IMPUTED = 0 and BLDG_VAL = 0, we do not impute units (infer vacant land).
- For the residential primary types (01x) and for the combinations of land with residential (021, 061, 071, 081), we inspected the results of the preceding rules carefully and concluded that the methods were treating many single family homes (identifiable by the STYLE field) as multi-unit. We corrected 2,200 of these records to a final unit count of one.
- For single family (101), two family (104), three family (105) USE_CODEs, we do not alter non-zero unit counts, but where units are zero impute the expected unit count except . . .
- where AREA_IMPUTED is non-zero, but < 150 (infer a parking space or accessory building)
- where BLDG_VAL and AREA_IMPUTED are both zero (infer vacant land)
- For mobile homes (103), we follow the same rules as for small residential properties, not overriding non-zero original units count — thus some 103 properties have high unit counts. The USE_CODE 103 is used both for mobile homes that have been permanently fixed in place and for land allocated to a trailer park. Mobile homes that are not permanently in place are not subject to local property taxation. Some of the 2251 properties coded 103 have high unit counts and little built area, consistent with the property being a trailer park and the trailers being counted as units. Other properties coded 103 are clearly single mobile homes that have been located on a property and anchored. It appears likely that some 103 parcels that are coded with zero or one units actually include multiple truly mobile homes. Since our focus is not property taxation but energy use measurement consistent with EIA definitions we want to count the mobile homes on the trailer parks to the greatest extent possible, but we probably haven’t.
- For miscellaneous categories (107,108), we do not impute units — where these properties have zero units, they appear (with some exceptions) to be parking spaces, vacant land, or out-buildings.
- For multi-unit properties, use codes (109, 111,112,113,114)
- if AREA_IMPUTED > 0 we initially compute units based on the statewide average per unit area for the class
- if AREA_IMPUTED = 0 and BLDG_VAL > 0, we initially compute units based on statewide average building value per unit
- if AREA_IMPUTED = 0 and BLDG_VAL = 0, we do not impute units (infer vacant land)
- after applying these rules, we did a second pass for each of these classes individually, regressing known UNITS (non-zero, consistent with the class) against non-zero AREA_IMPUTED and non-zero BLDG_VAL. This overwrites most of the rules above since AREA_IMPUTED and BLDG_VAL are both present for most units.
- Boston “Imputed Residential” USE_CODEs (116 to 129) — 265 properties. All have building value, but 34 have single-digit or double-digit building values (likely actually unit counts, but have no basis to correct the value). About half have area. We built a second layer regression model using true building value and imputed unit counts from the previous regressions for 111 and 112; we included only Boston properties (in effect using coefficients based on non-Boston data, but blending 111 and 112 in Boston proportions).
Year Built
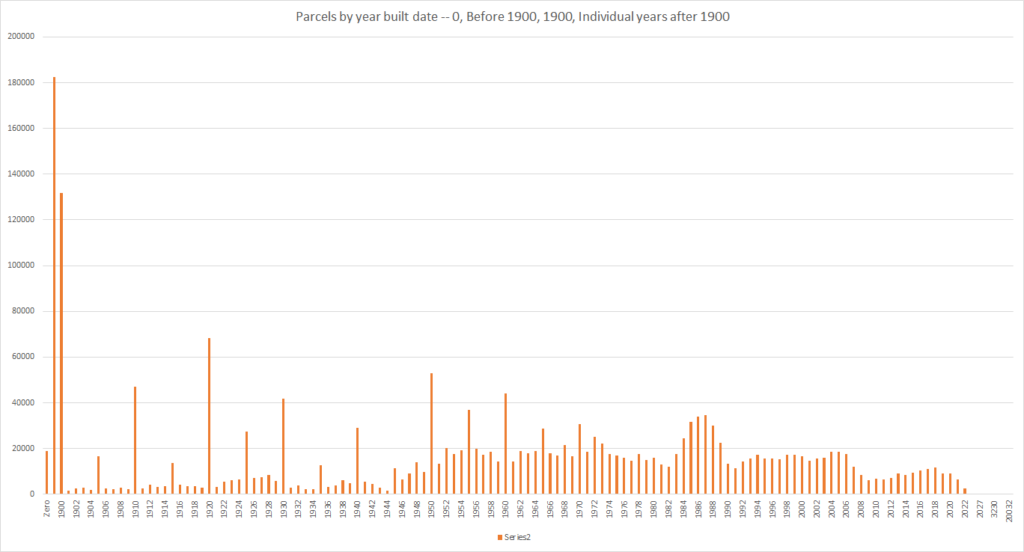
YEAR_BUILT is populated for 99.0 percent of the parcels with a non-zero unit count, but we do not have easy method for deciding how to fill the other 18,803 zero values. We do not impute any values to YEAR_BUILT. It is, however, reasonable to guess that older properties are more likely to lack a record built date. Our working assumption is that most of the properties were built before the period of our primary interest which is after 1960. There are 9 properties with dates before 1620; six with invalid dates after 2023; none with dates after the fiscal year vintage of the reporting community.
Even where supplied and plausible, year built is apparently approximate as there is a preponderance of round number values (ending in 0 or 5) before 1980.
Parcels by year built date — 0, Before 1900, 1900, Individual years after 1900
Data Downloads
- Spreadsheet including all data source links and all calculations underlying presented charts
- Statewide parcel list from MassGIS with units and residential area imputed as in this post (170MB)
- Single zipped comma-separated text file
- Column names as in MassGIS file (see page 23 of MassGIS documentation) with additional fields
- FINAL_RESIDENTIAL (‘Y’ OR ‘N’ — classified as residential?)
- FINAL_UNITS_IMPUTED (unit count for the property)*
- FINAL_AREA_IMPUTED (RES_AREA or BLD_AREA)
- FINAL_BUILDING_UNITS (equals FINAL_UNITS_IMPUTED for residential properties except for condominiums)
- FINAL_UNIT_AREA (= FINAL_AREA_IMPUTED/FINAL_UNITS for residential properties with FINAL_UNITS>0)
- Address information redacted, but community identifiers retained
- Access database showing all steps in extraction of MassGIS data and imputation of missing data (1.22GB)*
- This post as originally published on August 27, 2023 as a Word.docx (formatting imperfect and corrections not applied)
*NOTE: The data include a confusing result in FINAL_UNITS IMPUTED for 76 very high value estate properties mostly on the Vineyard and Nantucket. These are all categorized under USE_CODE 109 (Multiple buildings on a single lot). For these properties, the FINAL_UNITS_IMPUTED is a negative number. The regression analysis imputing units for this use code, driven by some very high valuations, assigned a negative coefficient to building value. For these 76 properties, the units are understated by approximately 200 in total. However, we used the best fit regression for the USE_CODE — some low value properties in the 109 use code likely have over-stated unit counts. The total of all units for USE_CODE 109 is therefore correctly estimated in the charts presented above and since area averages are based on totals, these are also correctly estimated.
Return to heat pump outline. Or return to housing outline.
As a heating professional I can tell you that it’s not only the square footage of the dwelling that determines how much fuel will be consumed for heating and cooling, but more importantly the construction, age of heating equipment, and habits of the occupants. I hope this data didn’t cost the taxpayers too much…
[I]t’s not only the square footage of the dwelling that determines how much fuel will be consumed for heating and cooling, but more importantly the construction, age of heating equipment, and habits of the occupants
Thank you, Ken. Agreed. Of course. But building scientists use kbtu/sqft/year as one metric of energy use that is influenced by all of the factors you mention. See, for example, the state’s Building Sector Technical Report at Figures 15 and 21. The purpose of this post is to develop reliable historical statewide estimates of square footage that can be combined with other data elements to ballpark average performance.
While, as you say square footage estimates mean little in themselves, they are valuable in combination with other data. I would have been glad to use taxpayer funds to obtain these historical estimates and I was surprised that my initial survey showed that they were not already available. However, procurement would take months so I’ve made it a project for me personally on nights, weekends, and vacation days.