
This post explores the precipitous drop in home energy consumption and related carbon emissions that occurred over three years from 1978 to 1981 and concludes that it was mostly the result of behavior change — turning thermostats down in response to high oil prices — as opposed to a quantum leap in energy efficiency. I’d be interested in hearing from people who remember how households cut energy consumption in that time of crisis.
The drop in energy consumption
Total energy consumption dropped from 1978 to 1981 because Massachusetts households used 51% less heating oil in 1981 than they did in 1978. 1978 was not an especially high year to fall from — Massachusetts oil consumption in 1978 was, despite the famous blizzard, slightly below the average for the ten prior years. The chart below shows that the sharp drop in total Massachusetts energy consumption that occurred from 1978 to 1981 is unique in our recent history. The question for this post is: How did we cut oil consumption so suddenly?
Chart 1: Massachusetts Residential Energy Consumption (TeraBTUs): 1960-2021
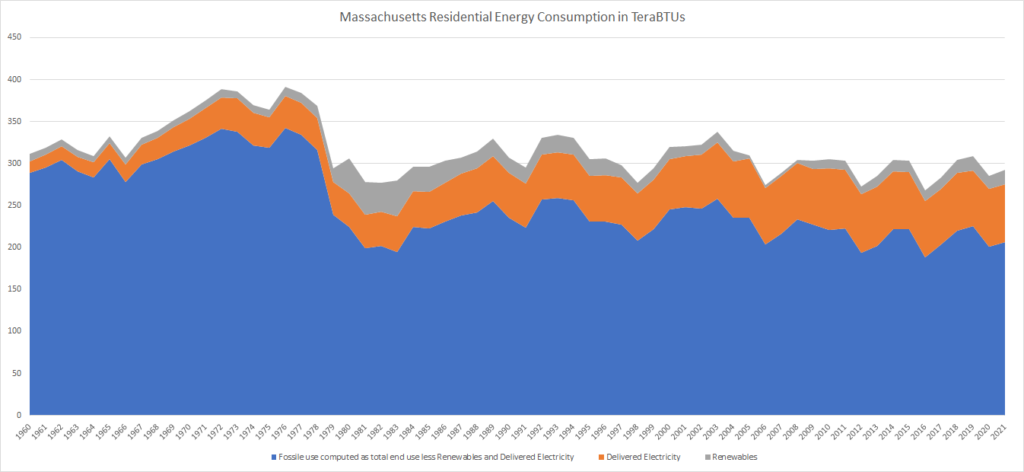
See discussion, sources, and notes in this post.
Technical note on data accuracy.
A threshold question is whether the above numbers from the Energy Information Administration’s State Energy Data System are accurate in showing a sudden drop from 1978 to 1981. The EIA warrants that:
The goal of [the State Energy Data System] is to provide historical time series of energy production, consumption, prices, and expenditures by state that are defined as consistently as possible over time and across sectors. SEDS maintains these estimates for Members of Congress, federal and state agencies, the general public, and as inputs for EIA’s energy models.
Introduction to the technical notes to the State Energy Data System.
EIA exhaustively discloses limitations to its data. A careful review of the technical notes on the petroleum consumption estimates confirms that the precipitous decline in Massachusetts residential oil consumption from 1978 to 1981 was not due to any known flaw in the time series:
- As to distillate fuel oil for heating, the petroleum notes explain that prior to 1979, the major end use sectors — residential, industrial, commercial, transportation — were not distinguished in the sales survey instrument that was the basis of the estimates. The pre-1979 total is allocated to sectors based on the 1979 sectors shares, so from 1960 to 1978, the residential share is stuck in place at close to 70%. However, the measured residential share after the dis-aggregation in 1979 remained quite stable — varying between 65% and 75% for twenty years.
- From 1979 through 1982, the data were collected with a consistent methodology. These years include much of the sharpest decline.
- For 1983, there was no sales survey allowing allocation at the state level, so the 1983 data points are estimates based using the 1984 survey to allocate national 1983 consumption.
- For 1984, the supplier survey form was modified, but the discussion at page 39-40 of the petroleum use notes, does not suggest that the changes affect the residential category. A comparison of the “residential sector” definition used in Form EIA-172 from 1979 to 1982 (appearing at page 151 of the Petroleum Supply Annual for 1982) with the current definition on Form EIA-821 confirms that they both refer to private households excluding farms and apartment buildings. Further, the residential share of total state heating oil consumption remained almost constant, near 70%, from 1979 to 1982 — so the drop in the residential sector is not explained by a shifting allocation to other sectors.
- There were survey methodology changes in the 1984 survey. There had been response-rate problems due to the complexity of the EIA-172 form. However, state and sector totals in the published data series are normalized to match total national production numbers and the Massachusetts residential sector distillate estimate for 1983 (102.3 teraBTU, based retroactively on the new methodology) is almost the same as the 1982 estimate (105.4 teraBTU, based on the earlier method).
None of these acknowledged limitations of the EIA’s estimates suggest a distortion that would manufacture the apparent dramatic drop in residential oil use in Massachusetts. Moreover, the EIA data show a similar drop in oil consumption in the same three-year period in most of the New England states.
A second data source from the EIA — the Residential Energy Consumption Survey — provides further confirmation of the dramatic drop. While the yearly data above are based on total supply of oil and sales by suppliers, the RECS is a direct survey of consumers. The RECS showed average heating oil consumption per household in the Northeast region of the United States dropping 28% from 1978 to 1981. A related report showed weather-adjusted national oil consumption similarly declined. RECS does not include individual state data. In general, EIA cautions users not to expect survey results to compare precisely to production-based time series.
A third set of numbers comes from a 1987 publication of what was then the state’s Executive Office of Energy Resources. That publication offered residential “oil” use estimates that appear to lump propane in with heating oil. Those estimates showed a 32% in drop Massachusetts residential oil consumption from 1978 to 1981. That publication’s technical appendix, which might explain the methodology, appears is not in the state library and appears to be lost to posterity.
All sources show a dramatic drop in energy consumption. However, the EIA State Energy Data System estimates are the most exhaustively documented and now form the basis of the state’s greenhouse gas inventory. In the discussion below, we rely primarily on the SEDS data as the best available record of energy consumption and prices in the 70s and 80s.
The price shocks
It is an important background fact that, in the 1970s, even before the oil price-shocks, energy prices were two-times higher than they are today in relation to income. Fifty years ago, incomes were lower and Massachusetts consumers were somewhat more vulnerable to escalation in energy prices.
Massachusetts residential sector total energy expenditures as % of state personal income, 1970 to 2021
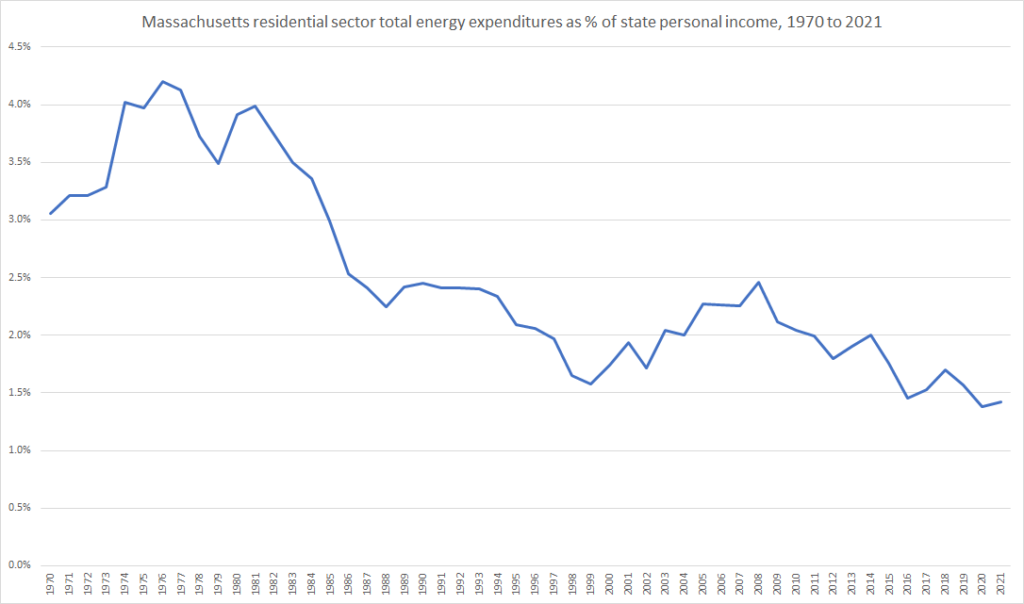
Note see “Energy Prices” tab in attached spreadsheet.
The late 70s and early 80s featured not only rapid growth in energy prices, but rapid inflation in consumer prices overall. When asked the standard Gallup “most important problem” question, respondents put inflation generally as the top concern in the late 70s and early 80s. 83% of respondents named inflation as the top problem in 1979, as energy and all prices surged. (By contrast, in recent polling, only 31% name any economic issue as the most important problem and under 0.5% named fuel prices per se.)
Chart 2: Annual changes in CPI and delivered oil prices in Massachusetts, 1971 to 1990
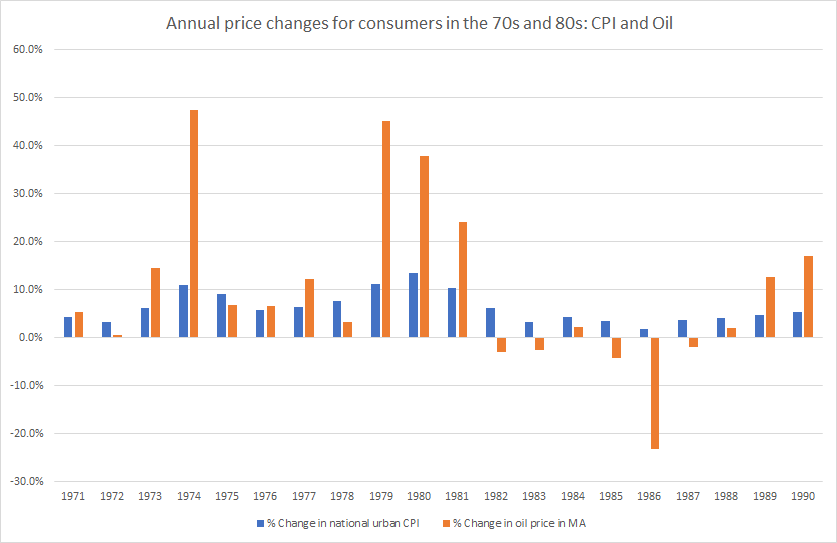
Note: See attached data spreadsheet at the Energy Prices tab for sources and computations.
The sharp drops in oil consumption in Massachusetts starting in 1978 correlated directly with the successive price oil increases from 1978 to 1981 that built upon the shock of 1973. The chart below pulls out the oil price changes from the chart above and compares them to changes in oil deliveries in Massachusetts.
Chart 3: Massachusetts oil price changes (orange bars, left axis) vs oil deliveries changes (green bars, left axis) and oil deliveries total (line, right axis), 1971 to 1990.
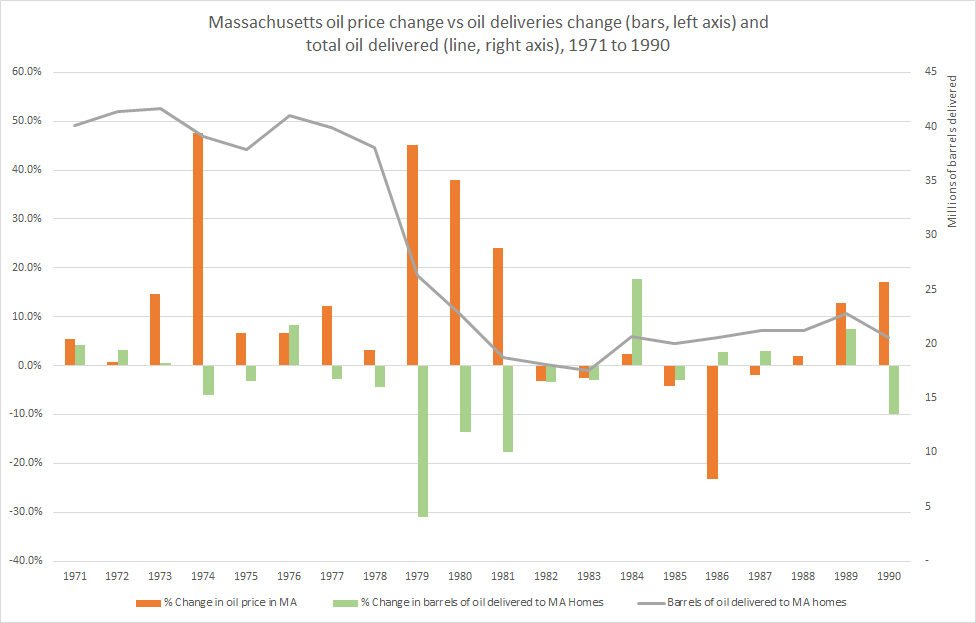
Note: See attached data spreadsheet at the Energy Prices tab for sources and computations.
How did we actually cut oil consumption?
Clear as it is that the price shocks drove down consumption, the question remains: How did Massachusetts residents cut residential heating oil consumption (51% in a mere three years from 1978 to 1981)? Then as now, there were four major strategies available for cutting home oil consumption: Switching to other fuels, using more efficient oil burners, improving home energy efficiency (insulation, air sealing, and improved windows), and changing behavior (lowering thermostats and being more careful about windows and doors).
Fuel Switching
Among the oil-reduction strategies, fuel switching is the one that we can quantify with the most confidence. In the three years of the dramatic oil consumption drop, from 1978 to 1981, fuel system switching did play a role. The chart below shows the net change in energy consumption for individual fuel types. Fuel switching, especially to wood, offset 30% of the drop in oil consumption on a gross energy basis. However, oil burners are much more efficient than fireplaces and often more efficient than wood stoves, so the delivered comfort offset was less.
Chart 6: Massachusetts house heating fuels, change in energy consumption by fuel type, 1978-1981 (TeraBTUs)
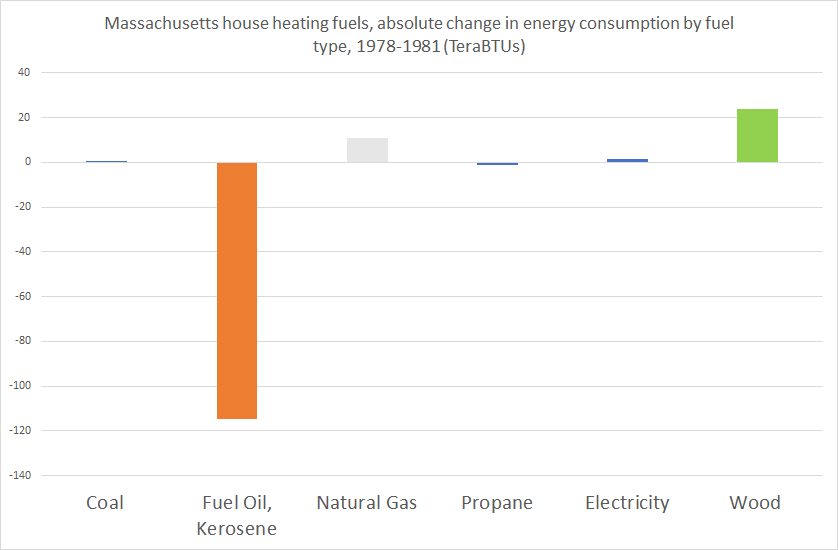
Note: See attached spreadsheet, Energy Use and Energy Use Excerpt tabs.
Note that heat pumps were not a major part of the fuel switching response, at least in the Northeast: In 1982, after oil consumption had dropped, only 200,000 out of 18 million homes in the entire Northeast region were using heat pumps as their primary heating source in 1982. High performance cold climate heat pumps were not yet available.
Burner Efficiency
According to Newspapers.com, oil burner efficiency was mentioned 2,364 times in Massachusetts newspapers between 1978 and 1981. However, upgrades to burner efficiency were likely a relatively minor factor over the three years in question. In 1984, roughly half oil of burners in single family homes were over 15 years old. This suggests that the supply-chain and the professionally qualified HVAC work force necessary for burner replacement was sized to handle new construction and replacement of burners roughly every 30 years, perhaps 3% of burners each year. The 1980 Conservation report from the Residential Energy Consumption Survey (Tables 10B and 11B) found an even lower replacement rate: only 2% of respondents in the Northeast reported installing a new furnace in 1977 and 1% in 1978. Even supposing that a plausibly higher percentage of oil burners were upgraded annually from 1978 to 1981, the available efficiency gains available are typically less than 20%, so the total savings over three years would be very modest. (For example, if the efficiency gain from upgrade was 20% and 5% of burners were upgraded, the oil consumption change would be only 1%.)
Home Energy Efficiency
Clearly, there was a sudden surge in interest in energy efficiency in the 70s. Using mentions found in Massachusetts newspapers on Newspapers.com, the graphic below shows how interest in energy saving behavior and energy saving home improvement surged in the 1970s and 1980s (and quieted down after 1990). Note that the graph does not cover the period after 2000, because newspaper mentions of even the most common terms declined sharply as print journalism contracted.
Chart 4: Occurrence of phrases related to energy savings in Massachusetts newspapers: 1960 to 2000 — note that the vertical scale (not shown) varies for each search term.
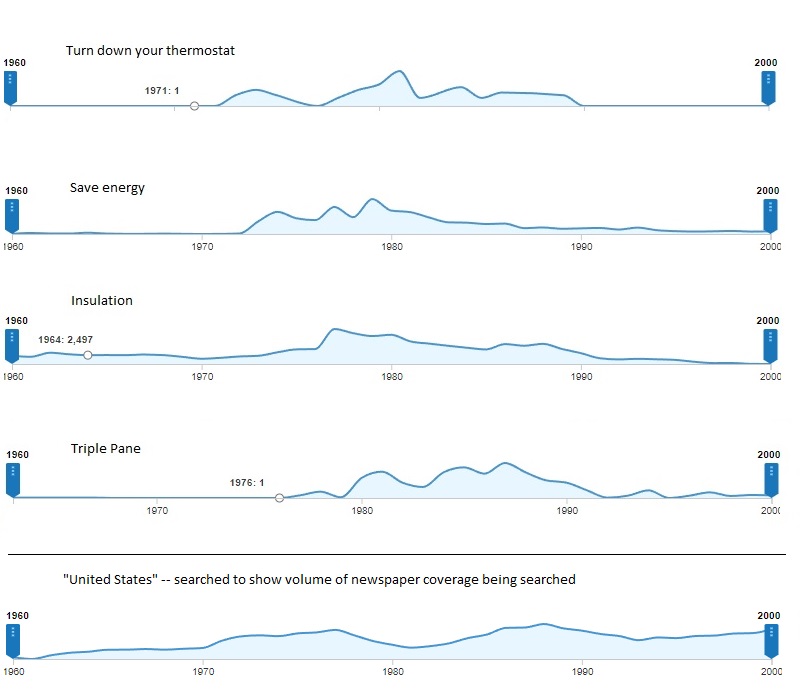
Source: Screen prints of searches performed on Newspapers.com on September 4, 2023.
The newspapers of the late 70s ran columns explaining insulation and offering do-it-yourself tips:
- The Lowell Sun ran an insulation explainer 1975 leading with “Despite all the recent talk about insulation, few consumers know exactly what insulation really is, what it does, or even how or where to buy it.”
- The Boston Sunday Globe in 1975, carried an article captioned “A little know-how and work will save a lot of fuel”, offering tips on insulating attic, walls, basements, pipes, and ducts.
- In April 1977, the Sunday Globe Page 2 was a full page on “How do I go about insulating my home?”
- In September 1977 the Globe’s Home and Garden page, featured an article titled “It’s insulation time, where and how to do it.”
- The Globe’s Mr. Fix-it, to his credit had written about insulation as early as November 1970, but that story ran on page 48-B.
- The Globe, in 1977 and 1978, carried full page ads from manufacturers of competing insulation types — fiberglass and cellulose.
- The Berkshire Eagle in 1977 ran a news service column captioned “Insulation, cheaper than fuel,” exhorting consumers: “Although very few people nowadays have ‘money to burn,’ most experts agree that nine out of 10 homeowners actually doing just that by not having their houses adequately insulated.”
- The Lynn Daily Evening Item in 1979, with some dated assumptions, empowered women to do their own home insulation work: “If you can put shelf paper on kitchen cupboards, you are skilled enough to tackle insulating an unfinished attic, a crawl space, or a wall between an unheated garage and the living area. . . ..”
The market took off after President Carter proposed the goal “to insulate 90 percent of American homes and all new buildings” by 1985. The market was perceived by some as overheated: the Holyoke Daily rumored shortages of insulation materials, and warned consumers against “insulation wolves.” Nationally, “insulation worker” was among the fastest growing occupations between 1972 and 1980, growing 97% over the period. The “insulation worker” occupational category almost tripled from 1970 to 1990 and then leveled off; note that definition changes account for much of the apparent drop from 1990 to 2002.
Chart 7: National employment in the “Insulation Worker” occupation — note, the drop from 1990 to 2002 is largely an artifact of definition changes.
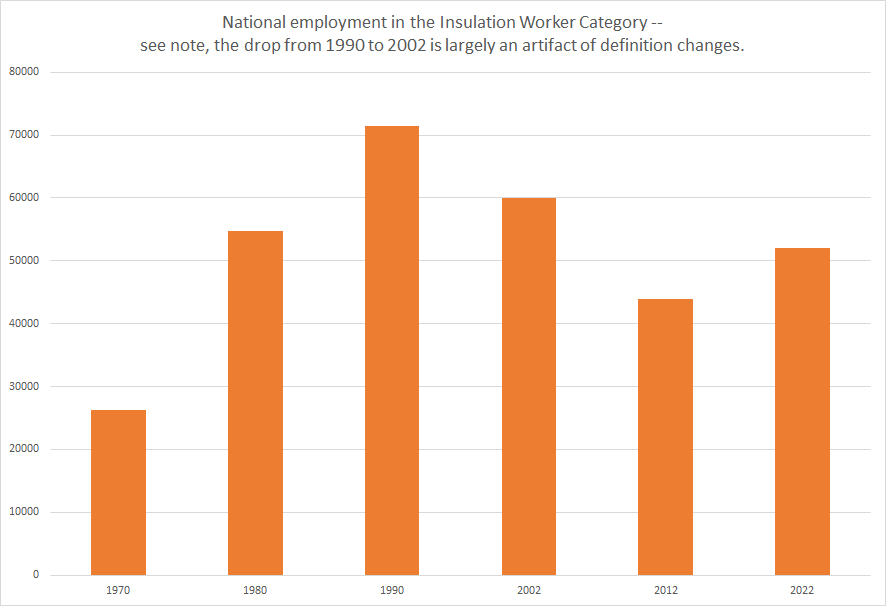
Note: See “Jobs–CPS” tab of the attached spreadsheet for details of definition changes.
As the “insulation workers” increased, insulation contracting firms multiplied and expanded. The chart below compares the growth since 1978 of employees of drywall and insulation contractors to the growth of construction contractors overall, showing both the United States and Massachusetts. The chart shows the cyclical nature of the construction industry generally and the drywall and insulation contracting in particular, but it also shows a sustained relative growth of the drywall and insulation contractor category within Massachusetts starting in the late 70s and continuing over the past few years.
Chart 8: Expansion of Drywall and Insulation Contractor employment vs. all Construction employment: 1978 to 2022 — employee counts indexed to 1978
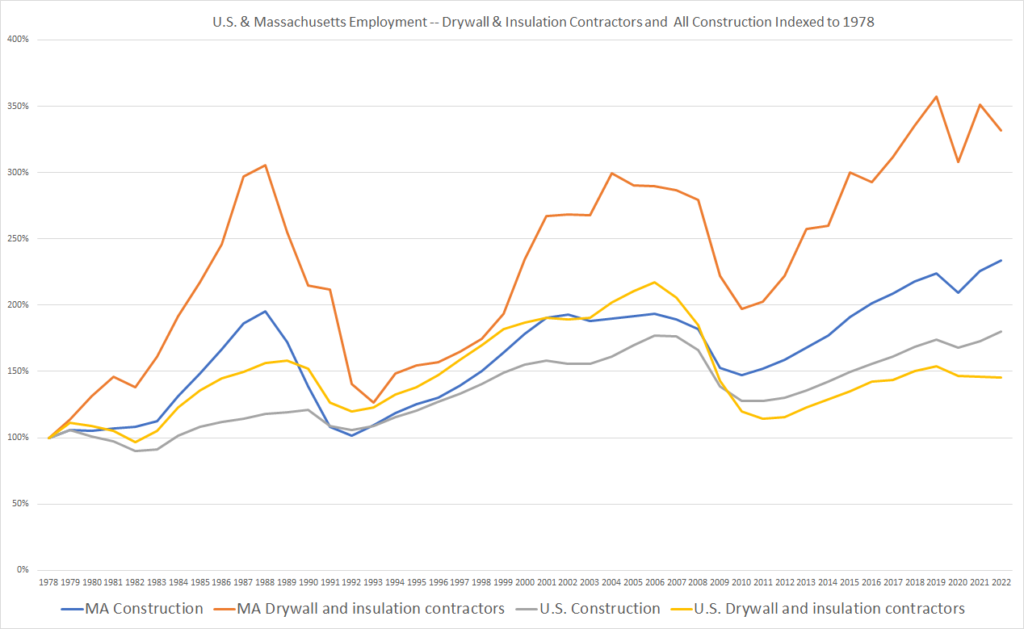
Note: Note that only roughly 11% of the employees of Drywall and Insulation Contractors identify “insulation worker” as their occupation. They include drywall installers, carpenters, and others who might or might not be doing insulation work on any given day. They also include sales people, managers, etc. See “QCEW — Summary” tab of the attached spreadsheet, for details.
The statistics in the two preceding charts have two contrary implications as to the mix of causes of the sharp decline in residential oil consumption from 1978 to 1981. One the one hand, they tend to confirm expanding demand for insulation in those early three years. On the other hand, we know that the actual recent decrease in energy use intensity in recent years has only been about 1% per year, even though the insulation work force appears to be three or more times larger now then it was in the 1970s. While we cannot quantify the DIY work, the actual volume of large job professional insulation activity was probably less then than it is now.
In fact, the 1980 Conservation report from the Residential Energy Consumption Survey showed that in the 21 months between April 1977 and December 1978 (a period of tax credit eligibility — effectively two seasons of feasible outdoor work), 47% of housing units did inexpensive insulation measures like weatherstripping, but only 9% insulated an attic and only 4% insulated outside walls. The survey question (#41) was worded so that additions to existing attic or wall insulation would count.
The first few insulation improvements make the biggest difference when starting from a completely uninsulated structure, but we do have survey data showing that even in 1978 in our climate, most homes had some insulation already. The same 1980 Conservation report offered the following as to the energy-related characteristics of housing units in the climate zone including Eastern Massachusetts as of the 1978-79 winter:
- 95% of housing units had one or more of the following: storm doors, storm windows, or attic or roof insulation.
- 77% had attic insulation.
- 57% had wall insulation
A follow-on study of Residential Conservation Measures done at Congressional Request, looked back from 1986 and concluded that:
That does not mean that no improvement occurred, only that it was too small to reliably detectable in the RECS survey. In raw terms, from 1978 to 1984, the percentage of single family homes in the Northeast with attic insulation did increase from 76.6% to 80.1%, but this increase was not statistically significant — there is enough noise in the survey that insulation actually declined in the sample from 1982 to 1984.
An expansion of insulation does not directly translate into an equal reduction in oil consumption — any percentage increase in insulation has to be discounted to reflect the efficiency improvements that the insulation actually affords and should cause a somewhat smaller percentage reduction in oil consumption. Even postulating overall insulation prevalence and quality increases more robust than observed, the impact of efficiency improvements over a mere three years has to have been modest.
Behavior Change
The bulk of the dramatic drop in oil consumption appears to be unexplained by fuel switching or by efficiency improvements. The authors of the follow-on study of Residential Conservation Measures did note the incongruity of the dramatic energy use declines and the lack of dramatic physical investments that would lead to greater efficiency.
An earlier EIA survey summary had already put the pieces together, noting an apparent significant shift in reported indoor thermostat settings between 1973 and 1981:
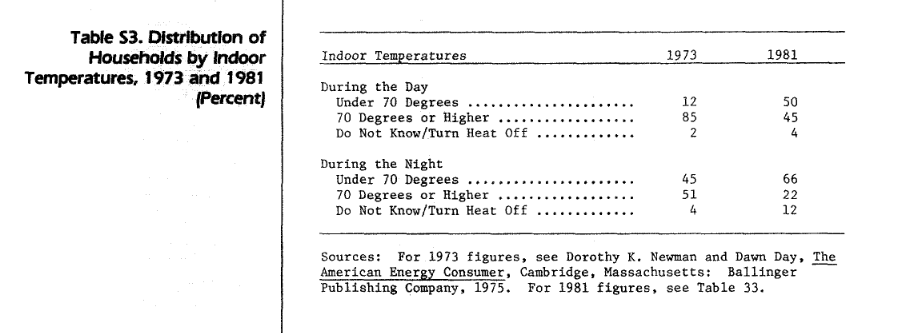
It seems clear, given at least one data point and the lack of any other good explanation, that the drop in consumption had to be heavily driven by behavior changes: People started paying attention. They turned their thermostats down, feeling heavy price pressure.
The current recommendations on thermostat settings involve modest setbacks to optimize energy savings and comfort — setbacks that generate savings of perhaps 10%. The actions taken by many consumers in 1980 were more drastic — sacrificing comfort. I personally recall my mother’s sense of urgency about cutting our oil bills. I overheard continuing discussion between my Massachusetts mother and my Southern California father about how warm the house needed to be. My mother was a problem solver: She took President Carter’s sweater performance to higher level. She made huge fuzzy bathrobes for herself and my father to wear around the frigid house.
There is a sophisticated literature about how to motivate energy conserving behavior, but for consumers at the kitchen table, a suddenly doubled heating bill in the context of an already tight family budget is a strong call to action. Consumers were well aware that there was a relationship between their bills and their thermostat settings.
Conclusion
People heating with oil in Massachusetts in 1978 faced a compelling call to action in the form of dramatic price increases. They switched fuels, upgraded burners, and undertook many efficiency improvements, but most significantly, they apparently sacrificed home comfort to control their heating bills. That period, although an impressive demonstration of collective will, probably does not provide a good model for meeting our current decarbonization challenges through public policy — no democracy will self-inflict the pain that consumers felt in the late 70s and early 80s. And that pain was not sustainable: As prices went down, consumption ticked back up. Combined oil and gas energy use in the residential sector in Massachusetts rose 22% from 1981 to 1993.
The good news is that the energy conservation efforts initiated in that crisis created momentum that has been sustained for decades, leading to a slow but steady improvement in the energy efficiency of our existing housing. Today’s MassSave energy audit program originated in early 1982.
Do you remember those days? You can share your recollections below.
Resources
- Spreadsheet including data sources and calculations in this post (as well as some data on energy use and energy related employment not included in this post)
- Post on rate of improvement in efficiency in existing housing stock.
I remember those days well. The dramatic increase from very steady and low oil and gasoline prices threw everyone off. Gasoline that could be found for less than twenty cents a gallon in 1970 was now over a dollar. We went through gas lines in the mid-70’s. We felt a new vulnerability to foreign actors.
One thing that many people did both at home and in places like schools was drastically reduce ventilation so as not to have to heat outside air. This had negative health impacts later, but seemed like a good idea at the time.
I think the big takeaway is that people react dramatically to sudden change. People also bought smaller cars. When the pressure relented, many of us returned to our more comfortable ways.
I think that’s right — everyone knew what was happening, if not why. They knew what they had to do.
My family installed a wood burning stove and used that as a strong-secondary-to-primary heat source until fuel prices came back down.
Yes! I remember helping my parents bag fall leaves and putting the bags around the house for insulation. We also stuffed rags under the doors to cut down on drafts.
“Fifty years ago, incomes were lower and Massachusetts consumers were somewhat more vulnerable to escalation in energy prices.”
While technically accurate, it’s not like things have improved. Yes, fuel is cheaper relative to income in the ’70s, but incomes have not grown proportionally since then, and food, housing, and other expenses have skyrocketed (relative to income).
But how did we “manage” in our house? I was just a kid, but truth be told, we didn’t. We froze. You could see your breath in our house, and we got frost on the inside of the upstairs windows where the bedrooms were. My father kept the thermostat at 55, and my mom would put it up to 60 on Saturday mornings as a treat. I took baths to warm up. Most of my friends’ families switched to wood stoves and I was always eager to visit their houses.
We had no air conditioning in the summer.
Thank you so much for sharing. I think a lot of families did make sacrifices like this!
Extraordinarily comprehensive and fascinating analysis. Congratulations.
I certainly do remember those years and our efforts –in our three family house with the thermostat in our unit– to direct more heat downstairs (by closing ducts in our unit) so the tenants would be warmer and living, ourselves, with a bit less heat and more indoor layers (fleeces, sweaters, down-vests, etc.)
In 2019 we installed heat pumps for each of the three units so that each now pays for heat and controls their comfort level (cooling or warming.). We are still frugal about our use of heat and continue to wear extra layers in the winter. I should mention that as we approach our 80’s, our tolerance of the cold has decreased and we keep the thermostat higher during the day (closer to 70) than we used to.
A somewhat counterbalancing result, however, is that we use air-conditioning hardly at all. In this especially hot summer, I think we’ve used it fewer than five times–and then only briefly to reduce the humidity. As we don’t mind ‘warm,’ we also set the thermostat at 87 degrees. The result? The first floor where we spend most of our time during the day is comfortable enough –and our minimal summer use of the heat pump saves energy.
Vbr,
Michael
We were a family of eight, two parents and six children. I remember all the disagreements at home about turning down the thermostat, but that was our parents’ edict and we had to do it. We put on sweaters and got blankets for the living room. We car pooled more and (sadly) for a few years did not put out Christmas lights. We never ate out in those days and cooking big meals for eight kept part of the house warm.
Yes. It was a big change — lots of talking about the thermostat!
Perhaps it was the image of sweater-clad Governor Dukakis during the Blizzard of 1978 that inspired us, or the fact that my wife is from Maine, but we just put on layers of clothing and kept the thermostat low back them. Old habits die hard. Our setting is still 63F.
In the late 70s I was part of a 3-household, 3-generation extended family. In the winter everyone turned down the thermostat (to varying degrees — the home with small children was warmer than ours), wore sweaters and warm vests, drank hot beverages, and got lap blankets for the living room and desk areas (I still find lap blankets cozy). I rebelled when my parents let the house get below 58. In the summer we developed habits of opening windows and turning on fans at night, closing insulating curtains/shades by day, never using the oven, choosing quicker-cooking meals, and trying to keep lights and other heat-emitters off, all of which I still do. We walked when we could and carefully planned and bunched errands to minimize driving. These decisions were partly about saving money, but also reflected environmental concerns, which we discussed a lot.
We bought our first house in 1980 and immediately replaced the oil burner with natural gas. Because of Jimmy Carter’s leadership, we were able to receive federal tax credits for insulating our house, installing storm windows, and installing solar panels to supply much of our hot water. That solar hot water system is still going strong 43 years later! (And there was enough space left on our roof to install more solar panels to supply our electricity in 2015.)
Glad to know the solar hot water is still running! We are in year 13 on ours.
In the late 70’s I was a low income, single parent living in Western MA. What did we do out there? We turned the heat WAY DOWN, and lived cold for years. Everyone I knew did the same. I bought my first house at that time and installed a wood stove and cut my own wood and heated it that way. I cut wood from my land, as well as other places.
It was depressing to see so many front yards and empty lots in the ‘hill town’ region of Western MA denuded of their trees. The DAR state forest opened to the public for wood cutting. I didn’t go there, but others did. I am sure it was well organized. We all got wood wherever we could find it, shared chain saws and pick up trucks and worked hard.
It was an invigorating time of people pulling together, self-reliance and learning new skills. We began to insulate our houses. We began to tolerate cold much better than we had in earlier decades. But many of us still remember that time as a time of being cold. Jimmy Carter was a good leader to us all.
We turned the heat WAY DOWN, and lived cold for years. Everyone I knew did the same. Yes! It was a national movement with Presidential leadership; unfortunately, we’ve snapped back.
Remember these were the embargo years AND lest you forget the Federal Government was involved in allocations of product at that time. Heating oil dealers had no idea from day to day if they were going to have product or not. It’s a telling lesson of what can happen when Government intervenes in the free market. It’s never good.
My house was converted to gas 1979 and we lived with single pane windows for 2 decades before we upgraded all the windows to double pain and what a difference in no more drafts . My parents kept thermostat stat down and all of us wore sweaters indoors ! We spent time in basement with dehumidifier on as no central air until much later .
Everyone of us should try conserving what’re ever energy we can . Let’s keep doing what we can . Go Belmont !
As a heating oil dealer I can attest to the fact that delivered volume dropped during that period, but nowhere near that dramatically – at least for our customer base. Over a decade or so volume did come off – we installed a LOT of new high efficiency heating systems (oilheat was the first to meet the EPA mandated 78% efficiency ratings – long before gas equipment did). People also bought wood or coal stoves, turned down the heat, and did other insulation and thermal envelope upgrades. It was really a combination. It’s a wonder why the State and Federal Government aren’t paying more attention to upgrading insulation, windows, and doors in homes. Simply switching to heat pumps leaves that part undone. In regard to heat pumps why is it that the Legislature is considering a bill to eliminate electric supplier choice? Last winter, when National Grid jumped 64%, I was able to use a third party supplier for a rate that was about 40% of NG’s. Now the State wants to take that option away? Please explain. It appears that the Legislature is in league with the utilities on this issue.
Not sure if heat pumps are a good idea, They are fine now. somehow we involuntary investors in the electric system. No meaningful choice in electricity cost, yes there are some differences, but I fill my oil in the summer at lower cost, can choose my dealer. I can see electricity going way up as more switch over. With continuous growth in electric usage we will never get off Nat Gas for taking up the slack in demand spikes.
It was really a combination. Yes definitely.
Regarding the electricity choice issue, there are a lot of stories of predatory marketing of the products and most communities are now offering their own choice products.
Will, there is a price effect here that dominates equipment substitution in the short run.
From March 1978 through March 1981 the PPI for fuel oil increased by 174% (from 39.0 to 106.9).
National demand for middle distillates (reported in Oil and Gas Journal) fell by about 34% over the same period.
The implied price elasticity is about 0.2, which is in line with other estimates of short-run energy elasticity.
In contrast, the same price index fell from March 1983 to March 1984. Demand increased.
Prices really matter.
As a sad illustration of that fact, I spend many afternoons counting the number of cars waiting to pick up kids at BHS and the middle school.
I would say 80% of the cars idle with the engine, and presumably A/C, running for 10 to 15 minutes. This on days when it’s a pleasant 75 degrees outside. If gasoline cost more, I suspect many of these people would switch off the engine and open the windows.
Yes, thank you. Definitely, price is a big factor driving behavior.
Prices, good examples from leaders like Carter and Dukakis, wood stoves, thermostats down, hats and sweaters indoors and PUBLIC INFORMATION CAMPAIGNS. My mom worked for Paul Levy in the MA State Energy Office (not sure where it sat in state gov’t at the time. Paul worked with Henry Lee, then a policy adviser to Governors Sargent and Dukakis). Paul Levy lives in Newton and could likely give the most well informed answer on how government encouraged/supported energy conservation. That was a frequently heard phrase, “energy conservation” in those days. Lots of programs in schools. “The Little House of Big Energy Savings” was a ‘tiny house’ on a trailer taken to festivals, fairs and the like showing the what and how of insulation and the savings available. No-one was calling it a Tiny House at the time but it was a great vehicle for educating the public. There were PSAs and local newspaper stories. There was even a jingle. “E-N-E-R-G-Y the less you use the more you save”.
I was born in 1966, & this era left a huge imprint on me. Tagging onto what Joanna says above, I remember a campaign by the national EPA (Environmental Protection Agency) to save energy & resources. The campaign was aimed at young people & featured (among other things), a ‘comic book’ about an average nuclear family whose members turned into the horrible-looking “The Gluts” every time they wasted water in the shower, left their trash in public parks, etc.
Ever since I’ve been keenly aware of turning off lights when leaving the room, not wasting water, etc. – generally using the fewest resources I can, and properly disposing of trash & recycling. While I’m sorry that mindset, and the urgency of the planet’s health, wasn’t more widespread then & since, I’m glad that so many are taking it seriously in the face of the situation we now find ourselves in.