
Energy Savings Before Mass Save — five post series
This post is the fifth and final post in a series of posts exploring why residential fossil energy use in Massachusetts declined so dramatically even before the Green Communities Act of 2008 launched intensive energy efficiency efforts. The ultimate goal of the series was to answer the question we now finally address: How much did building envelope performance improvements (retrofits to existing buildings) contribute to that decline?
Unfortunately, this turns out to be a question we cannot answer with useful precision. As discussed below, we have some data on the prevalence of various building envelope elements — roof insulation, wall insulation, etc. But we have very limited data on actual performance — extent, thickness, or quality of insulation. Only with very speculative assumptions could we estimate how much energy was actually being saved by envelope improvements before Mass Save. At best, we can put some very broad boundaries on the savings levels.
Survey data on building envelopes
The Residential Energy Consumption Survey does not detect material evolution of the insulation characteristics of buildings in the Northeast Region. RECS began asking questions about floor, ceiling, and wall insulation in 1980 and curtailed them in 1990. During this period, RECS shows no statistically significant change in the prevalence of roof/ceiling or wall insulation in the Northeast (with reported wall insulation actually declining). Questions in intervening surveys (1984, 1987) show material percentages of Northeast households adding insulation, but the wording of the question (Question 60) was such that the “additions” could be just improvements in existing roof/ceiling or wall insulation as opposed to newly insulated shell elements. That makes sense given the already high prevalence of at least some insulation in Northeast homes.
| Percentage of single family homes in the Northeast | 1980 | 1990 |
|---|---|---|
| . . . with roof or ceiling insulation | 78.5% | 79.1% |
| . . . with wall insulation | 72.2% | 69.0% |
Starting in 1990, RECS began asking a perception question as to how well housing units were insulated (and after 1993 stopped reporting more specific data on presence or absence of insulation). The perception data show a slight trend in the wrong direction, but most differences across rows are not significant and any real trend could reflect changes in expectations as well as changes in realities.
| Percentage of all housing units in the Northeast | 1990 | 2009 | 2020 |
|---|---|---|---|
| Well insulated | 37.3% | 36.5% | 26.6% |
| Adequately insulated | 41.9% | 42.8% | 51.0% |
| Poorly insulated | 17.9% | 20.2% | 19.0% |
| Don’t know | 2.9% | 0.5% | 3.4% |
The RECS data tell us very little as to reductions in energy use intensity due to envelope improvements. The data above could be read to indicate that very little improvement actually occurred. Or they could be read as masking high improvements in insulation quality behind a lack of change in insulation prevalence and rising expectations.
Specifics about percentage of area covered and depth of insulation were only asked for a few years and they were dropped because “respondents have found them difficult to answer”, because they had higher non-response rates (5 to 11%), and because substantial differences between survey responses and reality as to depth of insulation were found when responses were audited. See Residential Energy Consumption Survey Quality Profile, 1996. It is unsurprising that surveyed homeowners could not provide completely accurate data on the extent and quality of insulation.
We know of no longitudinal data source about the thermal characteristics of buildings that would allow us to derive estimates of the change in energy use intensity due to building envelope performance investments over time And it is hard to imagine one existing — it is not simple to measure the performance-related characteristics of even one single building: How much insulation is in the south wall, really? And how about the north wall? How well sealed is the building really? Even with careful, professional, field observations of a building’s envelope elements it is not simple to translate those observations into energy consumption estimates.
The RECS data, while not helpful as to longitudinal improvement, do offer some unsurprising cross-sectional findings. From the 1987 survey, which did include detailed data on thermal characteristics of housing units, we have higher rates of insulation and other weatherization measures:
- in units that were owned as opposed to rented (Table 36)
- in colder climates (Table 38)
- in newer structures (Table 40)
Inferences from other data
Insulation employment
As documented in this previous post, there was a huge surge in interest in home energy savings during the 70s and 80s, and a corresponding surge in employment of insulation workers. The chart below is reproduced from that post:
Expansion of Drywall and Insulation Contractor employment vs. all Construction employment: 1978 to 2022 — employee counts indexed to 1978
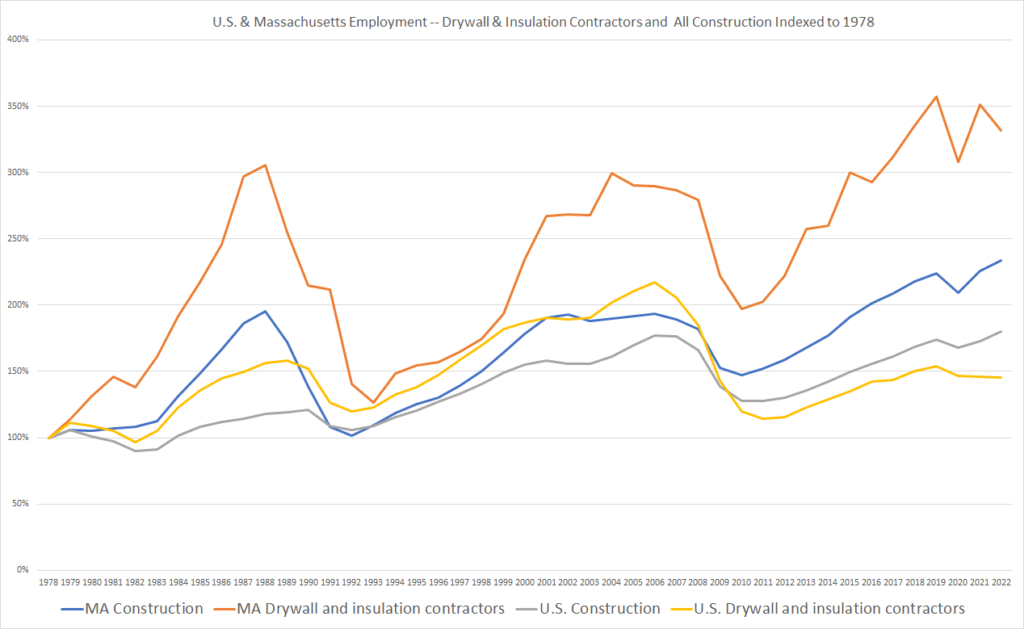
The orange line shows a tripling in the drywall/insulation category since 1978, while construction employment only doubled. Unfortunately, it is impossible to disentangle new construction from retrofit activity in these statistics. While insulation employment has continued to grow, it has fluctuated cyclically with construction employment overall and the relatively greater increase in insulation employment could be attributed to more stringent building codes for new construction.
Anecdotes from people who working in the energy field in the late 70s and early 80s confirm that available tax incentives and high energy prices created an “instant boom” in insulation work, including a large business in retrofits for homeowners. However, we have now way quantify how long that boom persisted, the number of homes touched, or the energy saving results in the average home. Additionally, we have no way of quantifying the extent to which measures installed during that period may have deteriorated in their effectiveness — in particular, many air sealing measures have a finite life.
Estimation of performance effects as a residual category
The findings from the preceding four posts in this series — summarized in the table below — allow us to infer a range for for total fossil fuel savings due to envelope retrofits during the 1972 to 2009 period: Somewhere between 0% and 32% overall — between roughly 0% and roughly 1% per year.
Massachusetts changes in residential fossil energy use intensity — 1972-2009
| Residential total fossil EUI, decline from 130.6 to 56.5 kBTU/SqFT1 | Down 57% |
|---|---|
| Electrification of fossil appliances — shift of 1.2 kBTU/SqFt as of 20092 | Shift 2% of load |
| Increased fossil burner/boiler efficiency3 | Load down 16-32% |
| Reduced thermostat settings4 | Load down 14-28% |
| New construction added with lower EUI5 | Average down 11% |
| Residual amount to be explained by retrofit envelope improvement6 | Load down 0-32% |
We know that zero improvement is too low — a lot of work was done. Similarly, one percent per year feels like a very high ceiling — so high as to not be especially useful. Typical energy savings from current Mass Save weatherization projects are in the 10 to 20% range. It is possible that insulation jobs in the 70s and 80s had yields on the higher side, since buildings were likely were starting from a lower performance baseline. At least one weatherization professional active in that era, Mark Dyen, recalls the 20% number as a very good average result at the program level. Doing 5% of homes each year (which at 20% savings in each home, would yield 1% per year) is not a completely implausible number — similar to the numbers reported in RECS surveys (Pre-1982 summary in 1982 report, Table S4, 1984 Table 49, 1987 Table 42). However, sustaining that rate over 32 years is not mathematically possible — one would have to work through all the homes in the Commonwealth in the first 20 years; moreover, for various reasons, many homes cannot or will not participate.
Conclusion
Our conclusions are unsatisfying: A lot of insulation retrofit work was done in the 70s and 80s, and perhaps also in 90s and 00s, but we don’t know what that work adds up to. Available data are entirely insufficient to support direct quantification of historical fossil energy use intensity reductions from building envelope improvements. High range estimates of other factors that reduce fossil energy use intensity — electrification, burner efficiency, behavior changes — turn out to be sufficient taken together to explain the observed historical reduction, so we cannot derive a non-zero floor on the residual contribution of building envelope improvements; nor can we derive a usefully low ceiling, since uncertainty is too wide on the other factors.
The limited affirmative takeaway from this series is that the non-envelope factors — electrification, burner efficiency, behavior changes — account for the majority, possibly the vast majority, of the observed dramatic decline in residential fossil energy use intensity before 2009.