
This post finds that, on reasonable assumptions, the increased direct housing production subsidies in our recent Affordable Homes Act will roughly suffice to maintain our existing level of subsidized housing production (approximately 2,200 affordable units per year) in the face of elevated construction costs. We compare historical data for the FY14-23 period with the projections developed in this previous post. The focus here is on subsidized private housing, as opposed to publicly owned housing.
Estimate of change in inflation-adjusted funding
Construction costs have been growing more rapidly than general inflation. The graphic below compares two standard indices of general price levels with one indicator of construction costs (the implicit price deflator for the residential fixed asset investment component of the gross domestic product). The two general price measures track each other closely, but construction costs show as rising more rapidly, especially during the COVID years, 2020 through 2022.
Construction costs (residential investment price deflator, green line) compared to two indices of general inflation
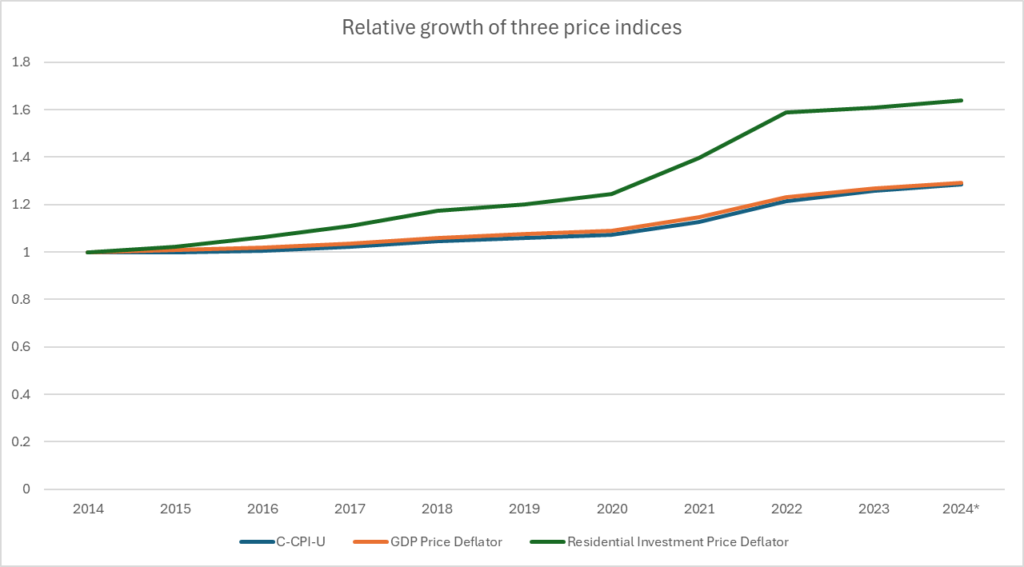
* As noted in Sources, the 2024 value for the price deflators is the 2d Quarter value and may be low as a result.
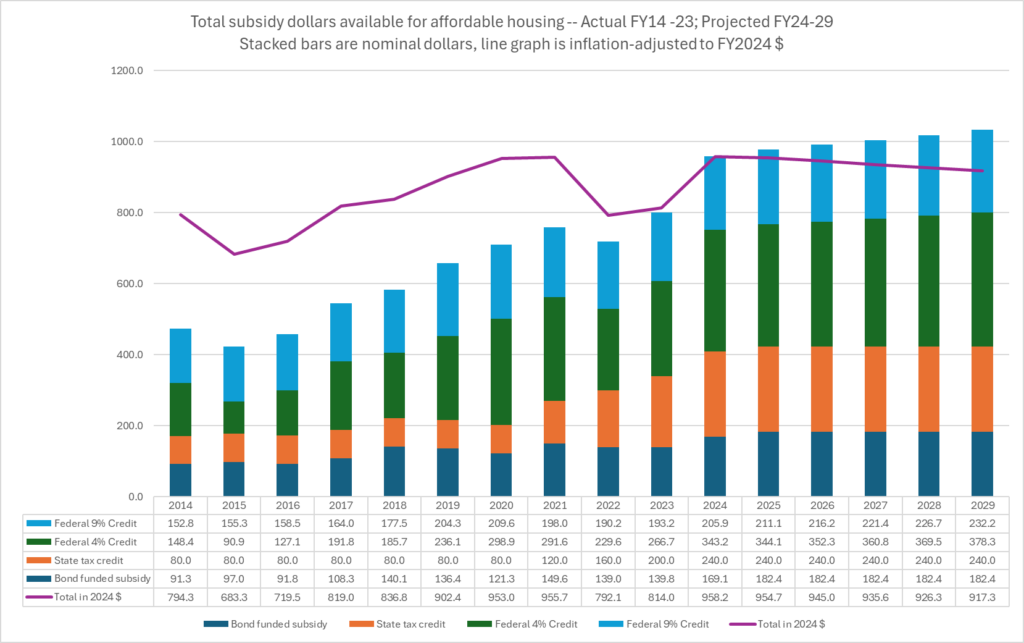
The Affordable Homes Act and previous tax legislation did dramatically increase state investment in affordable housing subsidy, raising state investment 39% comparing FY25-29 to FY20-24 — well above general inflation rates. However, the dominant source of subsidy — the federal low income housing tax credit — is indexed to grow only with general inflation. As a result, the total subsidy over the next five years, combining federal and state sources and adjusting for construction cost inflation, will be at roughly the same level it was at in Fiscal 2020 and 2021, prior to a dip in Fiscal 2022 and 2023. Because of the 22-23 dip, the inflation adjusted total over the FY25-29 period will be 5% higher than the inflation-adjusted total over the FY20-24 period (on the assumption that in FY25-29, construction costs will grow only at the same rate as the CPI, instead of rising above it — 2.4% annually, based on the September 2024 12 month rise).
Available funding for affordable housing, nominal dollars (bars) and real dollars (line)
Data limitations
There are a lot of moving parts in the housing picture and not all of them are clearly visible. Below we identify moving parts that we are aware of and that are possibly relevant to subsidized production levels but not directly factored into the estimate above. We believe that the none of these considerations and omissions affect the conclusion that subsidized production will be roughly the same in the next five years as in the last. Note that the annual production of units through HLC subsidy programs has varied around 2,200 per year in the data we have going back to 2016.
Subsidy per unit may fluctuate more than construction costs
The table below compares construction cost inflation and increase in subsidy per unit over two different periods. The comparison suggests that subsidy per unit may need to rise more than construction costs, which would depress production disproportionately to the rise in construction costs. This makes sense for projects that have some component of debt financing — the ability of the project to generate revenue to cover debt will not rise with construction costs, so the various soft subsidy sources need to cover all of the increased construction costs. On the other hand, conversely, falling interest rates may reduce needed subsidy.
| Construction costs, CQ2024:2 vs CQ2019:3 | +37% |
| Per unit subsidy, planned 2024 projects vs. 2019 projects | +72% |
| Construction costs, CQ2019:3 vs CQ2016:3 | +13% |
| Per unit subsidy, 2019 projects vs. 2016 projects | +19% |
Subsidized middle income and market rate housing
The discussion above focuses on funding growth for low income housing and omits consideration of two other categories of subsidized housing production:
- Subsidized middle income housing: There is no capital plan allocation for subsidized middle-income housing. However, Allocations of ARPA funding for the Commonwealth Builder program and Middle Income Housing straddle the periods we are concerned about — FY20-24 and FY25-29. Inclusion of these programs would raise the first period funding level more than the second. See discussion below under ARPA funding.
- Subsidized market rate housing: The tax expenditure budget for the personal and corporate income tax components of the certified housing development credit indicate total spending of $60 million for FY20-24. This is less than authorized; the legislature authorized a special bump of $57 million for CY2023, but that may be carried forward in to future years. The amount authorized for CY2025-30 is $150 million. As a rough upper bound on increase, assume that $200 million is available in FY25-29, including a substantial carry over yielding an increase of $140 million over the budgeted amount in FY20-24. This might correspond to a maximum increase of 560 units (at $250,000 per unit and assuming no discounting of tax credit value). Some of these units may be rehabilitated units as opposed to production. However, some of the $57 million special bump may have been allocated in FY2024, lessening the difference between FY25-29 and FY20-24. See additional discussion here.
Lack of data on new construction vs rehabilitation
We lack good data differentiating new construction and rehabilitated units, which are both eligible for funding in most of the major programs. The implicit assumption here is that whatever that mix is, it will not shift dramatically in favor of production as we move into the latter half of the decade.
ARPA Funding
In addition to the bond funded subsidy funding for housing included above, the state appropriated funding for housing production from federal COVID-19 related funds — ARPA, the American Rescue Plan Act. The chart below summarizes those funds that we have identified. The main observation to be made from this chart is that the Expended total as of August 2024 exceeds the Remaining total, so that more than half of the funds were likely expended in the FY2020-24 period — so its likely that accounting for these funds in the analysis would reduce the funding growth from FY20-24 to FY25-29.
ARPA Funds for Housing Production as of August 2024
| Account | Program/title | Appropriations* | Expended ~FY20-24 | Remaining ~FY25-29 |
|---|---|---|---|---|
| 15992021 | Commonwealth Builder Program | $115,000,000 | $75,783,334 | $39,216,666 |
| 15992022 | Rental Housing Production/Affordable Housing | $115,000,000 | $106,442,000 | $8,558,000 |
| 15996084 | Housing Production (multiple programs)** | $200,000,000 | $60,000,000 | $140,000,000 |
| Total | $430,000,000 | $242,225,334 | $187,774,666 |
** $304,500,000 appropriation to this account to be administered by MassHousing included $100,000,000 earmarked for the Commonwealth Builder Program and $100,000,000 for an additional Middle Income housing program. It also included a $100,000,000 transfer to 70040052, the Affordable Housing Trust Fund. That fund did have $100,000,000 in it as August 2024, but there were other larger appropriations in to the fund; considering that balance to be the ARPA funds would leave Remaining a little above Expended.
Other Omissions
As discussed in the previous post certain other program categories usually operate in tandem with state low income housing subsidies and do not affect our estimates of production that are based on state subsidy funding levels and state subsidy per unit.