
The Affordable Homes Act is intended to increase housing production. This post reviews and updates the Executive Office of Housing and Livable Community’s (HLC’s) estimate of the housing production consequences of the AHA as originally proposed. The estimate in this post reflects the final legislation and the Govenor’s capital plan. It follows the HLC’s framing of the estimate, asking how many units can be claimed to flow from the investments and rule changes of the AHA. An alternative framing would be: To what extent does the AHA elevate housing production beyond what would be expected from existing rules and inflation-adjusted continuation of previous annual investment levels? That alternate framing is considered in a subsequent post.
Like the HLC estimate, the estimate here includes other recent legislation in its accounting and it otherwise follows HLC’s methodology in most respects. Unlike the HLC estimate, to the limited extent possible, this estimate attempts to differentiate new units from rehabilitated or preserved units. The necessarily rough estimate is summarized in the table below.
| Housing category | Housing units added (2025 to 2029) |
|---|---|
| Public housing | Mostly rehabilitation, few new |
| Subsidized low income housing | Less than 11,000 units* |
| Subsidized middle income housing | Less than 960 units |
| Subsidized market rate housing | 600 units or less** |
| Total subsidized units | 12,000 units or less |
| Unsubsidized units possibly generated | 21,000 — very approximate |
** Program may be used for new construction or rehabilitation.
Public housing
The AHA makes significant investments in public housing, but these are primarily intended to support the rehabilitation of existing units. As accounted for below under public housing demonstration projects, some innovative models may conjoin rehabilitation of public housing with market rate housing production.
Subsidized low income housing
The table below summarizes resources available for low income housing production and preservation over the next five years. The basis for estimating each line is discussed further below. All of the units financed through these funding sources will be affordable for people making under 80% area median income and many of them will be more deeply affordable. Some projects also include market rate units, but these are financed from other sources. The units financed include both newly produced units and existing units that are preserved as affordable; the mix of production vs. preservation is unclear from available data.
Resources available for low income housing production and preservation,
FY25-29
| Subsidy Category | Available Amount ($ billions) |
|---|---|
| (1) Affordable Homes Act bond-funded subsidies | $0.912 |
| (2) State LIHTC | $1.200 |
| (3) Other state tax credits | Relatively small |
| (4) Federal LIHTC | $2.915 |
| (5) Federal direct subsidies, including ARPA | Relatively small |
| (6) Approximate total subsidy resources (certain sources omitted, see discussion) | $5.027 |
| (7a) Resulting units preserved or created (at 2027 cost — ? — of $450,000 subsidy per unit) | 11,171 |
| (7b) Resulting units preserved or created (at 2022 cost of $350,000 subsidy per unit) | 14,363 |
(1) Affordable Homes Act bond-funded subsidies
The amount of bond-funded subsidy will be less than the amount of bonding authorized by the Affordable Homes Act (AHA), because the bond issuance is constrained not only by authorizations, but by debt capacity. In a previous post, we reviewed the cross-walk from legislative bond authorizations to the Governor’s actual capital spending plans for housing: The amount allocated in the 5-year capital plan for general subsidy of affordable housing development is $829 million, to which may be added $83 million targeted especially for disability housing in two programs (“Community Based Housing” and “Facilities Consolidation”) for a total $0.912b of expected housing subsidy spending. Note that in the Executive Office of Housing and Livable Communities (HLC) original estimate and the estimate by the UMass Donahue Institute, bond authorizations as opposed to capital plans were used for estimating spending; this resulted in overestimate ($1.8b). FY25-29 capital plans were unavailable at the time of those estimates. [Update, July 1, 2025: The 2026 Capital Improvement Plan is now available and does increase the bonding allocated to housing, including affordable housing, but as the other funding components (tax credits) remain unchanged, the basic narrative remains the same.]
(2) State LIHTC
This previous post discusses the state Low Income Housing Tax Credit and affirms estimates that the state LIHTC will contribute $1.2b for low income housing subsidy over the next five years.
(3) Other state tax credits
Other state tax credits may make modest contributions to low income housing development. As discussed in a previous post, their total impact is likely very small compared to the other items in this chart.
(4) Federal LIHTC
A previous post discusses the federal Low Income Housing Tax Credit. That post offers a projection for the federal LIHTC of $583 million annually per year on average in the 2025 to 2029 period — reflecting statutory inflation adjustments and volume cap increases.
(5) Federal direct subsidies, including ARPA
The federal government has had a huge historic role in the construction of new affordable housing and still does through the federal LIHTC, which is roughly half the available subsidy in the chart above. Affordable housing constructed under now-closed federal programs still receives over $1 billion in legacy annual support in Massachusetts. However, apart from the LIHTC, direct federal subsidy for new affordable housing development is limited today. In Massachusetts, some federal COVID ARPA funds were deployed to support public housing, but according to the Winter 2024 Notice of Funding Availability, as of September 2023, all ARPA funds for low-income housing were fully committed.
(6) Approximate total subsidy resources (certain sources omitted)
This line totals all the lines (1)-(5) shown above. These lines do not include the following funding sources because they are implicitly built into the computation on lines (6) and (7) which estimate production based on state subsidy per unit.
- Local contributions to affordable housing production from the Community Preservation Act or linkage fees — these are commonly used in combination with state subsidy sources and the average state subsidy per unit used in line (7) is lessened as a result.
- Project-based vouchers are also a significant component of the total housing finance picture, but they serve primarily to deepen the affordability of units rather than to increase the production of units.
- Grant programs to municipalities for infrastructure or as zoning incentives — these may help produce low-income housing, but only in conjunction with direct state subsidy for the housing.
The HLC/UMDI analysis cited above also omits these items as subsidy resources.
(7) Resulting units preserved or created — inflation assumptions
To estimate units preserved and created from the total subsidy available, we need to estimate the subsidy per unit. The HLC/UMDI analysis cited uses a subsidy of $350,000 per unit (including the subsidy sources above). HLC staff conducted an analysis of 28 projects which yielded an estimate “$353,000 per unit in 2022 dollars.” However, we are estimating housing production for a period (FY2025-2029) centered 5 years later, around 2027. Nationally, residential construction costs (“private residential fixed investment“) rose 37% from the first quarter of Fiscal 2020 to the last quarter of Fiscal 2024.
The subsidy per unit depends on more than construction costs. It depends on unit size and target affordability levels, of course, but also on interest rates. Falling interest rates would help lower needed construction subsidies. We cannot infer subsidy per unit levels from construction cost inflation with confidence.
A more direct indicator suggesting that we should use a higher subsidy per unit for the FY2025-29 period is the rising trend in the graphic and chart below, extracted from HLC project data. Projects show a strong up trend in subsidy per unit through the years, and especially over the last few years. Hopefully, interest rates will fall and construction cost trends will abate, but some increase in per-unit subsidy does seem likely. Lines (7a) and (7b) in the chart above present production estimates at $350,000 and $450,000 subsidy per unit, but the summary at the top of the post uses the $450,000 level which is more consistent with recent project experience shown in the chart below.
Per affordable unit subsidy by placed-in-service year in HLC projects
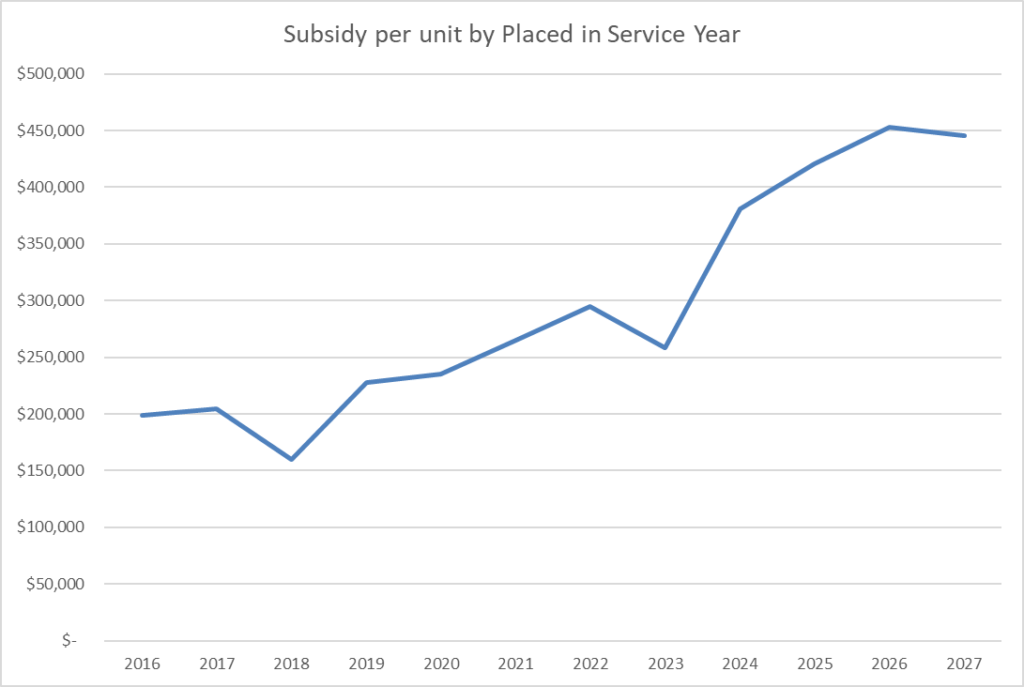
Per affordable unit subsidy by placed-in-service year in HLC projects
(Projects N=405*, Affordable Units N=22,262)
| Placed in Service Year* | Projects | Affordable Units | Total Subsidy*** | Subsidy per Affordable Unit |
|---|---|---|---|---|
| 2016 | 24 | 826 | $164,195,155 | $198,783 |
| 2017 | 30 | 1,576 | $322,810,556 | $204,829 |
| 2018 | 42 | 3,085 | $492,787,388 | $159,737 |
| 2019 | 36 | 1,795 | $409,316,456 | $228,031 |
| 2020 | 37 | 2,005 | $470,989,271 | $234,907 |
| 2021 | 46 | 2,339 | $620,458,571 | $265,267 |
| 2022 | 43 | 2,001 | $589,071,215 | $294,388 |
| 2023 | 40 | 2,574 | $665,360,263 | $258,493 |
| 2024 | 46 | 2,595 | $989,248,901 | $381,213 |
| 2025 | 46 | 2,492 | $1,048,648,739 | $420,806 |
| 2026 | 14 | 914 | $414,264,271 | $453,243 |
| 2027 | 1 | 60 | $26,702,054 | $445,034 |
* There were 421 projects dated 2016 and after, but 10 were missing subsidy amount or unit count and 6 had per unit subsidy over $750,000 — the 6 high subsidy items may have been accurate (none were over $2million) or may have been outliers due to some data error.
** The placed in service years shown chosen from three available values in the following order of preference: Final occupancy permit date, placed in service date, status date for the record. Use of the “Final occupancy permit” date filled in a few missing dates, but in all but 7 cases was within 1 or two years of a previous algorithm that only used the last two values and was different at all in only 29 cases.
*** Computed as 10 x each of the two federal credits plus 80% of 5 x state credits plus all other soft debt program awards.
Subsidized middle income housing
The AHA includes two programs intended to produce middle income housing. The numbers below in lines (1) through (4) are from HLC’s analysis of AHA impact. That analysis assumes full use of authorized funding for both of the programs mentioned. However, neither of these line items is actually programmed in the Governor’s capital program. Instead, the administration is relying on previously appropriated ARPA funds. The Commonwealth Builder program was allocated a total of $215 million in ARPA funds and the “Mixed income Housing Fund” was earmarked for another $100 million. Of that combined $315 million, $179 million remained as of the start of the FY25-29 period. See discussion here. That is only slightly 10% less than HLC assumed in its analysis and for simplicity we just use HLC’s number for the available subsidy funds.
| (1) HLC Commonwealth Builder Program (middle income homeownership) | $100m |
| (2) Mixed Income Housing Fund (middle income rental housing) | $100m |
| (3) Total* | $200m |
| (4) Housing units produced (at cost of $250,000* subsidy per unit) | 800 |
| (5) Additional units supported by new Homeownership tax credit (see discussion of estimate here) | 160 |
** HLC’s analysis and the analysis here both omit consideration of Mass Housing’s “Momentum Fund” designed to help jump start middle income housing projects. Only $10 million is allocated to this item in the capital plan, and there was concern that even $50 million as authorized would be depleted quickly.
Subsidized market rate housing
The only program subsidizing market rate housing development is the Housing Development Incentive Program — a tax credit program targeted to gateway cities where the rental market is too weak to support the production of market rate housing. Although the resulting housing will not be rent restricted, the rentals will be relatively low due to location. 600 units is probably a high side estimate for the housing production resulting from this program during the 2025 through 2029 period. The credit is available for both new construction and substantial rehabilitation of units.
Unsubsidized units possibly generated
HLC offer estimates additional market rate housing units generated in several different categories. In all of these categories, housing generation depends on additional choices made by local governments and developers. These projections are therefore especially uncertain. The lines in the summary table below are explained in the text that follows.
| Program or policy | Estimated units generated FY25-29 |
|---|---|
| Housing creation grants to municipalities | 7,488 |
| Public housing demonstration projects | 951 |
| Statewide zoning authorization of accessory dwelling units | 8,000 |
| Housing development on surplus state property | 5,000 |
| Total | 21,439 |
Housing creation grants to municipalities
The AHA funds grants to municipalities to encourage housing development:
These sources do not directly subsidize the construction of homes, but they fund planning and infrastructure that enables both affordable and market-driven housing development. Impacts of these programs were estimated based on consultation with program staff and an expectation that results will be comparable to outcomes during the previous five years of the programs.
HLC Analysis of Affordable Homes Act (around time of filing in 2023)
The estimates offered in the table below are the HLC staff estimates made in 2023 and still online as of October 2024. The “Market rate units generated” column is computed as total units generated less affordable units. (Any affordable units generated were mostly counted in the subsidized housing analysis.) The last two columns adjust the HLC implied estimates downward by ratio of the actual FY25-29 capital plan allocation to the authorization amount assumed by HLC in its analysis.
Housing units generated by housing creation grants to municipalities: FY25-29 (Adjusted HLC Estimates)
| Program | Total units generated (HLC) | % affordable, poss. counted as subsidized (HLC) | Market rate units generated (HLC) | Capital plan/ Authorization (detail here) | Market rate units generated (adjusted) |
|---|---|---|---|---|---|
| Housing works infrastructure | 9000 | 35% | 5850 | $105m/$175m | 3,510 |
| Housing choice grants | 4500 | 25% | 3600 | $25m/$35m | 2,571 |
| 40R Smart Growth zoning | 2500 | 25% | 1875 | $15m/$20m | 1,406 |
| Community planning grants* | — | — | — | $15m/$25m | — |
| MBTA Catalyst* | — | — | — | — /$15m | — |
| Total | 16,000 | 11,325** | 7,488 |
** Note: HLC estimates a total of market rate units of 13,010 based on spending programs and LIHTC. The 11,325 total in the chart above, when combined with 800 estimated below for “Public Housing Demonstration Projects”, totals 12,125. The gap between the detail and the total appears to be unexplained in the HLC estimate.
The capital plan also contemplates HLC spending $39.2m in the next five years on neighborhood stabilization grants to upgrade blighted properties. These grants may go to municipalities or community organizations and may be used for variety of purposes (even lead paint abatement). A few net new units may result from this program, but the program will mostly support improvement as opposed to production. Similarly, the Massachusetts Rehab Home Modification Loan Program ($19m over the next five years) is devoted to accessibility improvements, not new unit production (although the 3,000 units improved might be unusable for their occupants without the improvements).
Public housing demonstration projects
HLC explains this item as follows:
A $100M line item for Public Housing Demonstration Projects is intended to subsidize the redevelopment of existing public housing developments and the creation of denser mixed income developments that replace all affordable units on site while also adding a substantial number of market rate units. Based on the limited amount of available information about projects underway (such as the redevelopment of Innes Apartments in Chelsea and Bunker Hill Housing in Charlestown), EOHLC assumes a $250,000 subsidy per public housing unit replaced, and a 2:1 ratio of new market rate units to public housing units redeveloped. As a result, a $100M investment could enable the full redevelopment of 400 public housing units and the creation of 800 market rate units.
HLC Analysis of Affordable Homes Act
As HLC notes, this estimate is based on “limited” information. The only adjustment we can offer to this rough estimate is that the capital plan amount is higher than originally assumed — the Affordable Homes Act authorized $200m and the capital plan allocates $118,875,000. This raises the estimate of 800 market units generated to 951. Note that the program budget language (line item 7004-0075) could allow use of some of the funding for affordable units, but HLC reasonably assumes that the funding will be used to maximize public housing redevelopment.
Policy measures
The HLC estimates shows a summary total of 24,640 units generated by “policy and technical fixes.” These units are distributed across all income categories (6,110 low; 10,730 moderate, 7,800 market). The HLC discussion provides a basis for an estimated a range of “8,025 to 10,700 ADUs over a five-year period,” but it is unclear how these are classified by income. There are no other specific policy fixes detailed by HLC in their estimate page that would generate units. The related UMass Donahue report (Methodology, page 11-12) estimates 8,000 units from the ADU authorization, 3,200 units from the transfer tax, and 5,000 units from state surplus property disposition. These add up to 16,200 out of the 24,640 shown by HLC and is not clear whether the other claimed production would come from.
The transfer tax was not included in the bill. For our estimates here, we accept the ADU estimate without scrutiny. We lack a basis for reviewing the surplus property estimate, but note that even though the AHA does substantially streamline state disposition and create a valuable limited override of local zoning rules, various delays may make 5,000 units over the next five years an overly optimistic number. Local permitting, state and local politics, and national financial conditions could all contribute to schedule uncertainty.