In this post, we start from known administrative counts of subsidized housing units and explore whether we can use them to identify the share of the Unsustainably Rent Burdened (URB) population that is living in subsidized housing. The exercise requires some complex reasoning that may or may not be fully convincing — I look forward to feedback. But the exercise may shed light on the rent-burdened population more generally, suggesting that the housing supply gap for Very Low Income and Low Income populations is considerably greater than the gap for the Extremely Low Income. This post is part of a series of technical posts reviewing census data relevant to affordable housing need. For context, at least one of those posts, The unsustainably rent burdened — part I, should be read first.
Starting observations
Count of RBI/TTP Units
There are two kinds of subsidized units — those in which the Rent is Based on the Income of the tenant (RBI units) and those in which the rent is fixed but below market (FBM). We have no way to identify the FBM units in the ACS data and this post focuses on RBI units. From the Housing Navigator, we know that there are approximately 148,236 RBI units in Massachusetts.
In addition to the RBI units, there are approximately 85,030 units occupied by tenants with mobile housing vouchers (99,530 federal Housing Choice Vouchers less 20,000 that are project based and 11,000 state vouchers less perhaps 5,500 that are project based). Mobile voucher holders pay rent based on income as do tenants in RBI units. The amount the tenant pays is referred to as the total tenant payment or TTP. That amount is always less than the actual contract rent on the apartment. One of the challenges in interpreting the American Community Survey is that we don’t know for sure what tenants report when asked what their rent is — the TTP or the contract rent. We have relied on the one available study of this question to assume that 40% report their TTP and the balance report their contract rent. The 40% who report TTP will resemble RBI units in the rents they report, so we will refer to them together as RBI/TTP units. The total count of these units is 182,248 as recapitulated in the table below:
| RBI/TTB Units | ||
|---|---|---|
| RBI Units from Housing Navigator | 148,236 | |
| HUD Housing Choice Vouchers | 99,530 | |
| Less: Project Based | 20,000 | |
| HUD Mobile Vouchers | 79,530 | |
| State Vouchers | 11,000 | |
| Less: Project Based (assumption) | 5,500 | |
| State Mobile Vouchers | 5,500 | |
| Total Mobile Vouchers | 85,030 | |
| Estimate 40% of mobile report TTP | 34,012 | |
| Estimated Total RBI/TTP Vouchers | ~182,248 |
Allocation of RBI/TTP units to ELI, VLI, and LI households
Most RBI/TTP units in state and federal housing subsidy programs are occupied by Extremely Low Income (ELI) households, described in a previous post and the balance are occupied by Very Low Income (VLI) and a few Low Income (LI) households; essentially none should be occupied by non-low-income households.
| Housing Subsidy Program | Units | % ELI | % VLI | % LI |
|---|---|---|---|---|
| Federal Public Housing | 29,957 | 78 | 15 | 7 |
| Federal Mod Rehab | 1,662 | 87 | 10 | 3 |
| Federal Project Based Section 8 Rental Assistance | 59,394 | 79 | 16 | 5 |
| 202/PRAC (Federal Supportive Housing for the Elderly) | 3,752 | 80 | 19 | 1 |
| 811/PRAC (Federal Supportive Housing for Persons with Disabilities) | 967 | 94 | 5 | 1 |
| Tax credit units with federal Housing Choice Vouchers that are project based | 12,752 | 79 | 16 | 5 |
| State and Federal Vouchers (40% reporting TTP) | 34,012 | 78 | 16 | 6 |
| State Public Housing if serves same client mix as Federal Public Housing | 41,500 | 78 | 15 | 7 |
| Alt: State Public Housing has a higher income range* | 41,500 | 60 | 30 | 10 |
| State and Federal Total | 183,996** | 79 | 16 | 6 |
| Alt: State and Federal Total if state public housing has a higher income range* | 183,996** | 75 | 19 | 7 |
**The total in this chart differs slightly from the total in the previous chart because it is based on administrative data from state and federal agencies, instead of from the Housing Navigator.
Sources: Previous tabulation in this post and in spreadsheet attached to that post.
The low end of the income distribution
The ELI group represents the left tail of the income distribution, so the average income in the group is not concentrated near the ELI income threshold, but instead averages well below it. As a result, 84% of single person ELI households would be ELI households in any market in the state, even though the HUD ELI threshold varies with local housing prices. The Boston market has the highest ELI threshold and as a result, the lowest share of households that would be ELI in other markets (77%).
Income Levels of Single person ELI Households across HUD Fair Market Rent Areas with % of ELI Households below lowest FMRA ELI Level (Springfield, New Bedford, Franklin)
| ELI Threshold | Average ELI Income | ELI Count | % Below | |
|---|---|---|---|---|
| Barnstable Town, MA MSA | $22,850 | $12,850 | 3,389 | 88% |
| Boston-Cambridge-Quincy, MA-NH HUD Metro FMR Area | $29,450 | $13,301 | 97,151 | 77% |
| Brockton, MA HUD Metro FMR Area | $23,450 | $12,304 | 5,556 | 86% |
| Fitchburg-Leominster, MA HUD Metro FMR Area | $21,050 | $11,773 | 4,571 | 95% |
| Franklin County, MA HUD Metro FMR Area | $19,800 | $12,282 | 3,016 | 100% |
| Lawrence, MA-NH HUD Metro FMR Area | $24,200 | $12,376 | 7,513 | 89% |
| Lowell, MA HUD Metro FMR Area | $26,550 | $12,668 | 6,578 | 84% |
| New Bedford, MA HUD Metro FMR Area | $19,800 | $10,894 | 5,621 | 100% |
| Pittsfield, MA HUD Metro FMR Area | $20,300 | $11,636 | 3,303 | 93% |
| Providence-Fall River, RI-MA HUD Metro FMR Area | $20,300 | $11,111 | 6,666 | 98% |
| Springfield, MA HUD Metro FMR Area | $19,800 | $10,779 | 15,980 | 100% |
| Taunton-Mansfield-Norton, MA HUD Metro FMR Area | $23,450 | $10,637 | 2,572 | 87% |
| Worcester, MA HUD Metro FMR Area | $23,250 | $12,714 | 13,668 | 85% |
| Statewide | $12,634 | 175,584 | 84% |
Identifying RBI/TTP Households
The American Community Survey does not identify which housing units are subsidized. Our goal is to see how well we can indirectly identify the estimated 182,248 RBI/TTP units by identifying the lowest rent units in the ACS. The basic rationale is that since rents in RBI/TTP units are set based on incomes to be affordable to low income households, mostly extremely low income households, the RBI/TTP units should have the lowest rents in the state.
We define the Low Rent Set (“LRS”) as the set of units in the state reporting with the lowest non-zero rents reported to the ACS. We select them by ranking all units by size-adjusted rent and identifying the lowest rent threshold below which we capture enough households to match our known RBI/TTP count (182,248). In the ACS 2022 5-year data, $863 is the rent level such that the total count of all units with size-adjusted rents below that limit approximately equals the RBI/TTP count. The size count adjustment we use is not the standard HUD adjustment, which includes policy-based adjustments. Instead, since we are interested in identifying the truly lowest rents, we adjust rent simply based on the actual statewide ratios of average rents for units with different bedroom counts.
We can test the identification of the RBI/TTP set with the LRS in two different ways:
- First, does the income level mix for households in the LRS match the administratively known level mix in RBI/TTP units?
- Second, if we randomly select households from the ACS, weighting our sampling to select the administratively known income level counts among RBI/TTP units, are all the selected units within the LRS (assuming rents set at 30% of household income)?
The next table shows the results of the first test.
Low Rent Set households (and higher rent households) by household income level
| Rent under/over $863 | ELI | VLI | LI | NLI | All |
|---|---|---|---|---|---|
| Low Rent Set | 128,717 | 27,297 | 12,728 | 13,484 | 182,226 |
| Higher Rent Households | 166,319 | 131,262 | 171,630 | 345,676 | 814,887 |
| All Households | 295,036 | 158,559 | 184,358 | 359,160 | 997,113 |
| Low Rent Set | 71% | 15% | 7% | 7% | 100% |
| Higher Rent Households | 20% | 16% | 21% | 42% | 100% |
| All Households | 30% | 16% | 18% | 36% | 100% |
| Comparison to known RBI/TTP* | 79% | 16% | 6% | 0% | 100% |
Source: ACS 2022 5-yr microdata, see attached spreadsheet.
Overall, the low-rent set and the RBI/TTP set compare closely in this test. However, the differences between red highlighted cells above show that the lowest rent households include a somewhat lower percentage of ELI households than the administratively known RBI/TTP households and a somewhat higher percentage of Not LI units. So, under this test, the identification between RBI/TTP set and the LRS is good but not perfect.
The next table shows the result of the second test. The first green high-lighted number (82.0%) indicates that even selecting tenants at random within income level at random, one gets substantial overlap between the RBI/TTP set and the LRS. The second green high-lighted number (89.5%) shows that selecting the lowest income tenants within each income level (using the relevant HUD market area standard), one gets a closer, but still not perfect, match between the RBI/TTP set and the Low Rent Set — for VLI and LI units, 30% of income may exceed some market rents (possibly in the same market area, but more likely in other market areas).
Income-based selection of households (random but weighted to match known administrative counts of RBI/TTP units by income level) — shares within Low Rent Set or not
| ELI | VLI | LI | NLI | All | |
|---|---|---|---|---|---|
| Target Counts based on administrative data | 144,618 | 28,631 | 10,747 | – | 183,996 |
| Average results from of 50 random trial selections | |||||
| Percent of units in Low Rent Set | 97.4% | 35.3% | 0.8% | 100.0% | 82.0% |
| Percent of units not in Low Rent Set | 2.6% | 64.7% | 99.2% | 0.0% | 18.0% |
| Alt: Units with lowest income in relation to HUD income threshold | |||||
| Percent of units in Low Rent Set | 100.0% | 67.5% | 6.7% | 100.0% | 89.5% |
| Percent of units not in Low Rent Set | 0% | 33% | 93% | 0% | 11% |
Using either test, there is a strong but not perfect match between the RBI/TTP set and the LRS. There is, however, one additional constraint that we can test: The rent or TTP in an RBI/TTP unit should, in theory not exceed 30% of the applicable HUD income threshold for its market area — this is not a rule per se, but, by definition, the applicable income threshold is above the household income (for example the ELI threshold is above the income in an ELI household) and RBI/TTP rent generally does not exceed 30% of income. The table below shows that that some of the units selected in the LRS (highlighted red) violate this constraint while some of higher rent households (highlighted green) do not — swapping some red units out of the LRS and inserting some green could improve the fit to the RBI/TTP set. However, while we are making use of broad household income level in our analysis, we are trying to stay away from specific use of the unreliable income reporting in the ACS. Raising the constraint to 40% of income eliminates most of the “Rent too high” cases, so income noise may be creating violations of the constraint (which occur in only 5% of cases).
Testing rent under 30% of applicable HUD income level threshold
| Household income level and rent comparison to HUD income level threshold | Low Rent Set | Higher Rent Households |
|---|---|---|
| ELI — Rent OK | 119,492 | 5,708 |
| VLI — Rent OK | 27,145 | 41,978 |
| LI — Rent OK | 12,728 | 135,449 |
| ELI — Rent too High | 9,225 | 160,611 |
| VLI — Rent too High | 152 | 89,284 |
| LI — Rent too High | 36,181 | |
| NOT Low income | 13,484 | 345,676 |
| 182,226 | 814,887 |
Further Understanding the Unsustainably Rent Burdened
Let’s consider the implications of accepting the analysis above as establishing the RBI/TTP set to be roughly the same as the LRS in the ACS data.
Households are traditionally referred to as “rent burdened” if gross rent is over 30% of household income and “severely rent burdened” if over 50%. We have introduced the term Unsustainably Rent Burdened to refer as households that:
- Pay non-zero rent AND
- Have unsustainably low income as compared to their rent — that is, they have EITHER
- Negative income
- Zero income
- Rent over 80% of income
The next table cross-tabulates households by rent burden level and RBI/TTP housing (assuming the identify with Low Rent). The graphics further below highlight findings of interest from within this crosstabulation.
All Renter Households by Rent Level, Income Level and Rent Burden Level, 2022 ACS 5-Year Data
| Rent Level | Income Level | Zero Rent | Not Rent Burdened | Rent Burdened | Severely Rent Burdened | Unsustainably Rent Burdened | All Nonzero Rents | All Tenants |
|---|---|---|---|---|---|---|---|---|
| All rents | ELI | 13,046 | 56,575 | 51,685 | 46,435 | 140,341 | 295,036 | 308,082 |
| All rents | VLI | 4,959 | 35,875 | 68,549 | 44,113 | 10,022 | 158,559 | 163,518 |
| All rents | LI | 7,203 | 90,568 | 79,099 | 13,057 | 1,634 | 184,358 | 191,561 |
| All rents | NOT LI | 11,090 | 324,304 | 32,298 | 2,266 | 292 | 359,160 | 370,250 |
| Low | ELI | 13,046 | 55,978 | 41,845 | 12,678 | 18,216 | 128,717 | 141,763 |
| Low | VLI | 4,959 | 23,357 | 3,940 | 27,297 | 32,256 | ||
| Low | LI | 7,203 | 12,723 | 5 | 12,728 | 19,931 | ||
| Low | NOT LI | 11,090 | 13,484 | 13,484 | 24,574 | |||
| Higher | ELI | 597 | 9,840 | 33,757 | 122,125 | 166,319 | 166,319 | |
| Higher | VLI | 12,518 | 64,609 | 44,113 | 10,022 | 131,262 | 131,262 | |
| Higher | LI | 77,845 | 79,094 | 13,057 | 1,634 | 171,630 | 171,630 | |
| Higher | NOT LI | 310,820 | 32,298 | 2,266 | 292 | 345,676 | 345,676 | |
| All rents | All Levels | 36,298 | 507,322 | 231,631 | 105,871 | 152,289 | 997,113 | 1,033,411 |
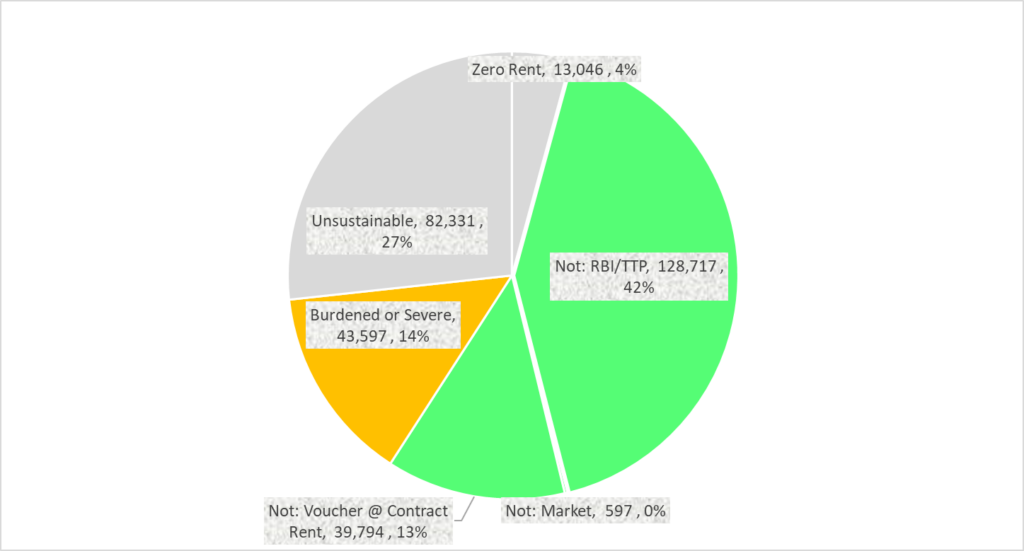
The next graphic excerpts the ELI population from the table above and analyzes it according to burden level. Based on the analysis above, ELI households that are in the lowest rent group are almost certainly in RBI/TTP housing, so that their rent is modulated to their income and they should not be considered rent burdened from a policy perspective. Reporting of high burdens in this group may reasonably be attributed to reporting of income less rental deductions, and similar conceptual glitches, as previously noted. The graphic additionally incorporates the ELI households benefiting from vouchers but reporting contract rent (put aside so far in the analysis), identifying them as their own not-burdened slice and backing them out of the URB group. (It is possible that some should be backed out of the rent burdened group, but we have defined them as reporting market rents and their nominal burdens are likely unsustainable; further, backing them out of the rent-burdened group would not be conservative with respect to the argument that the rent-burdened group is smaller than previously believed.)
This graphic offers a different perspective on the rent burden levels of ELI households: 59% benefit from zero rent or public subsidy and are likely not rent burdened. Approximately 14% may be burdened or severely burdened and 27% are Unsustainably Rent Burdened — economically viable through means that are not visible to the ACS, whether as students, living off investment, in some informal arrangement, or somehow misreporting rent and/or income. Note that in the URB group (122,125 including both the Voucher @ contract group and the URB remainder), 45,498 report no means-tested program participation (MassHealth, Food Stamps, Public Assistance or SSI). We may speculate this group is a subset of the URB remainder (82,331);within this group it would be over half.
Rent Burden of Extremely Low Income Households: ACS 2022 5-year data (N=308,082)
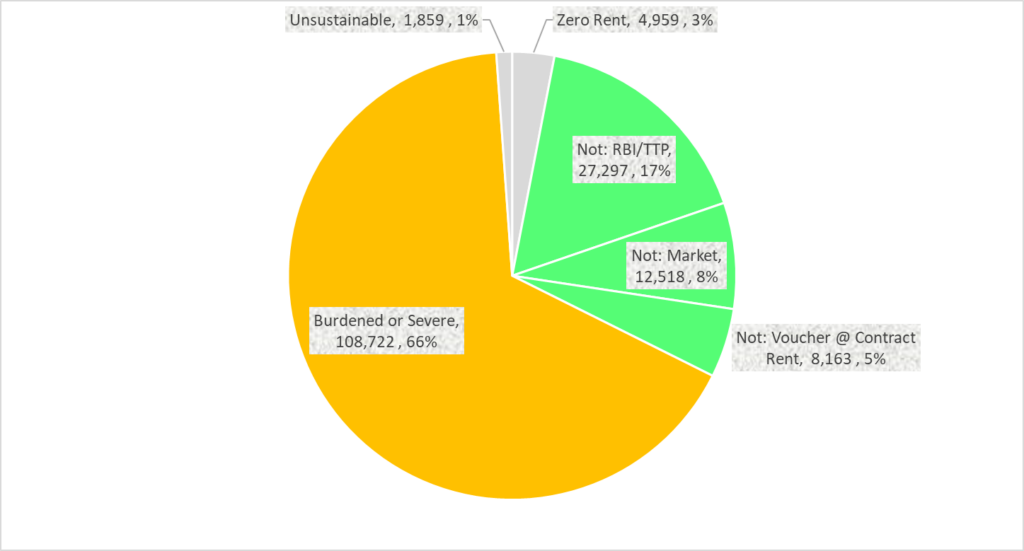
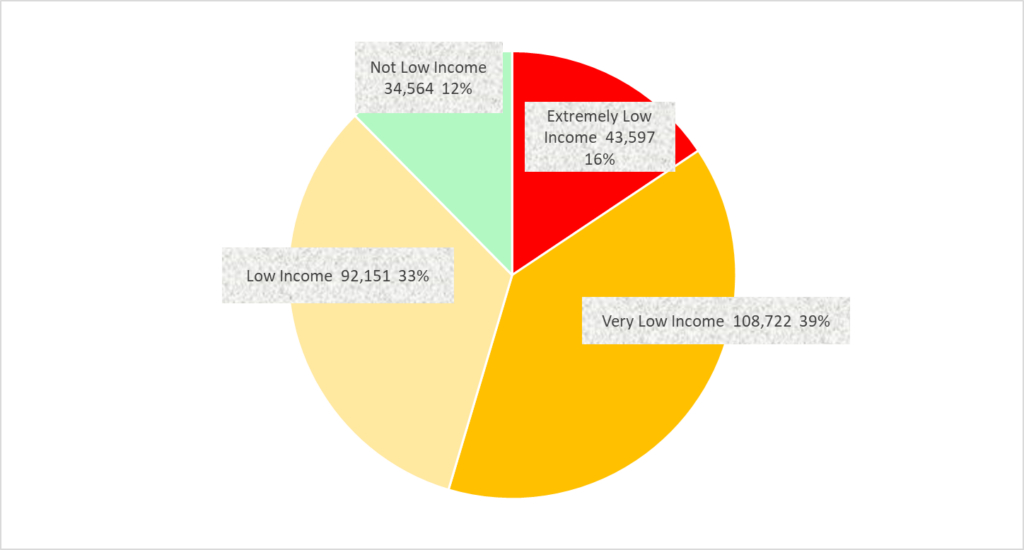
The next chart reproduces the same analysis for the VLI group, showing a starkly higher number and share of burdened or severely burdened households — 66% or 108,722.
Rent Burden of Very Low Income Households: ACS 2022 5-year data (N=163,518)
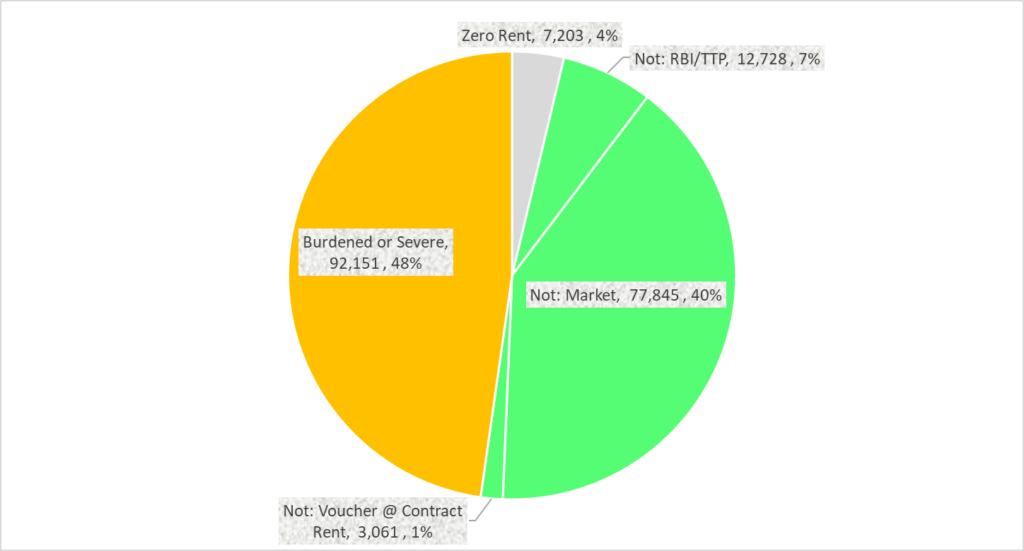
The next graphic reproduces the same analysis for the LI group, again showing a high number and share of burdened or severely burdened households — 48% or 92,151.
Rent Burden of Low Income Households: ACS 2022 5-year data (N=191,561)
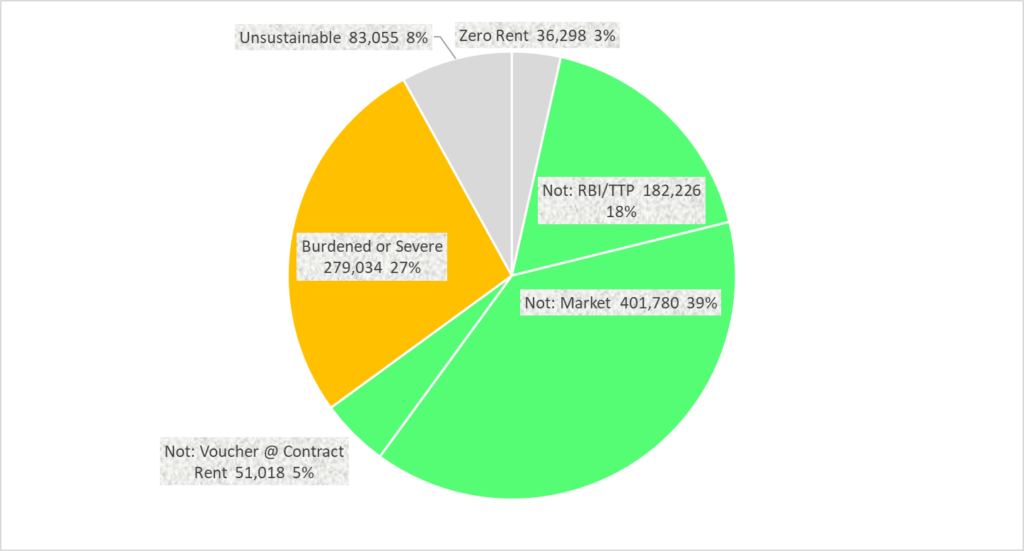
The next graphic reproduces the often repeated analysis of rent burden for all Massachusetts renters, suggesting a lower share that are rent burdened or severely rent burdened than is usually presented.
Rent Burden of All Massachusetts Households: ACS 2022 5-year data (N=1,033,411)
The final graphic flips the analysis and divides the population that is rent burdened or severely rent burdened by income level. The graphic is not intended to equate being rent-burdened at one income level with rent-burdened at another — the higher one’s income, the more one has left over at the same rent percentage burden. But the graphic does suggest the income levels where housing demand pressure may be greatest.
Rent Burdened and Severely Rent Burdened Households by Income Level: ACS 2022 5-year data (N=279,034)
Noise and Uncertainty
All ACS data is sample data and the microdata we are working with is a subsample of the ACS data. However, ACS microdata provides a method for checking sampling error and the attached spreadsheets include spot checking of error ranges. In general, the sampling error is small as compared to the following ambiguities in the data:
- There is substantial variation in income and rent levels across the state. The $863 cutoff for the LRS is driven upwards by the high-rent Boston market which includes over half the rental units in the state. The higher cutoff apparently brings in some market units in the lowest rent markets in the state, contributing to the non-zero count of Not-LI-but-low-rent units. An analysis of the Not-LI-but-low-rent units (in the attached spreadsheet) shows that they are disproportionately — although not exclusively — located in the lowest rent markets in the state. This noise factor might be reduced by redoing the analysis in smaller geographic areas; experimentation suggests this would somewhat reduce the Not-LI-but-low-rent unit percentage, but the crossover dynamic can continue in subarea that contains a range of neighborhood income levels. For now, given the overall good match between the RBI/TTP set and the LRS it does not seem urgent to do the work of data acquisition needed to match RBI and voucher locations to PUMAs.
- Some rental units are occupied with zero payment. These are specifically coded in the ACS. In the 2022 5 year data, there were 36,298 zero-rent units statewide, and the distribution of tenant incomes in those units was not very different from the units with non-zero rents. We have discussed these units previously and concluded that we cannot characterize them with confidence based on the information available to us. In some cases, the unit may be compensation for services rendered, for example building maintenance. In others, a landlord may allow a family member to occupy a unit rent free. We also know that housing authorities sometimes allow tenants in subsidized units to pay zero rent. This would happen only for the lowest income renters, i.e., ELI households. For our purposes, the relevant uncertainty is: What share of zero-rent units are subsidized units? These units are excluded from the counts above and but some of them should be included as subsidized. This would lower the $863 cutoff which would tend to reduce the cross-over effect discussed in paragraph 1.
- Some units could be rented at low rents to family members, employees, friends or very long-term tenants, so ending up in the low rent category, but the tenants in these units could have a mix of incomes. The ACS data do not give us a way to distinguish these units. However, the large number of zero-rent units makes it seem entirely possible that there could be a similarly large number of low-rent units that are, in effect, privately subsidized. If were able to identify these units and back them out of the LRS, we would have to raise the cutoff, pulling in more market level units that blur the identification between the LRS to RBI/TTP. However, this dynamic may be similar in magnitude to and offset by the dynamic in paragraph 2.
- Some units may be priced far below market because they are in rough neighborhoods and/or in poor condition. The ACS does not characterize neighborhood at all. It does ask age of the structure and it does inventory bathroom, kitchen, and other amenities, but it does not assess the condition or quality of the unit. We cannot rule out the possibility that some of the units identified in our low-rent set are in fact market rate units. These may be the small share of the LRS that are apparently market rate non-low income-occupied.
- The largest uncertainty is that the rate at which mobile voucher holders report their Tenant Total Payment as opposed to the contract rent. We have identified only one study on the issue and have inferred from it that 40% of mobile voucher holders report their TTP and 60% report their contract rent. Considering the alternatives:
- First suppose that more voucher holders (over the 60% we are assuming) reported their contract rent. This would reduce the RBI/TTP count and strengthen the identification between the RBI/TTP and LRS sets: The lower the count, the lower the LRS rent cutoff and so the smaller the cross-over of the low rent set into households that cannot be RBI/TTP (NLI households and ELI/VLI units that have rents over 30% of the applicable threshold).
- Now suppose fewer report contract rent, more report TTP. Raising the share reporting TTP instead of contract rent weakens the match; we need to raise the LRS cutoff to accommodate them, creating a larger cross-over. However, even doubling the TTP reporting share to 80% only forces a 20% cross over. See attached spreadsheet.
- Note that uncertainty on this dimension does not affect the share of ELI households that are rent burdened — it just allocates not-rent-burdened households been RBI/TTP and Voucher reporting contract rent. However, we made a judgment call to assume that vouchers reporting contract rent are appearing as URB in the ACS. That makes sense because by definition they reporting market rents and they have very low incomes, so their ACS rent-burdens should be very high. But, some could have rent-burdens a little below 80% and be appearing in the severely burdened category as opposed to URB; making this adjustment (backing some of the voucher slice out of the burdened slice) would shrink the rent-burdened slice and expand the remaining URB slice. This likely small adjustment could become a little more important if more were reporting contract rent.
- Finally, our data on income levels in state affordable housing is imperfect. This uncertainty is much smaller than the other uncertainties. We do know that state housing prioritizes the homeless and according to HLC estimates, at least least half of state units serve ELI households.
Conclusion
Based on the tests conducted in this post, it is seems plausible to read the set of the lowest rent units in the ACS as roughly the same as the set of subsidized RBI/TTP units. This is an intuitively compelling idea, perhaps an obvious idea, but pursuing it yields the unexpected insight that income-based rent subsidies already support many apparently rent-burdened ELI households. If they are paying rent based on income, they are likely not actually rent-burdened. The Unsustainably Rent Burdened account for another large portion of the rent-burdened ELI households. We cannot confidently characterize the Unsustainably Rent Burdened other than to say that they appear to be economically viable, but in ways that are not visible to the ACS. We do know that most of them are reporting credible market rents, likely many as a result of reporting contract rents while holding rent-based-on-income vouchers. Overall, the share of renter households that are rent-burdened may be as low as 1 in 4 instead of 1 in 2 as would appear from uncritical use of ACS rent burden statistics.
It also appears that VLI and LI households are more frequently rent burdened than ELI households. However, rent burdened ELI households are likely to be on the edge of homelessness which may not be true for the rent-burdened VLI or LI household. The very tentative findings in this post may inform but, even with fuller verification, would not dictate priorities for housing investment.
NOTE: An administrative match is a feasible strategy to settle the issues raised in this post. Available datasets do link HUD client data and IRS income data to the ACS. However, access to these datasets requires hard-to-get official approval to access sensitive data. Approval will only be granted upon presentation of a well-designed project credibly calculated to produce a peer-reviewed publication. Note that the ACS/HUD Public Use Microdata Sample (PUMS) Indicator which identifies HUD program participation for 2015 ACS microdata records is of little probative value except to get a sense of size of populations for the purpose of study planning. The Indicator is based on a regression model as opposed to an actual link. The model was developed from an actual match, but only the model results are exposed and they are exposed without any quantification of goodness of fit; it is specifically intended to be unhelpful to evaluate any substantive hypothesis. Experimentation with the Indicator does suggest that in a real match there would be sample size sufficient to reduce the TTP vs. Contract uncertainty and also the no-rent uncertainty in the analysis above (even limiting the geographic scope of the analysis to Massachusetts). See experimentation spreadsheet under resources.
