This post explores American Community Survey data about households that report to the survey that they are paying more than 80% of their income in rent. Without question, there is a crying need for housing in Massachusetts, but inferences from the American Community Survey may be somewhat distorting our understanding of the problem. A frequently referenced statistic is the share of renter households paying more than 50% of their income in rent, often referred to as “severely rent burdened.” In its standard tables, the American Community Survey presents this as the most heavily cost burdened category. However, comprising over half of that category, there is another category for which we will coin the term “unsustainably rent burdened” — those reported as paying over 80% of their income in rent. This category needs a close look.
Rent Burden in the American Community Survey
The American Community Survey releases data in three different forms: (a) pre-tabulated data, (b) an online table generator, (c) microdata. The online table generator — data.census.gov — allows a user to select alternative different geographies and time frames but nonetheless limits the user to a set of tabulations that the Census Bureau finds are frequently requested. The microdata is a set of individual interview records that one can download and recombine at will. Table 1 below compares rent burden among Massachusetts renter households as it appears in the online table generator and in the microdata. The microdata differ very slightly from the online generator and yield slightly higher margins of error for each estimate because (a) the microdata are a subsample of the full survey sample; (b) the census slightly alters the microdata to protect anonymity. Margin of error is presented at the 90% confidence level — 90% confidence that the true value is plus or minus the MOE from the sample-based estimate. This previous post explains the error margin computations.
Table 1: Rent Burden (Gross Rent as % of Household Income) —
Massachusetts Renter Households, American Community Survey 2023 1 year data:
Data.Census.Gov (Table 25070) vs. Microdata
| Burden Range | Data.Census.Gov Estimate of Households | Data.Census.Gov Margin of Error* | MicroData Sample Estimate of Households | MicroData Sample Margin of error* |
|---|---|---|---|---|
| Total: All Renters | 1,056,510 | ±13,533 | 1,055,488 | ±14,733 |
| Less than 10.0 percent | 42,259 | ±4,365 | 40,617 | ±4,627 |
| 10.0 to 14.9 percent | 72,637 | ±5,223 | 75,384 | ±5,966 |
| 15.0 to 19.9 percent | 109,167 | ±6,327 | 110,703 | ±6,829 |
| 20.0 to 24.9 percent | 126,143 | ±6,547 | 128,515 | ±7,583 |
| 25.0 to 29.9 percent | 119,646 | ±6,825 | 117,762 | ±7,684 |
| 30.0 to 34.9 percent | 93,592 | ±5,407 | 91,408 | ±6,152 |
| 35.0 to 39.9 percent | 71,044 | ±5,719 | 71,386 | ±6,271 |
| 40.0 to 49.9 percent | 90,064 | ±5,754 | 88,656 | ±6,709 |
| 50.0 percent or more | 275,354 | ±11,005 | 274,215 | ±11,681 |
| Not computed** | 56,604 | ±4,659 | 56,842 | ±5,492 |
* Margin of error is at the 90% confidence level — 90% confidence that the true number is ± the MOE from the stated estimate.
** Rent is zero or income is zero or income is negative.
The ACS 25070 Table reproduced in the table above does not break out the largest category of renters — those with a burden of 50% or more. With the Microdata, we can get a closer look at that high burden group which is often referred to as “severely rent burdened.” Summing cells in the last column in Table 2 below, 26.0% of Massachusetts renter households appear to be “severely rent burdened.” In fact, however, 14.9% all households, over half of the “severely rent burdened,” are unsustainably rent burdened — paying 80% or more, usually 100% or more, of their income in rent.
Table 2: Rent Burden (Gross Rent as % of Household Income) —
Massachusetts Renter Households, American Community Survey 2023 1 year Microdata
| Burden Range | Households | Margin of Error* | % of Total |
|---|---|---|---|
| Under 50 percent | 724,431 | ±14,791 | 68.6% |
| 50.0 to 59.9 percent | 55,235 | ±5,230 | 5.2% |
| 60.0 to 69.9 percent | 35,596 | ±3,421 | 3.4% |
| 70.0 to 79.9 percent | 26,106 | ±3,405 | 2.5% |
| 80 to 89.9 percent | 19,736 | ±3,434 | 1.9% |
| 90.0 to 99.9 percent | 16,642 | ±2,956 | 1.6% |
| 100.0 percent or more | 120,900 | ±7,711 | 11.5% |
| Not Computed** | 56,842 | ±5,492 | 5.4% |
| 1,055,488 | ±14,733 | 100.0% |
* Margin of error is at the 90% confidence level — 90% confidence that the true number is ± the MOE from the stated estimate.
** Rent is zero or income is zero or income is negative.
In addition to the set of households showing as paying rent more than 80% of income there is a set of households for which rent burden is “Not Computed,” the last line in the table above. This set includes households which report no income or negative income but do report paying rent. These households should also be considered “unsustainably rent burdened.”
Table 3: Rent Burden Not Computed —
Massachusetts Renter Households, American Community Survey 2023 1 year Microdata
| Rent Burden Not Computed Reason | Households | Margin of Error* |
|---|---|---|
| Negative Income | 241** | ±397 |
| No rent | 38,223 | ±3,945 |
| Zero Income | 18,378 | ±3,374 |
| Total Not Computed | 56,842 | ±5,492 |
* Margin of error is at the 90% confidence level — 90% confidence that the true number is ± the MOE from the stated estimate.
** Not statistically different from zero
For purposes of discussion, we will be focusing on the Unsustainably Rent Burdened (URB) set defined as all those reporting income in excess of 80% of their income plus those with zero or negative income.
Table 4: Defining Rent Burden Vocabulary (Gross Rent as % of Household Income)
Massachusetts Renter Households, American Community Survey 2023 1 year Microdata
| Rent Burden Class | Households | Margin of Error* |
|---|---|---|
| No rent paid by renter | 38,223 | ±3,945 |
| Less than 30% — Manageable rent load | 472,981 | ±13,552 |
| 30% to < 50%, Rent burdened | 251,450 | ±9,013 |
| 50% to < 80%, Severely Rent burdened | 116,937 | ±7,720 |
| Unsustainably rent burdened (“URB”) (parts below) | 175,897 | ±10,010 |
| +Over 80%, unsustainably high income share | 157,278 | ±8,761 |
| +Negative income but pay rent | 241** | ±397 |
| +Zero income but pay rent | 18,378 | ±3,374 |
| Total: All Renters | 1,055,488 | ±14,733 |
* Margin of error is at the 90% confidence level — 90% confidence that the true number is ± the MOE from the stated estimate.
** Not statistically different from zero
The online data tables cited above round rent-burden and also top code it so that all rent-burdens over 100% are grouped together. In the tables above, we applied the same computation for comparability between the micro data and the online data. However, in the analysis below, we will refine our focus on the Unsustainably Rent Burdened households (“URB”) in three respects:
- We will use exact unrounded rent burden percentages.
- We will use 2023 inflation-adjusted income in the denominator of rent burden percentages. The microdata recommends an inflation factor be applied to income, but for whatever reason does not apply it in the rent-burden computations. The recommended inflation adjustment is small, 1.9518%, and we apply it to rent burden for consistency with other measures derived from adjusted income. This results in a slightly smaller “Unsustainably rent burdened” group.
- We will limit our URB definition to those households whose 2023 inflation-adjusted income qualifies them as “Extremely Low Income.” Households at other income levels comprise only 8% of our URB category. Income levels are defined according to the HUD fair market rent area of the Household. We use the 19 core-based statistical areas that were applicable in 2023, as opposed to the small areas used in 2024. See this previous post for an explanation of methods; we are using the PUMA to majority FMRA approach identified as Method 2 in that post.
Table 5: The Unsustainably Rent Burdened (N=157,951, counting ELI only)
among Massachusetts Renter Households who Pay Rent (N=1,017,265)
American Community Survey 2023 1 year Microdata
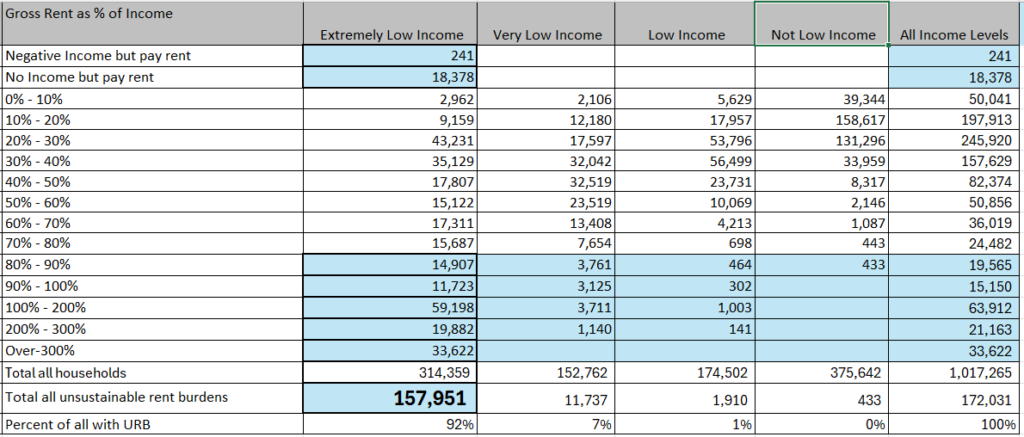
Overall N differs in Table 5 from Table 4 because Table 5 excludes households paying no rent. The URB total household count is first reduced to 172,031 in the last column of Table 5 from 175,897 in Table 4 by the rounding and inflation adjustment, then to 157,951 in the first column of table 5 by excluding higher income (non-ELI) households.
Rent and Income among the Unsustainably Rent Burdened
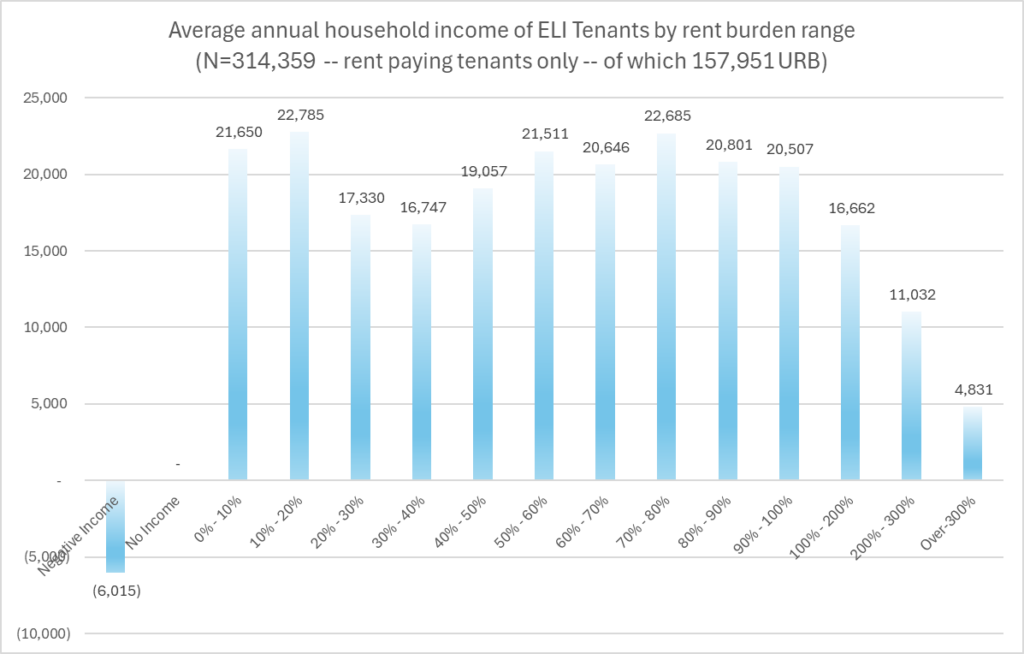
In this section, we collect some observations about the rents and incomes of Massachusetts households who appear as URB in the 2023 ACS 1-year data. For all of the blue shaded charts below, we show all 314,359 ELI rent-paying households to allow comparisons across rent-as-%-of-levels. Data for other income levels (VLI, LI, Not LI) appear in the resource spreadsheet. All “rent” figures are “gross rent”, which includes heat, electric, and water utilities.
URB Households report lower incomes than some other ELI households, but those in the largest URB burden range (100%-200% burdened as shown in table 5) have incomes ($16,662) comparable to those with burdens just above 30% ($16,747).
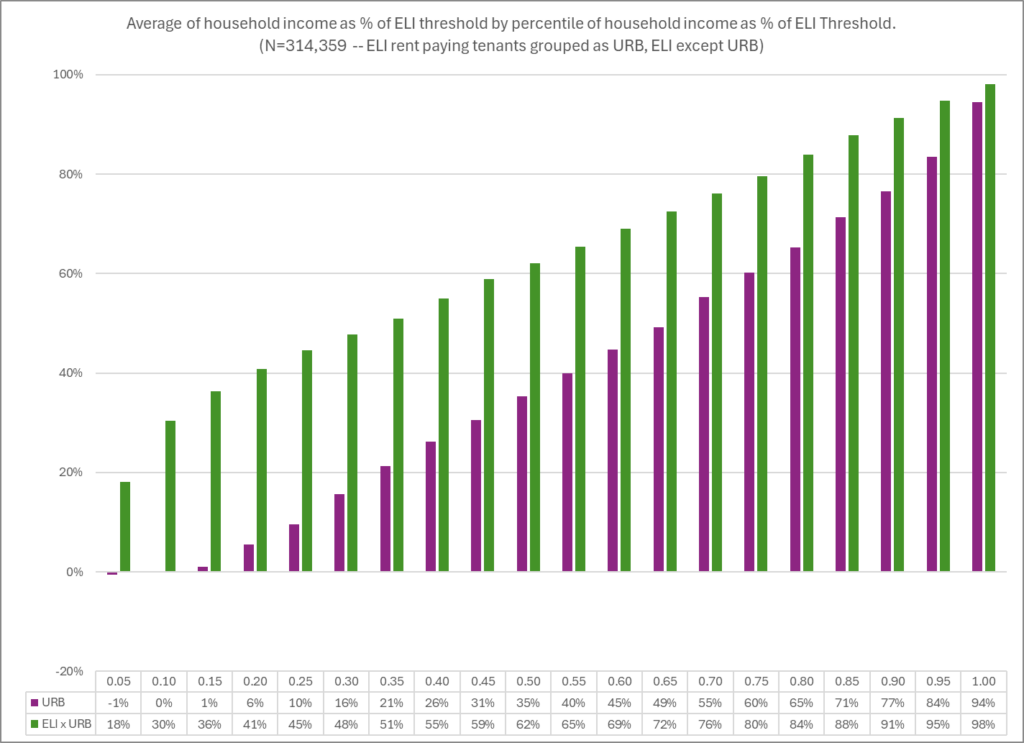
Reframing the ELI households in two categories — the URB and the ELI-but-not-URB — and then breaking each category into 5% percentile ranges, the generally lower incomes of the URB group emerge more clearly.
URB Households have per person income remaining after rent that places them far below poverty guidelines. Most show a negative remainder per person because their rent is above their income.
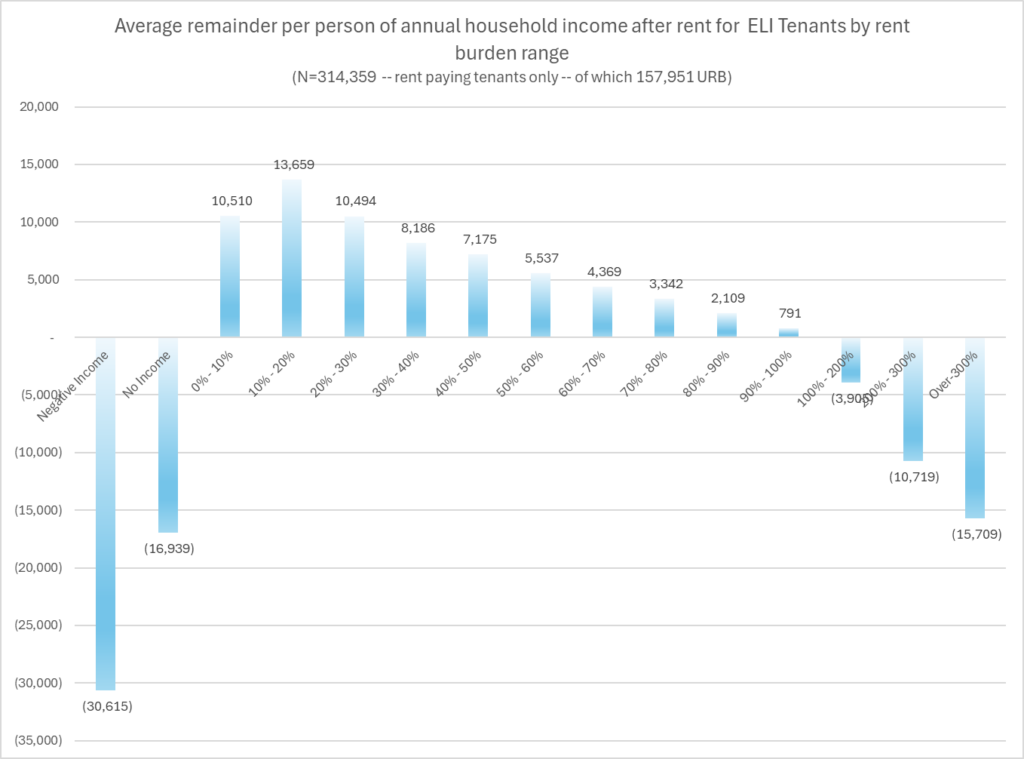
Note that federal poverty guidelines in 2023 allowed a base income of $14,580 for the first person and $5,140 for each additional person. The base has to cover not only gross rent (utilities are included in gross rent the figures above) but all other shared household expenses and all personal expenses. ELI households paying rent over 60% of income have less than $5,140 left per person and those paying over 80% have only $2,109 per person per year for all expenses other than rent. Clearly ELI households paying over 80% have an unsustainable rent burden and there is a good argument that any ELI paying much more than 40% have unsustainable rent burden. But to keep our URB definition uncontestable, we are using the 80% threshold.
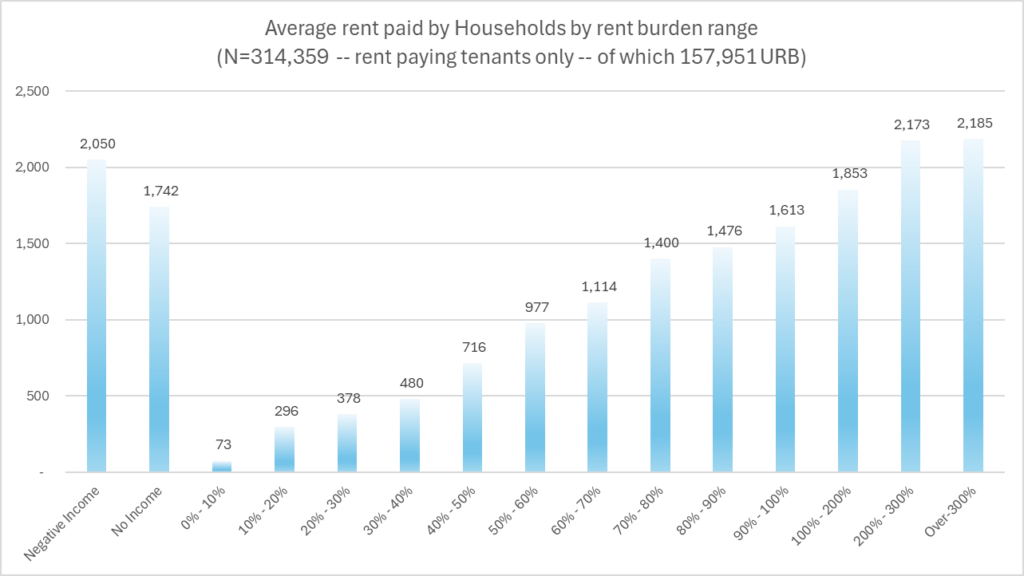
URB Households report much higher rent paid than non-burdened ELI households.
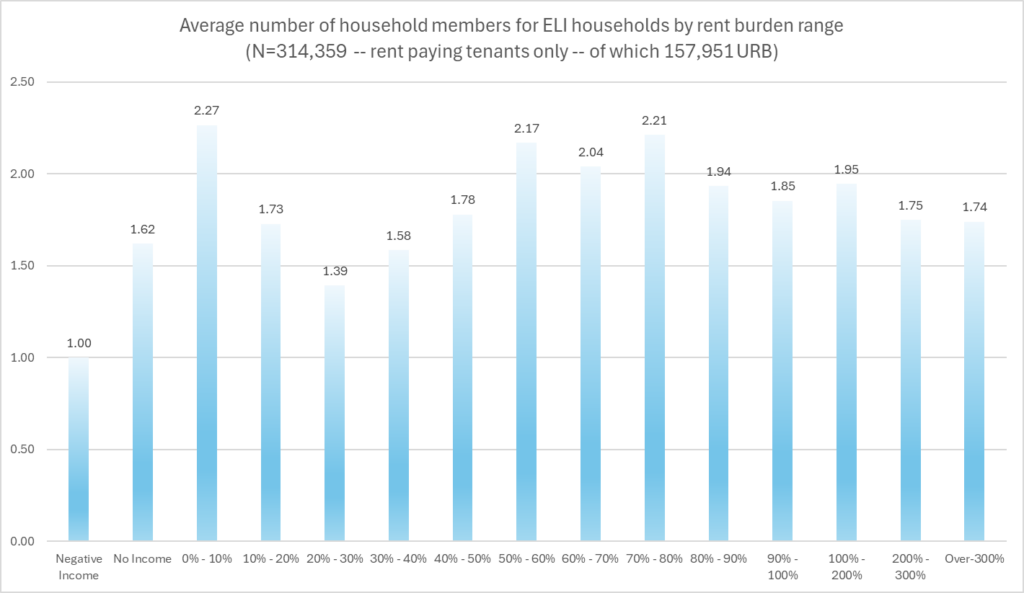
ELI household size varies across rent burden level, but not consistently.
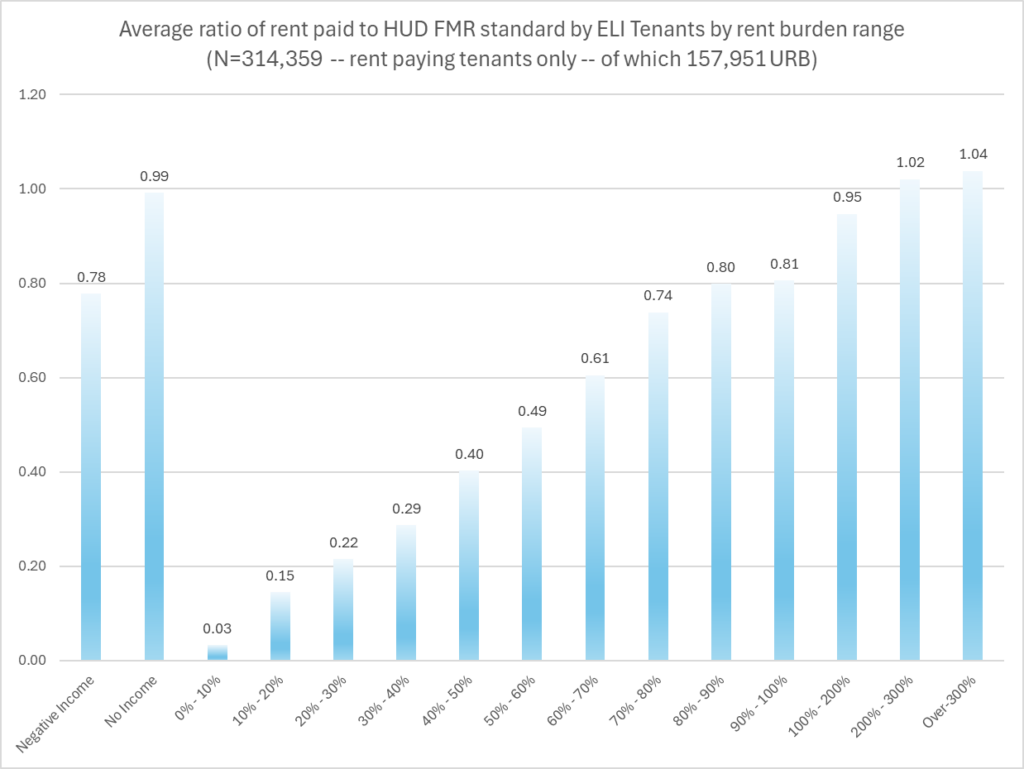
URB ELI households are paying rents very close to the HUD rent standard for their area and household size. Rents for the lowest burden categories are mostly so low that they have to reflect subsidy.
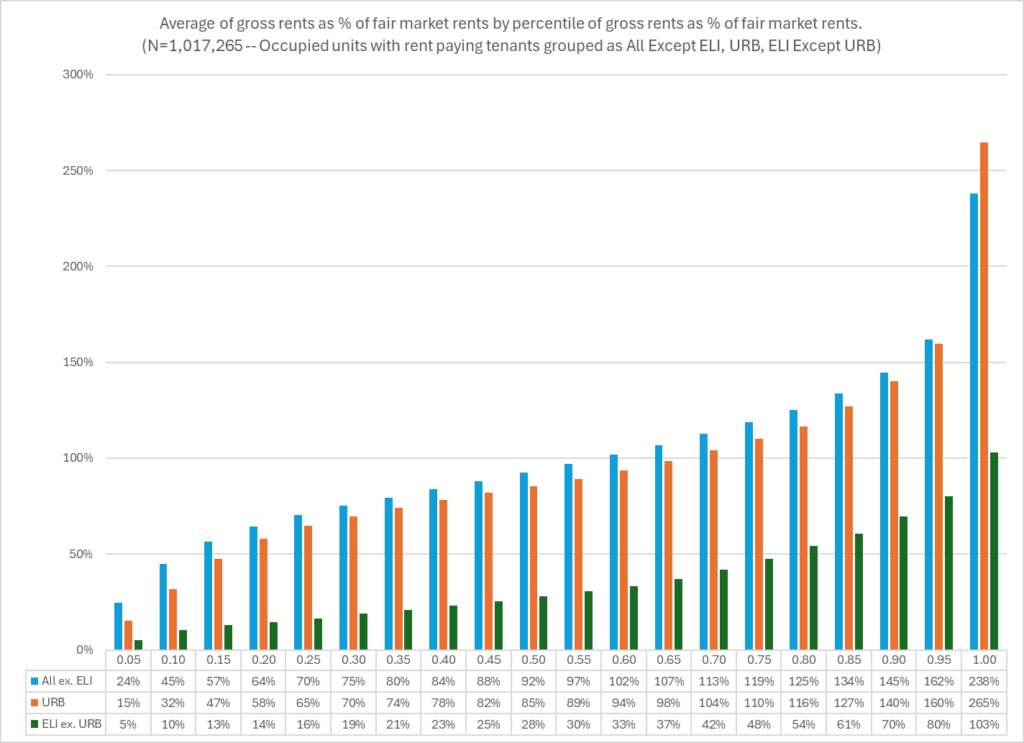
Framing all rent paying households in three categories — All except ELI, URB, ELI except URB — and then arraying them in percentiles by rent as percent of HUD FMR Rent (so adjusting for local market and household size), it emerges that the URB households are paying mostly market rents, while the ELI-except-URB households are paying much lower rents, likely mostly subsidized.
A point of empirical uncertainty is the extent to which households with rent subsidies report the payment they make or the total payment the landlord receives. We have to assume that households vary; we have previously reviewed one study comparing reported rent to administrative rent data for HUD mobile voucher tenants that found a roughly 40/60 split between reporting of own-payment and reporting of contract rent. The data in the study are noisy and this is a question that needs further research — ideally, the Bureau of the Census would consider adding some rent subsidy questions to the ACS. However, the existence of a large URB group is consistent with some ELI households reporting high contract rent (above their household income) that they themselves are not paying.
Additional Demographic Observations
The chart below collects a set of observations about differences between Unsustainably Rent Burdened Households and other ELI households. The universe selected is the households between the 25th and 75th percentile of ratio of income to ELI threshold. This selection normalizes the income levels by geography and household size and discards the outliers. Note that since the URB income distribution is a little lower than the income distribution for other ELI households, the URB selection captures fewer households. But the two selections have almost identical average incomes.
Characteristics of ELI Households with Incomes between 25th percentile and 75th percentile among ELI Households (percentiles of ratio of income to HUD ELI threshold). Ratio of income to HUD ELI threshold ranges from 30.6% to 74.2%. N=156,921 Rent Paying Tenants.
| Attribute | ELI Not URB | URB |
|---|---|---|
| Total Household Count | 90,118 | 66,803 |
| Average Age of Householder | 61 | 49 |
| Average Household Income (force matched by selection) | $15,925 | $15,801 |
| Enrolled in College or Grad School (householder) | 3% | 12% |
| Unemployed (householder) | 2% | 7% |
| Employed (householder) | 18% | 39% |
| Food stamps (household) | 78% | 51% |
| Non Citizen (householder) | 9% | 16% |
| Any income from source in household | ||
| Public Assistance | 15% | 11% |
| SSI | 34% | 18% |
| Social Security | 56% | 32% |
| Retilrement Income | 10% | 12% |
| Self Empoyment Income | 2% | 5% |
| Wage Income | 24% | 54% |
| Interest Income | 2% | 3% |
| Other Income | 4% | 8% |
This collection of statistics suggests no simple narrative — most of the differences are statistically significant, but not so wide as to allow a general characterization of the URB group. Some observations:
- The URB group do not appear to be primarily retirees or others working down wealth — they are younger, have less social security income, have little investment income, and are more likely to be employed and report wage income.
- Student headed households are notable (at 12%) among the URB, but not a large share.
- The unemployed are also higher (at 7%) among the URB, but not a large share.
- Although almost all ELI households are eligible for food stamps, the food stamp participation rate is lower among the URB group.
- SSI and public assistance participation rates are also lower among the URB group. (SSI and Public Assistance have more stringent eligibility than food stamps and participation rates are much lower than for foodstamps in both groups.)
- Non-citizenship rates are higher among the URB group.
The resource spreadsheet includes additional comparisons and variance analysis.
Summary
We defined the URB group as having high rent relative to income. It does appear that they are paying typical market rents as opposed to the low likely subsidized rents paid by others in the ELI group. Low incomes explain some of the URB cases, but not a large share.
Ultimately, we would like to understand how the URB group breaks down among:
- Households already receiving housing assistance that is invisible to the survey because the household is reporting of total contract rent instead of tenant payment.
- Households that are not truly low income, having access to substantial resources — income, assets, or relationships — that do not surface in the survey.
- Households that may or may not be low income but are receiving income that they under-report. This appears to be common especially at the lowest income levels: See these two papers identified to me by Luc Schuster.
- Meyer, Bruce D., and Nikolas Mittag. 2019. “Using Linked Survey and Administrative Data to Better Measure Income: Implications for Poverty, Program Effectiveness, and Holes in the Safety Net.” American Economic Journal: Applied Economics, 11 (2): 176–204.
- Bee, Adam, and Mitchell, Joshua. 2017. Do Older Americans Have More Income Than We Think? SESHD Working Paper #2017-39.
Unfortunately, the American Community Survey data alone do not help much to answer these questions — there are no household characteristics which consistently characterize the URB households (other than an unsustainably high rent burden). In a follow-up post, we put the data here together with our administrative data to narrow the possible answers.

Is a college student who is supported by his family, rents off-campus, and has little to no income “rent burdened”?
And similar cases?
You and I would agree that that person should probably not be referred to as “rent burdened,” but the frequently quoted burden statistics appear to include some people in that category. In the subsample above, 12% of households reporting rent greater than 80% of income are headed by college or graduate students.