
See improved results for 2023-4 here.
A couple of months ago, I reported mixed first-winter results from our heat pump installation: Adequate heat, but a refrigerant leak which wiped out several years of potential environmental benefits from the pump. That much stands.
But I went further and quoted my own estimate of the combined seasonal efficiency of our pumps at 154% and concluded that my pumps were an operating net negative from a greenhouse gas perspective even without the leak. I got a lot of feedback on that estimate, including some expert analysis of our home’s data, and I did some more analysis on my own. I now conclude that the true efficiency of our heat pumps cannot be ascertained with confidence from the data we have before us. I am uncertain, but I am hopeful that (a) if there are no further major refrigerant leaks, next winter the performance of the downstairs pump may well be in the 200% to 250% range which available research suggests is typical (and good enough to be modestly GHG positive) and (b) while the performance of the upstairs pump may remain depressed because it is over-sized, we may be able to manage it to improve efficiency. While I acknowledged in the first post that “studies show better average results than we have achieved,” each number matters in the climate conversation. So, I feel it is important to review the weaknesses of my first analysis.
Measuring heat pump performance
The best way to test a heat pump’s performance is to attach multiple sensors to the pump and directly measure how much heat it is pumping over several seasons. Direct measurement is expensive, but more and more robust studies using direct measurement are coming out.
Another alternative is to exhaustively model energy use in the building, using building science methods to estimate heat loss through each component of the building envelope and ventilation systems. One must also model various internal offsetting sources of heat within the building — water heaters, clothes dryers, stoves, office equipment, televisions, human metabolism, etc. Internal sources of heat gain can balance heat loss through the envelope in the same way that a person can stay warm with only their body heat in a sleeping bag. Heating systems kick-in only when heat losses exceed heat gains and drive the internal temperature below the thermostat setting. Internal sources of heat gain may be negligible relative to heat loss in a poorly insulated structure, but can be significant in a well-insulated home like ours. If one had a complete energy model, one could compute the efficiency of a heat pump over a season (known as the seasonal coefficient of performance or SCOP), as the ratio of the modeled heating load (btus converted to kwh) to the electrical energy (kwh) used by the heat pump.
Detailed modeling of energy balance is empirically difficult, especially as to internal gains. A common alternative is to estimate heat load based on known fuel use over a baseline heat period. This is the method that I used in my first post (the computations were detailed in an attached spreadsheet). I had kept good records of our gas use over a five winter period from from 2010 to 2015 and one of those winters was near identical to last winter based on “heating degree days.” Assuming that other factors were likely equal, I simply divided our gas use during that winter (2011-12) by the energy used by our heat pumps. I did not adjust for imperfect efficiency of the gas burner or the increased use of fans by the heat pumps. Both of those adjustments were small and would have made the heat pumps look slightly worse. Otherwise, there was nothing mathematically wrong with that computation, but it was simplistic.
Abode energy, the group that had helped us initially choose our heat pumps, asked one of their HVAC design consultants to look at my analysis. That consultant happened to have worked with one of the contractors who had bid on our heat pump installation and had access to several years of our heating data which I had provided. He did a rough re-analysis and reached the conclusion that our overall SCOP (combining downstairs and upstairs) was roughly 2.0, instead of my 1.5. He observed that the downstairs heating system carries most of the load for the building and concluded that the reason for the relatively poor performance of the upstairs pump was that it was over-sized as compared to the light load it had to carry.
The expert was generous with his explanation of his methodology and I take his points well: My first computation was simplistic in that it relied too heavily on a single winter. I failed to appreciate how noisy the fuel use data is. Using linear regression, one can take advantage of all the available winters of data to develop a more robust baseline. Additionally, I erred in assuming that the single winter was a good comparison just by looking at the heating degree days from a base of 65. (The base is the temperature from which outdoor temperatures are subtracted to count heating degree days — more explanation of heating degree day bases here.) Just because two winters have the same total heating degree days from base 65 does not mean they will have the same heating degree days from base 50. As a rough way of factoring in internal heat gains, one needs to try regressions of baseline fuel use against degree days from multiple bases and use the HDD base that fits the fuel use data best.
The expert did not have access to our complete baseline fuel use data and did not choose to do a full set of regression runs from alternative heating degree day bases measured from the nearest weather-stations. He had enough professional experience to be confident in his rough analysis and practical judgment that the over-sizing of the upstairs pump was the main problem and that otherwise the pump performance was not too far off typical. He felt that further analysis would not likely add confidence to that basic conclusion. I accept that conclusion, although I come to it in a different way as discussed further below.
For a learning experience and just to make sure we weren’t missing anything, I went back and redid the regression analysis of monthly gas use vs. degree-days using the full period of available baseline data and implementing the consultant’s methodological pointers. I purchased the degree-day measurements from both Logan and Bedford airports at all bases from 39 to 71 degrees. Since we are roughly equidistant from those two weather stations, I averaged the degree counts between them. I then tested regressions of the full five winters of measured baseline fuel use against all HDD bases between 39 and 71. I found that the best fit regression (R-squared of .967) for our combined two units was with HDD base 49.
Best fit model (HDD49) for heating energy use during base line period (R-squared = .967)
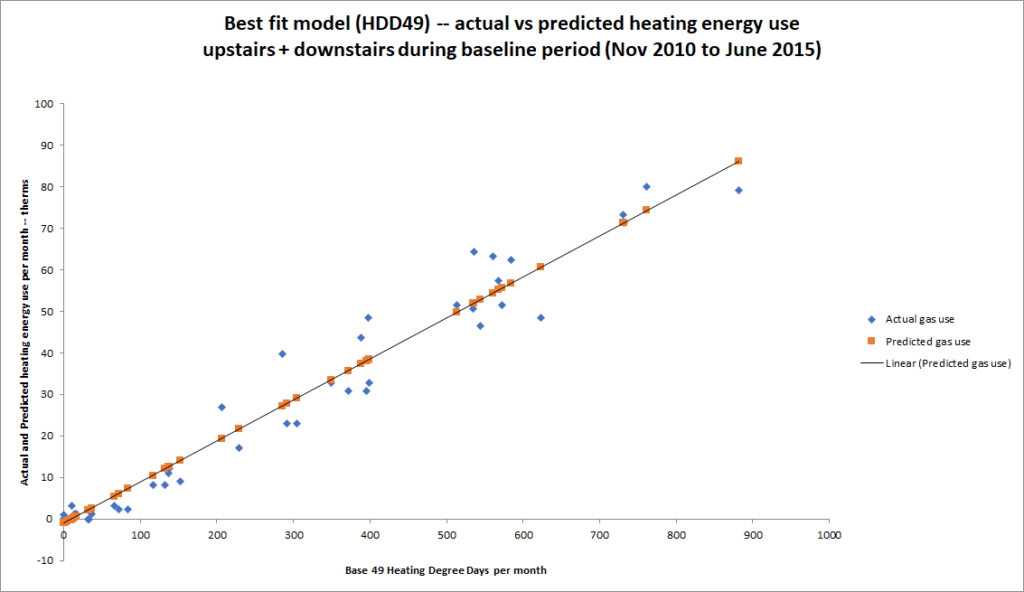
During the baseline fuel period, our home was reasonably well-occupied — my retired parents were mostly at home, did a lot of cooking and cleaning, and used home office equipment heavily. Degreedays.net offers the “very rough estimate” that a “well-insulated building with more people and a fair amount of home or office equipment might have an average internal heat gain of 5°C or so (9°F or so).” So, in our maximally insulated and well-occupied pair of homes a combined balance point of 49°F seems plausible — perhaps 13°F below our thermostat settings (including night set-backs).
Note: As another check on plausibility of 49°F, based on the modeled line slope (0.1), 13°F additional degree days per day translates into 2708 btus/hour for each home (.1 model slope (therms/HDD) * 13 degrees * 30 days/month * (1/720) months/hour * 100000 (btus/therm) * 1/2 units/structure). 2708 btus/hour is close to the Model J allowance for a two bedroom apartment — according to Green Building Advisor, “At the low end, the Manual J process assigns about 2500 Btu/hr of internal gains for a two-bedroom house or apartment.” This is not a fair direct comparison because the real application of internal gains in Manual J is to estimate peak cooling loads as opposed to average heating loads, but it offers a comparison in the same general ballpark.
Using this more rigorous regression approach, I nonetheless ended up fairly close to my first estimate as to performance — a combined performance of 1.65 (formerly 1.54), with the downstairs pump at 1.92 and the upstairs pump at 1.21. This spreadsheet details that more complete analysis.
Special circumstances in our installation
I might, based on the reanalysis that didn’t change the bottom line much, continue to view the performance of my heat pumps as mysteriously disappointing and continue to speculate about possible design flaws: too much pressure in the ductwork? But I did some additional analysis that (a) exposes a larger impact of the refrigerant leak that we fixed in March on the performance of the downstairs pump; (b) suggests other dynamics putting in question the whole before vs. after estimating methodology.
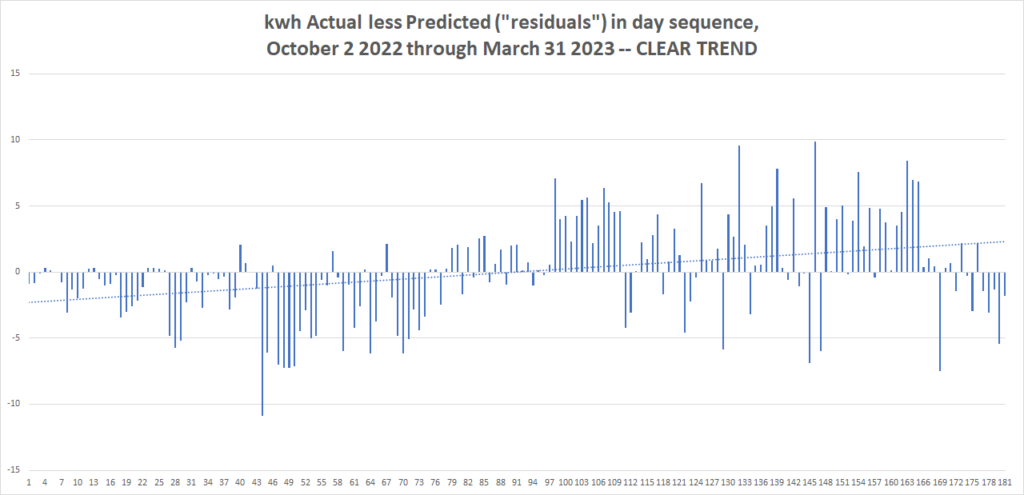
I had previously viewed the leak as not affecting the whole winter, just a negligible period. But when I did a daily regression of the power use of the downstairs pump against HDD (at base 51) and arrayed the residual errors chronologically, a clear trend jumped out: The model based on the whole winter projects lower than actual power use in the late season and higher than actual power in the early season — consistent with the efficiency of the pump declining through the winter. We do not know when the leak started, but the pumps were installed the previous June, so the leak may have depressed performance even from the beginning of the winter.
Residual error in whole-season daily regression model increasing — suggests leak taking increasing performance toll through the winter (leak fixed March 14, Day 164)
If, to minimize the impact of the refrigerant leak, one computes the performance of the pumps over just the first three months of the winter, one gets a combined coefficient of performance of 1.82, with the downstairs pump at 2.4 and the upstairs pump at 1.1. Consistent with the consultant’s view of the situation, it seems possible that the downstairs pump could perform acceptably if properly charged with refrigerant. But three months of data — likely still to some extent distorted by the leak — is not enough to support a real estimate.
An additional insight emerged in the re-analysis: It is clear that our energy usage patterns have changed substantially since my parents passed away, casting doubt on the whole before-and-after-comparison methodology. First, the relative shares of the two units have changed. During the baseline period, the downstairs unit where my parents resided accounted for 73% of the heating gas use. In the single season of gas use that we have after their deaths in 2021, the downstairs unit accounted for only 52% of the heating gas use. After the heat pump retrofit, the downstairs unit accounted for 62% of the electric energy for heating, but that share may be inflated by operating inefficiency caused by the leak. The shift in load share could contribute to the low estimate of the upstairs heat pump’s performance; conversely, it could inflate the estimated performance of the downstairs pump.
Shifting shares of total heating energy use
| % of heating energy use | Downstairs | Upstairs | Both |
| Baseline (gas) | 73% | 27% | 100% |
| Post-occupancy change (gas) | 52% | 48% | 100% |
| Post retrofit (kwh) | 62% | 38% | 100% |
A subtler indicator of changed energy use patterns is that the regressions on the fuel use for the units separately yield different best fit balance points and a swap in the relative balance points for the two units before and after retrofit.
Best fit regression balance-points for units separately
| Best fit HDD base | Downstairs | Upstairs | Both |
| Baseline | HDD52 | HDD43 | HDD49 |
| Post retrofit | HDD42 | HDD56 | HDD49 |
Certainly these changes make any estimate of an individual pump’s performance invalid. And there is one more data point that raises a question about the relevance of the baseline even for both pumps together: We did have one season of gas use (2021-2022) after my parents passed away. Total use in that season was considerably above what the baseline model from 2010 to 2015 predicted: we would have expected it to drop as a result of lower thermostat settings. Perhaps loss of their heavy occupancy of the downstairs unit may have reduced internal gains. But that theory is belied by the preceding table in two ways: (a) the overall balance point for both units didn’t change; and (b) the downstairs balance point actually went down. [Note added January 2024: An additional unknown is the extent and direction of change in use of the energy recover ventilators. A drop in ERV use would lower the balance point of a unit and reduce energy use. If operated 100% of the time, the ERV in one unit would account for roughly 3 MMBTu load per season, so the unknown operating time percentage is a significant variable given that total heating load for both units is only 20 to 30MMBtu. See ERV loss estimate spreadsheet.] We have crude indicators pointing in opposite directions and one season does not support a good inference anyway, but if load has in fact somehow increased above baseline, then that would depress the efficiency of both pumps as appearing through our methodology.
Possible unexplained upwards drift in heating energy consumption
| Predicted heating gas use for 2021-22 season based on model from 2010 to 2015 baseline (HDD49) | 186 therms |
| Actual heating gas use in 2021-22 season | 255 therms |
Conclusion
There are indicators pointing in conflicting directions in this case and we shouldn’t attempt to compute efficiency numbers out of it. The leak alone is enough to discard the first season’s results. I’ll provisionally accept the wisdom of the experienced professional that the downstairs pump is probably fine (when not leaking) — likely below rated efficiency but to the typical degree — and that the upstairs pump is likely oversized. As to greenhouse gas benefit, we’ll see if we can manage performance to achieve results next winter that would allow us to claim operating benefits with confidence.
Brilliant Analysis
Reading through the analysis…probably less complicated traveling to the Moon. Not sure there has ever been a larger McGuffin in all of History.
Will, thanks for your ongoing, open, honest, and very detailed review of your experience with heat pumps!
Thanks, Will, good analysis.
We’re all looking forward to getting rid of our gas stoves, buying a $40,000 electric car which runs off electricity generated by fossil fuels, experimental vaccines, more lock-downs, mandatory Woke education courses for kids, parents, and the childless, and having illegal migrants camp out on our front lawns.
By the way, when are the Woke people in your district going to demand that we get our share of illegal migrants?
https://www.wcvb.com/article/massachusetts-impact-title-42-expiration-migrants/43870036
Just asking.
Sounds like the “utopia” Senator Brownsberger is all in on Dee!! How ’bout his desire to decimalize hard drugs?? You left that one out. I had to walk within two feet of two junkies shooting up on the steps of Harvard Vanguard Medical Associates, adjacent to Copley Square on Dartmouth Street, to access my appointment with my MD in Boston this week. At 3:00 in the afternoon. I seemed to be the only one upset about it. Security at Harvard Vanguard said they never call police. Security told me they do ask the junkies to move on, when they get complaints from patients like me, but they also told me the junkies just come right back. When I complain to my doctor, she said “oh I’d hate to see them go to jail.” And my reply was “it’s not compassionate to watch people destroy themselves. They need to be offered treatment, or they need to be locked up. Then they’ll be responsible for their own consequences.” But apparently, that’s asking too much of both Senator Brownsburger, and much of the medical community, and our fellow constituents nowadays. Massachusetts is a pseudo woke joke. And where I live, in Boston, we have a Mayor that’s advocating for and supporting chemical and physical castration of gender confused minors at Boston Children’s Hospital. This is yet another issue of concern for me that Senator Brownsberger has no concern about at all. But he sure did make it a priority to make sure the State of MA gives away thousands of dollars to residents to toss out their perfectly functioning gas heating systems to replace them with heat pumps that are primarily fueled by fossil fuels. And he was all for mandating the “warp speed” injections for people to access restaurants and keep their jobs, while he worked to pass legislation to lower the age of consent for abortion. What an inside out upside down clown show.
Even though you’ve done the math, I still don’t know if you think heat pumps are a wise investment from either an economic or environmental perspective. Also, your analysis seems only to apply to homes originally heated with gas. I still cannot conclude whether we’re kidding ourselves about the climate impact of heat pumps, and it bothers me because they’ve been so conspicuously touted as climate solutions. I suspect we’re near net zero efficiency gain once we factor in the carbon cost of manufacturing and installing heat pumps relative to other energy sources or, as for most homes, doing nothing at all. In short, and as for the universe at large, we seem to be heading for heat death no matter what we do. Cheers.
No worries. Humans will not become extinct from heat deaths. It’s just that the habitable areas, and those that will be able to provide resources we need, will shrink – and that will lead to a reduction in human population, which will then likely reverse warming. We who are alive now will be long, long gone when that happens (I speculate it may be a thousand years from now). So the whole climate alarm-ism movement is just a waste of time, money and resources.
Also, what our propagandist media are not telling the public is that our planet’s climate has never been static – it has always been in flux, going through heating and cooling cycles, well before humans emerged as a species, and certainly before we started using fossil fuels.
There are scientific proofs for that. About 8 thousand years ago, the area that is now submerged under the North Sea was open land that was inhabited by humans ( https://en.wikipedia.org/wiki/Doggerland ). Rising see levels made that area disappear under water — which of course had nothing to do with human activities (since the number of people who lived back then was very small and they lived primitive, pre-industrial lives). The warming happened gradually, giving people time to move to higher grounds. There are other ancient places across the world that also disappeared under water ( https://medium.com/@humanoriginproject/8-mysterious-underwater-ruins-of-lost-civilizations-8f83aee6b117 ).
So it is to be expected that this will happen again – the climate will get warmer, and sea levels will rise – but given that the planet is overpopulated now, that process will likely shrink the numbers of humans. That is how Nature is going to restore balance – a good thing, since people’s tendency to overpopulate makes us incapable of keeping the natural environment in balance.
Looking back at cyclical climate changes that happened before (and have been documented by science), rational people understand that stopping climate change is beyond our control – just as nobody would have been able to stop Doggerland and other ancient cities/civilizations from disappearing under water.
Why are we not being told those things? Because there are some very powerful interests that have heavily invested in “green” technologies and devices, and they want to make sure that those technologies are implemented on a global scale and create huge profits for them. It’s “new money” (“green” industries) trying to beat “old money” (fossil fuel industries).
The battle to use the power of governments to force people to embrace “green” technologies has reached a point where rational discussions are no longer possible. We can expect that oppressive measures will be put in place to ensure that people have very few choices when it comes to housing, transportation, energy consumption, and consumer goods. This may lead to some major sociopolitical upheavals, as well as wars (which the “greenies” would likely lose because fossil fuels are much more effective in military operations that “green” technologies).
In view of all of that, the issue of using or not using heat pumps is in my opinion very small potatoes. We should be focusing heavily on nature conservation, population control, and prevention of plastic and toxic pollution.
Weaning ourselves from fossil fuels is desirable as well — but that has to be done gradually, very thoughtfully, and it will require new technologies that we don’t yet have. Our civilization cannot be run on wind mills and solar panels – it just can’t.
I guess Nuclear energy is the way to go
Thanks for taking the time to do the analysis and provide the update, I’ve very happy to see a decision-maker looking at the facts.
Will, while the unknown onset and duration of the leak are major questions for this analysis that are best addressed by waiting for another year of data, the serial correlation in the residuals suggests two possibilities worth exploring. I would test whether the leak started around day 98 (Jan 6, 2023) and stopped on day 165 (March 14). This would be supported by estimating the model from day 1 through day 97, and predicting kwh for days 166 to the end. If the mean predicted residual is not statistically different from zero and the serial correlation was greatly attenuated, then the model estimated on the first half of the sample might be usable.
The other possibility is that the leak happened and then ended before the sample period. In that case, the serial correlation suggests the model is fundamentally mis-specified and omits relevant explanatory variables. I would start testing this possibility by including a quadratic term in HDD because the effects of heat on temperature of the house may well be non-linear. It would be interesting if the quadratic term was statistically significant and the serial correlation was also reduced.
Thanks, Roy.
Good suggestion: October and early November don’t have a lot of heating degree days from base 49 so the power use and residuals are all small. Starting the regression in mid November and running through December, the image below shows the residuals for a regression of the last 51 days of 2022 for the downstairs pump — the trend towards more power use due to the leak is already emerging in that period.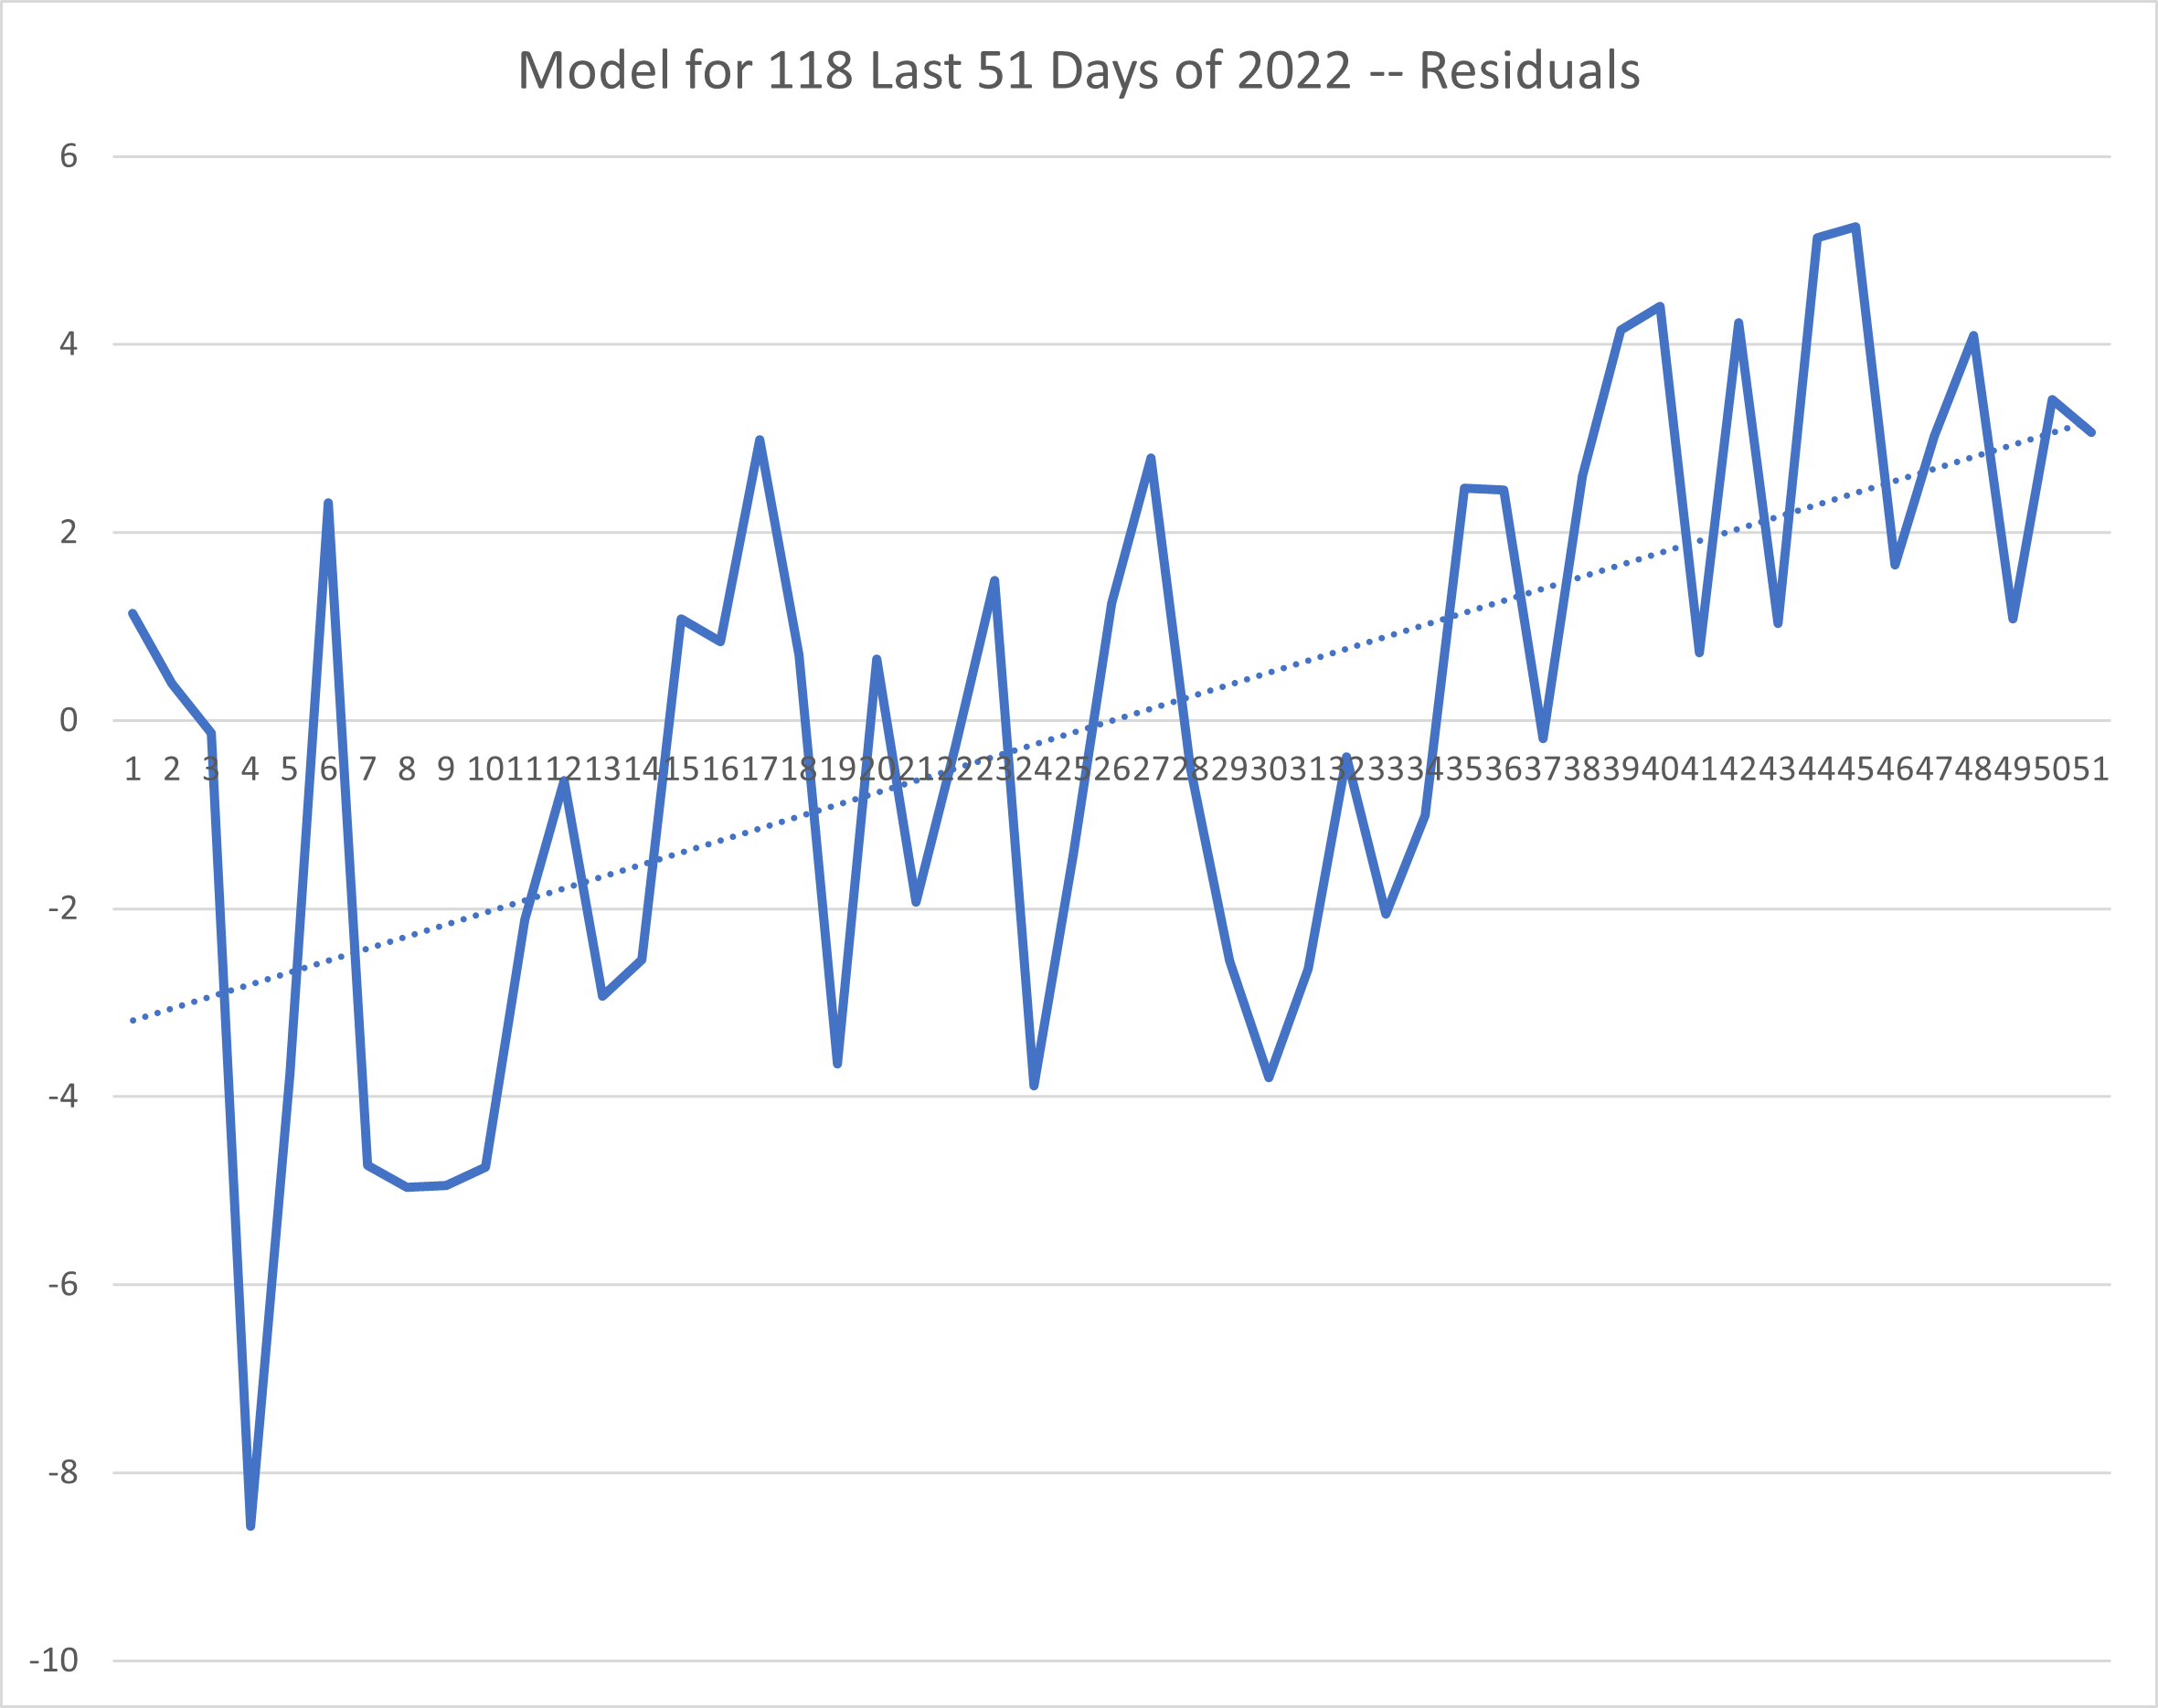
We have additional kinds of data to look at. From the patterns of instantaneous power use of the pump one could see a progressive deterioration which was in progress over a period of months. The pump got less and less able to achieve full power use, so that by March it basically flat-lined (at a constant but non-maximal draw of power). This image from December 24 shows it already somewhat below the identical upstairs pump in max power.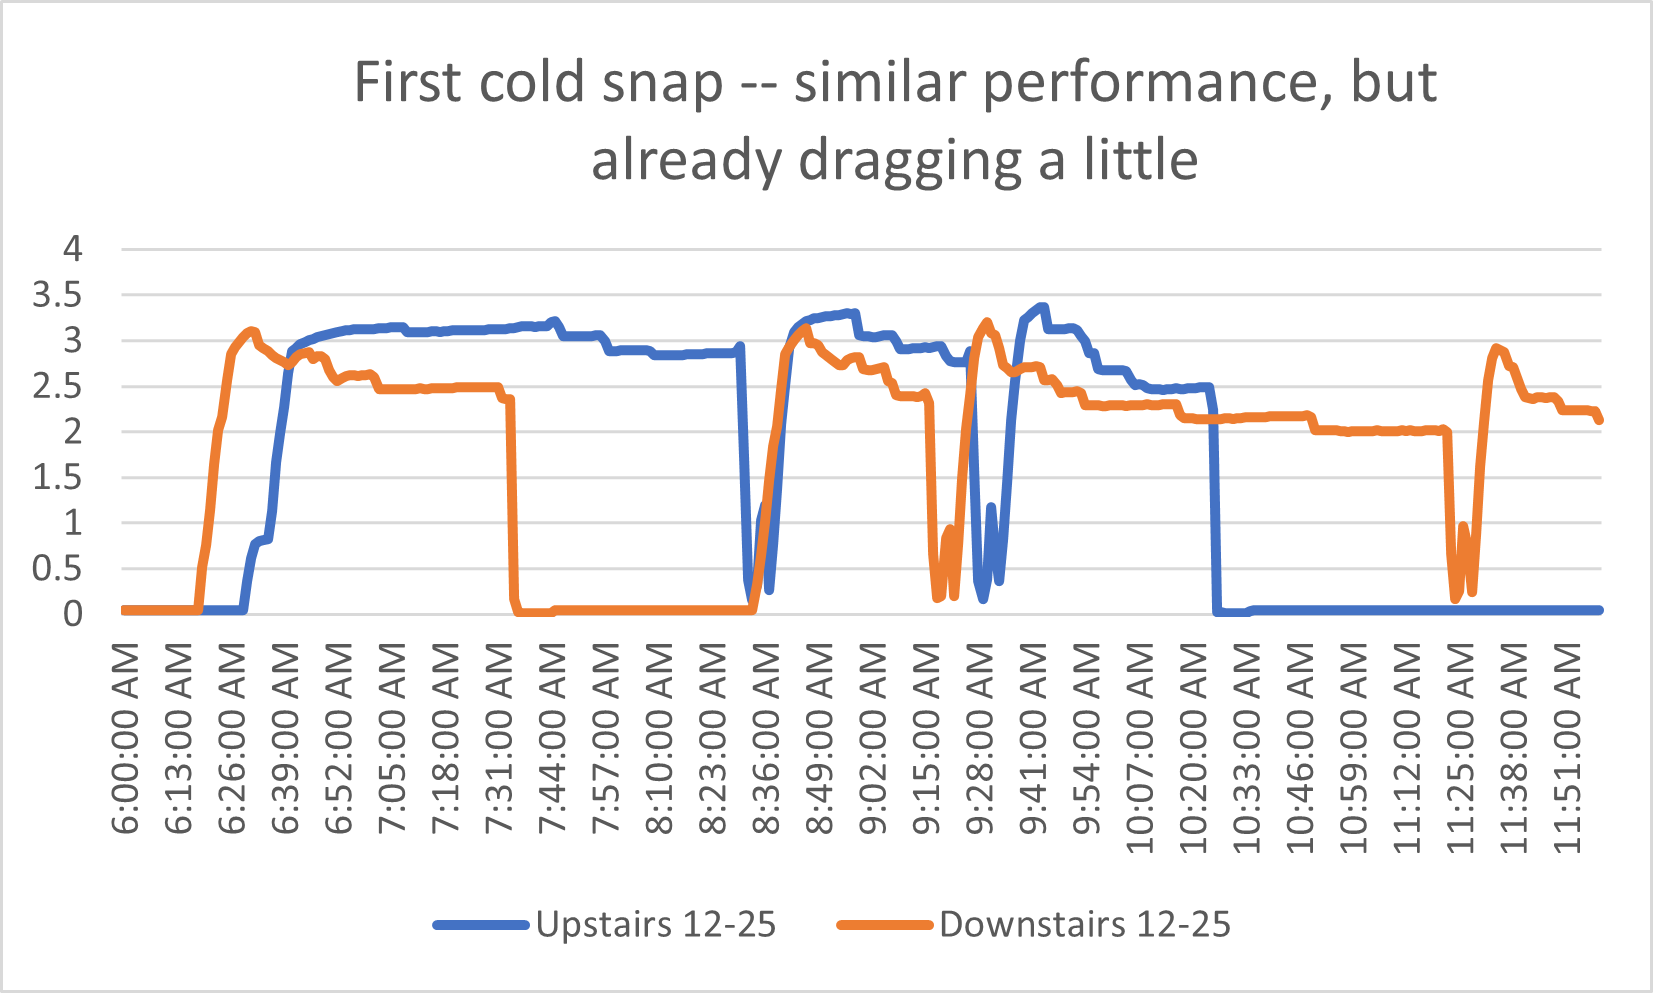 .
.
I think it is clear that the leak was gradual and had a progressive impact that grew through most of the observation period.
Seems to me that the green efficiency of heat pumps are at best marginal and not worth the time figuring it out as the the capital investment. My brother installed a heat pump and regrets it. His gas expenses have only increased. As for myself, I will keep my gas heating system, continue to drive a gas efficient car and keep my gas stove.
I really appreciate your persistence in evaluating your heat pumps. While the math is beyond me, you are clear enough in your assessment for me to get the big picture. I’m not sold on the technology yet, least of all can afford it, but the only way we are going to keep warm/cool when necessary without fossil fuels is to try stuff out. Every solution so far, from wind, solar, etc has downsides in resource use to create, manufacture, maintain or use, for humans and wildlife.
Thanks so much for your expansive work on this subject, Will. Way above my pay grade, but appreciate your analyses.
Did the Senator factor in the energy and time expenditure in performing this analysis? What fraction of glucose came from a chain that sprouted in perto-fertilized fields and our grid? JK. Every gram of moral behavior to reduce consumption is vastly swamps and marginal gain from technological distractions such as heat pumps and electric cars which are probably just carbon credit laundering anyway. As a divergent and non-realist I have to say that politics, when it is leadership, is the immediate, if not primary solution, not science. President Carter was a moral leader and a scientist -a technologist at least- who made slow, unglamorous gains in improving the moral fiber of his country. Democrats are not ready to accept how the Democratic Party from W. J. Clinton on down is profoundly morally corrupted and wholly co-opted by non-Democratic players and interests. The overt corruptions of Tammany and machine politics pale in comparison to today’s zeitgeist where politicians confuse their interests with the people’s interests and risk nothing for the greater good. Gone are the days when Dems speak out against the immoral i heart media consolidation and the butcher of Mains Street vertical integration. And both Dems and Republicans demonize and make enemies of their fellow man. It’s hard to fault any one given politician for being in their box. Well, anyhoo
I’m not knocking the analysis. There’s no cheating thermodynamics. Every smidge of improved efficiency is precious. What I’m saying is all drops of efficiency we squeeze out of a given type of heat pump or other machine is made almost literally insignificant by the incautious spending of a single $1.00 as coal is dug up to power the factories in China and elsewhere and is lugged over the seas on terraforming containerships.
Agreed that I’m in the weeds here. But I’m trying to be careful about each part of the bigger picture of climate change.
Well said, Fred. Let’s start with the assumption that if everyone in the world lived like we do, civilization is doomed. Despite Bucky Fuller’s more-with-less ethos (which is not where all tech is going; take bitcoining), the planet simply cannot afford it. So the powers-that-be know that, and their response is to make sure almost nobody but people they want to influence or succeed can enjoy living like they do. But then, on a modest scale, most of us turn out to be like those fat cats, clinging to whatever precarious privileges we may have as carbon continues to escape and inequalities continue to abound. Marginal efficiencies will not save us from our profligacy. We have met the enemy and s/he is us.
Thank you for sharing.
Once again, I appreciate the honesty in your analysis. I think the bottom line here is that, leak or no leak, this technology is not a game changer for the consumer, nor the environment. Most people can’t afford the up front cost of conversion, and even if they can won’t spend the money if they have a viable heating system in place. Why would they if there is not a fairly rapid return on the capital outlay?
So why is the State so fixated on electrifying everything if the upfront cost is going to prevent the uptake of the technology, if the operation is going to do little environmentally, and the operating cost is a push at best (better hope we don’t see another 60%+ rate increase this winter).
Why aren’t we spending money on weatherization, which would give an immediate return both financially and environmentally? Why does the State refuse to acknowledge biofuel as a viable solution that is being used NOW without expensive equipment changes or increased in operating cost. Why aren’t we pushing residential and commercial solar, which would reduce the need to operate power plants? The myopia here is sad, and one has to wonder if this is just a sop to the utilities, who will continue to generate electricity with natural gas for a long time to come, especially with the anticipated additional load on the grid. An all or nothing solution will no doubt have little success in getting to net zero.