
This post shares the results of direct efficiency metering of the heat pumps in our family home over the past heating season and reconciles those results to the results of a different methodology reported last year. The practical takeaways are:
- The poor performance results we got last year were entirely due to refrigerant leaks. With leaks fixed, the final results of efficiency measurement are pretty good for both of our pumps — efficiency at the rated level at an outdoor temperature of 47F and only 15 or 20% below the rated level at 17F.
- Consumer tip: Heat pump owners should periodically check the heat coming from their heat pumps — reduced supply air temperature can indicate a refrigerant leak. Just use a reasonable quality thermometer in the warm air stream coming off the inside air handler. Discuss expectations for the hot air temperature with your heat pump installer and/or benchmark the pump when it is new or freshly maintained. In our case, when the pump is heating, the air coming off the air handler should be at least 100F and preferably over 110F. Alternatively, but not recommended, one can just touch the refrigerant pipes: If the refrigerant pipes feeding the heat pump are accessible to the touch, the one going into the pump should feel quite hot — not like a stove top, but like a bath that is too hot.
- Refrigerant gas leaks from heat pumps degrade both efficiency and capacity as well as being harmful to the environment. We need to pay more attention to this problem from a public policy perspective. This will remain a continuing focus for me.
Background
Last year, I published a disappointing estimate of the efficiency of our installed heat pumps. I subsequently concluded that I didn’t know the true efficiency because refrigerant leaks had driven down the performance through much of the winter (not just in the last few weeks as I initially believed).
Last year we had estimated heating load based on natural gas use in prior winters adjusted by regression analysis to reflect variations in winter temperature. Last year’s efficiency estimates were based on dividing (a) estimated heating load by (b) currently measured power use by our heat pumps. In addition to the distortions from leaks, it became evident that the relative load of the upstairs and downstairs apartments had shifted over time, distorting comparisons of historical heating load for the two units.
This year, I started the season by working with our installer to insure that leaks found in both heat pumps were finally fixed. One pump turned out to have a leak due to a hairline crack in a connection fitting bolt. The other apparently had a leak in the pipes within the air handler. Also, I consulted several experts and installed direct heat production metering on our heat pumps. This involves real-time logging of the temperature of the air going into and out of the indoor heat pump circulating fans and careful estimation of the air flow rate through those fans. I’ve documented this year’s measurement approach exhaustively here.
Basic Performance findings
The chart below shows the performance curves of both the upstairs and downstairs pumps at different temperatures based on direct real-time measurement. Each dot represents a heating activation of the pump. We run our heat pumps using an evening temperature set back. Most of the activations occurred during the morning hours after the end of the set back. The average length of measured activations was 235 minutes upstairs and 102 minutes downstairs. (Much of the difference in length of activation was due to a period when the upstairs pump had leaked and was running longer as a result.)
The placement of the activation dot on the x-axis reflects the average outdoor temperature during that activation. The placement on the y-axis represents the ratio of heat produced during the activation to electric power used by the fan and the compressor during the activation — the coefficient of performance during that activation.
Coefficient of performance vs. outside temperature — November 7, 2023 through March 14, 2024 (93* measured activations for upstairs pump; 193* measured activations for downstairs pump)
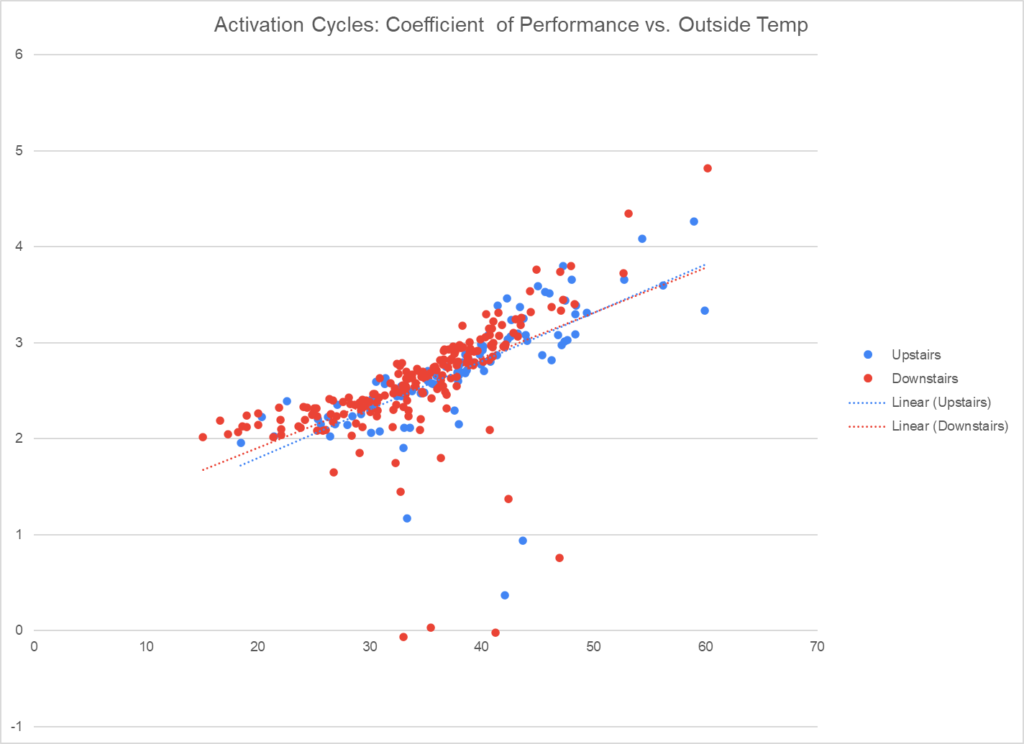
There does not appear to be much overall performance difference between the upstairs and downstairs pumps, which are identical although the upstairs pump serves a larger unit. The results shown in the graph above, taken collectively for both pumps, are close to the rated performance of the heat pumps we installed — spot on at the higher end of the temperature range, 15 or 20% below for the lower end.
| COP at 47F outdoor | COP at 17F outdoor | |
|---|---|---|
| Rated performance per NEEP | 3.26 | 2.58 |
| Direct metering of pumps as installed | Approximately 3.3 | Approximately 2.1 |
A couple of notes about the data:
- The outlier cycles with COP under 1.5 in the graph are short cycles; short cycles were rare for both pumps. All six of the short inefficient cycles for the downstairs pump occurred between 3:50PM and 4:00PM (on six different random days) and appear to coincide with our end-of-day thermostat setback time of 4PM. Additionally, two of the outliers for the upstairs pump occurred on a day when we were repositioning the temperature sensor and the supply air temperature was likely understated.
- The points at the lowest end of the temperature range, which show performance 15 or 20% below rated performance, do not include any cycles where performance was diminished due to the leak in the upstairs pump — that leak was fixed before the coldest weather set in. See further discussion below.
Impact of leaks on performance in this season
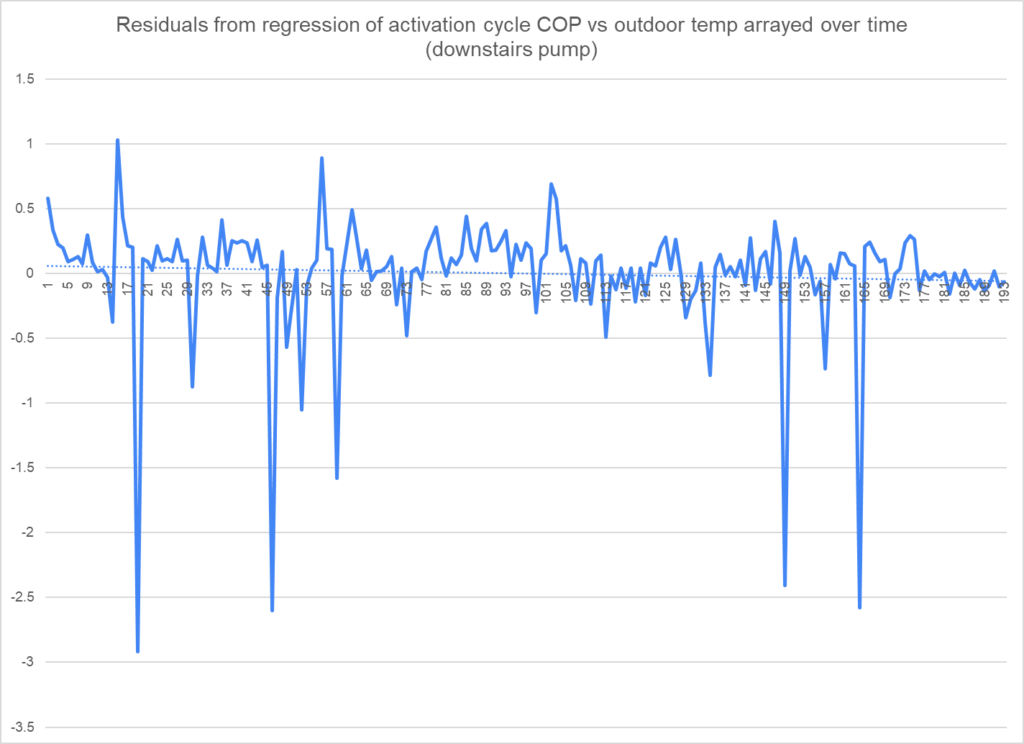
We were, of course, concerned that our results might again be distorted by leaks. One way of checking for leak impact is to look for change of performance over time. The two graphs below show in temporal order the residual values from the scatter plot above, regressing performance vs outdoor temperature. For the downstairs pump, there is a very slight downtrend in performance which is not statistically significant. A leak in the downstairs pump was fixed before the study period began, but during the study period there were no maintenance events on the downstairs pump and no reason to believe that there was material refrigerant leakage. The performance measurement for the downstairs pump appears clean.
Downstairs pump: activation cycle performance deviations in order of measurement
As to the upstairs pump, the same chart does show a modest uptrend in performance likely related to maintenance events as further discussed below.
Upstairs pump: activation cycle performance deviations in order of measurement
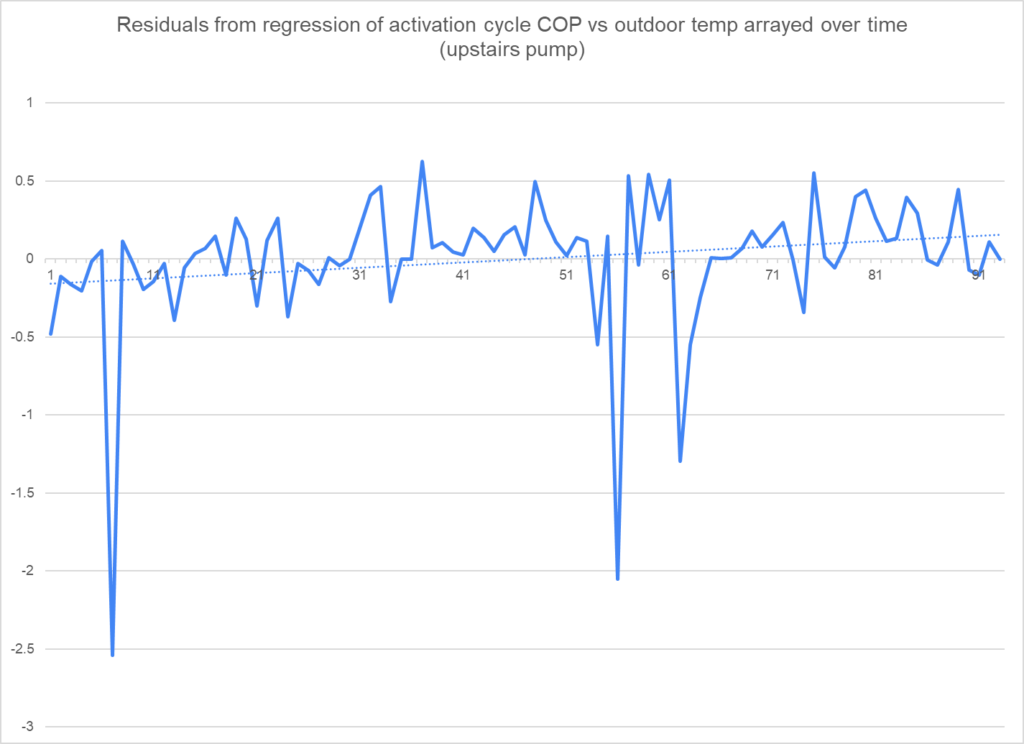
For the upstairs pump, there were two maintenance events during the study period. The pump was leaking and undercharged with refrigerant for the first month of the study period and was recharged on December 6. The performance after December 6 seemed normal, but our installer suspected the heating coil of leaking and removed and replaced it over the New Years’ Day weekend. The heating coil replacement apparently resulted in a small amount of cool return air flow around the coil on the side near our supply air temperature sensor — making the sensor read low for six weeks until we centered it in the supply air flow. We had to discard the measurements for that six week period. So there are three different groups of valid activation cycle observations for the upstairs pump as shown below:
Measurements of upstairs pump in three different maintenance states
| Undercharged | Apparently charged, but suspected | After final repair | |
|---|---|---|---|
| Date range | 11-7-23 to 12-6-23 | 12-7-23 to 12-29-23 | 2-13-24 to 3-14-24 |
| Cycle sequence range | #1-31 | #32-61 | #125-156 |
| Actual average COP | 2.8 | 2.7 | 2.6 |
| Deviation from expected COP* | -0.22 | 0.04 | 0.0 |
| Average cycle duration | 355.1 | 182.9 | 169.9 |
| Average temperature split** | 17 | 29.5 | 29.3 |
| Average outdoor temp*** | 40.8 | 38.1 | 36.4 |
**Degrees F temperature difference between air coming out of the air handler (supply) vs air going into the air handler (return)
*** This is average outdoor temp while the pump was activated, not across all hours of the day. The pump did not activate on every day.
From the table above, the following observations appear as to the undercharged period:
- The deviation of the actual COP from the temperature-adjusted expected COP was material and in the expected direction.
- The pump ran much longer and produced much cooler air during the period.
In other words, the refrigerant deficit in the upstairs pump during the first period reduced both its heating capacity and its heating efficiency.
Comparison to previous results
Last winter we estimated heat pump performance using a different method. We estimated heating load for the winter based on a regression analysis comparing monthly gas consumption to monthly heating degree days for five previous heating seasons for which we had good monthly data. Our final version of that model was a robust best-fit regression tested across a range heating degree bases. We then divided the load estimated by that model by the actual power consumption of our heat pumps to get a COP estimate for the 2022-2023 season. We reran that model for the months of November through February for the 2023-4 season.
Comparison of heating load estimates for 2023-4 season* (MMBTU)
| Regression Model (HDD49) | Direct Metering** | |
|---|---|---|
| Downstairs unit | 10.7 | 6.7 |
| Upstairs unit | 4.3 | 8.4** |
| Whole structure, both units | 15.0 | 15.1** |
**For the 44 days of 12-30-23 through 2-12-24, we were missing supply air measurements for the upstairs pump, so we estimated total production based on the average COP for the rest of the period (using the compressor load only in the denominator); this slightly inflates the production estimate because the average outdoor temperature during pump activations in the missing data period was 30.6 degrees, somewhat below the rest of the winter (see previous chart). Without adjustment for this inflation, the upstairs MMBTU estimate is 9.0 and the total 15.7. A crude adjustment for this inflation was made as follows: from the scatter chart results, the impact on COP of the temperature difference is approximately 20% (at roughly 39 vs 31F), but this applies to only 1/3 of the season, so the bottom-line difference is approximately 7% and this reduces the upstairs estimate from 9.0 MMBTU to 8.4.
The heating season load estimates by the two completely different methods are essentially identical when combined for the whole structure. The combined number is the most meaningful number because there is no thermal break between the two units. It does appear, as we observed previously, that there has been a substantial reallocation of load between the two units. The downstairs unit is not fully occupied now and we keep it cooler. During the baseline period for the regression model the lower unit was fully occupied by my parents who were home all day and kept it warm and that warmth rose to supply heat to the upper unit. An additional factor possibly raising the load on the upstairs unit is that while we had gas heat, the upstairs unit was zoned — separate thermostats for the second and third floors, both served by the same burner. In our heat pump configuration there is only one thermostat for the upstairs unit and it is located on the second floor. As a result it may be that we are keeping the lightly occupied third floor warmer than in the baseline period, but we do not have data to evaluate this.
Coefficients of performance are computed by dividing heating load/production estimates by electric power use. Electric power use can be divided into compressor power use and fan power use and also classified as either while heating or while on standby (or while cooling, but we did no summer measurements). Fan standby power may include the deliberate use of the fan for non-heating air circulation. For our two pumps in the past winter these power categories broke down as follows:
Kilowatt hours of heating system power use by category 2023-4 season
| Downstairs Pump | Upstairs Pump | Combined | |
|---|---|---|---|
| (1) Fan standby | 1* | 108** | 109 |
| (2) Compressor standby | 128 | 106 | 234 |
| (3) Fan active heating | 28 | 51 | 79 |
| (4) Compressor active heating | 749 | 964 | 1713 |
| 2022-3 COP denominator method for 2023-4 (2) + (4) | 877 | 1070 | 1947 |
| 2023-4 COP denominator method for 2023-4 (3) + (4) | 777 | 1015 | 1792 |
| Denominator computation difference | 100 | 55 | 155 |
The denominator of the standard computation of coefficient of performance includes both fan and compressor power use, but only during active heating, not standby. This denominator represents the total power used to actually heat the home and is the denominator we used for computing COPs for the 2023-4 winter. To the extent the system is using power on standby (and the compressor circuit which apparently includes the web connected thermostat does draw about 50 watts on standby), this is arguably not power used to heat the home but either power wasted because the pump is not being fully utilized or power used for amenities like web connection.
In the 2022-3 winter, we were initially focused on the elements that changed as we converted to gas and therefore (a) included both standby and active power for the compressor and (b) excluded fan use. We continued that approach in our computations of coefficient of performance which therefore overstated power consumption for COP purposes by the excess of compressor standby power use over active fan power use. We don’t have the power category breakdown for 2022-3, but for 2023-4, using the 2022-3 approach would have raised the denominator by 155 kwh or approximately 8%. In other words, we can estimate that our 2022-3 COP estimate of 1.65 for both then-leaking heat pumps combined was slightly understated and should be raised by roughly 8% to 1.8.
Disclaimer
The almost exact match between the results of two completely different methodologies for estimating heating load is tidy, but should be taken as coincidental. It’s just good news that they come out in the same ballpark.
The regression from historical baseline is blind to many factors that materially affect heating load, including:
- Changes in thermostat settings.
- Reductions in the occupancy of the units which reduce internal heat gains — less human warmth, cooking, clothes drying, etc.
- Changes in ventilation settings — both units have energy recovery ventilators which increase heating load if they run more.
- Deterioration of the building envelope, especially door and window seals, which might increase actual load.
Conversely, the direct measurement approach to estimating load is subject to one major uncertainty: As explained in our discussion of measurement methodology, all air flow measurements are approximate. Errors in air flow estimates are reflected proportionally in COP estimates. We think our air flow estimates for the downstairs system are accurate. While we did many alternative measurements for that system and have confidence in where we ended up, some level of error remains possible. The numbers are softer (likely within plus or minus 20%) for the upstairs system which was not amenable to the same attempts at precision. It is, however, persuasive that the COP curves are similar for both systems and not too far below the rated values.
Closing Thoughts
When I first published poor performance results for last winter, some readers questioned the finding. Those questions pushed me to look harder and to improve the methodology — moving from a simple comparison of two winters to a more sophisticated regression model. Once I had a more robust model, it didn’t actually change the findings much — the simple model was roughly valid. However, the further analysis helped me realize how much the combined performance was diminished by a refrigerant leak in the downstairs pump. At that point, we were only aware of a leak in the downstairs pump, but further maintenance last fall showed that both pumps had leaks. It is not surprising that the combined efficiency of both leaky pumps came in below 2.0 in the 2022-3 winter.
Our direct performance metering over the past winter shows that, with leaks fixed, our pumps can perform at their rated level in warmer weather and not too far below their rated level in colder weather, resulting in a COP of 2.55 for the well-measured downstairs pump over the mild winter. However, our work this winter also lends confirmation to the methodology from the prior winter and underlines the toll that a refrigerant leak can take on heat pump performance.
We have given a lot of attention in previous posts to the question of the financial and environmental cost-effectiveness of heat pumps. The improved results this winter do not alter the previous conclusions that our particular heat pump investment (a) will not payoff financially; (b) is a lifetime environmental net negative due to repeated leaks of refrigerants that are potent greenhouse gases.
A few observations on pump sizing: One commenter on last winter’s measurements suggested that the upstairs pump was performing especially poorly because it was over-sized. In truth, it carries more load than the downstairs pump. Apart from refrigerant leakage, the upstairs pump looked worse than it was because the regression model wasn’t giving it credit for the shift in load from downstairs to upstairs. Both pumps are oversized in the sense that a much smaller pump would be sufficient to keep up in almost every condition: On the ten coldest days, neither pump ran for more than a few hours. However, neither pump is short-cycling due to size — our night setback combined with good insulation means that the pumps do most of their work over a few hours first thing in the morning and either sit idle for the rest of the day or do a one additional activation in the afternoon. The average number of activations per observed day was under 1.5 for both pumps (including all cycles).
Resources
- Leak-influenced findings for 2022-3 winter
- This year’s performance measurement methods explained
- Last year’s regression model updated (spreadsheet)
- Performance result spreadsheets for 2023-4
- Downstairs results (simplified computations)
- Upstairs results (simplified computations)
- All results and complete computations (some of this very large spreadsheet cannot be manipulated without purchasing and installing a license for the excel version of the ASHRAE Library of Psychrometric, Thermodynamic, and Transport Properties for Real Humid Air, Steam, Water, and Ice, I-P and SI Units.)
- Updated environmental impact pro forma
- Collection of efficiency findings in population studies
Thank you for underaking this careful research!
this is incredibly helpful stuff. Am working on a paper on the relative efficiency and net emissions for heatpumps considering their electricity use impacts the grid and your reference data came up. Is there any data source on their economic impact other than Eversource/ National Grid (which you cite in your blog)? I know Mass DPU found they would increase operating costs somewhat vs a gas furnace but can’t find that reference. It would be helpful if there were a source of analysis for this that did not have a vested interest.
I’m deeply impressed you have time for this in addition to your day job (which I’m not mentioning what it is here, but it was good to meet you at an event along with Mike Barrett)
Feel free to reach out by email and set up a zoom if you’d like to talk through sources on the economic impact analysis.
There seems to be a fair bit of scatter in the efficiency results. Is it possible that different humidity conditions are partly responsible? Especially below 50F, the presence of humidity causes icing on the heat exchanger outside, then resistive heating is needed to burn it off, resulting in a substantial efficiency loss
There are definitely some defrost cycles within the activation cycles reported. Not sure on relationship with humidity. Note that the outliers <1.5 COP are all short cycles -- basically noise, so short and rare that they have no impact on weighted average performance over time.