
Introduction
This post details our approach to measuring the performance of the two heat pumps in our two-family home in the current heating season. Originally posted in late December 2023, it was last updated on March 20, 2024.
I remain very interested from a policy perspective in the question of real world heat pump performance — the efficiency of heat pumps in using electric energy to deliver heat to the interior of homes. Heat pumps are the heart of the Commonwealth’s strategy for reducing carbon emissions from buildings, but the net carbon reductions attributable to heat pumps are very sensitive to their actual performance — the range of real world outcomes from individual heat pump installations includes net cost increases and even net increases in green house gas emissions. To better understand the factors driving heat pump performance, I am a continuing a case study of the two heat pumps installed in our home.
Last season, I did a series of analyses attempting to derive heat pump performance estimates by comparing our energy use before and after heat pump installation. Ultimately, I found that analysis inconclusive because (a) the before and after comparisons were complicated by too many unknowns; (b) our heat pumps’ performance was depressed for at least some of the season by refrigerant leaks.
We are hoping to get a more definitive set of measurements in the current season by directly metering the performance of our heat pumps. Comments, suggestions, critiques appreciated. For details of our particular heat pump configuration, see this page.
Directly metering heat pump performance
Measurement concepts
Heat pump efficiency is the ratio of heat pumped in to the home to electrical energy used to pump the heat.
It is straightforward to measure the kilowatt hours of electrical energy used to pump the heat — this just requires a meter on the circuits feeding power to the heat pumps. It is more complicated to quantify the heat pumped into the home in BTUs per hour. Measuring heat flow requires putting several real-time measurements together:
- TR — Air temperature going into the heat pump air handler from the house interior (“return air”)
- TS — Air temperature going out of the air handler to the house interior (“supply air”)
- FCFM — Air flow through the heat pump in cubic feet per minute
These quantities are combined according to the following formula which yields the approximate heat transfer rate in British Thermal Units of energy per hour.
dH = 0.2417 * (TS - TR) * FCFM * .0753 * 60;
(note that the right hand side simplifies to 1.092 * (TS - TR) * FCFM )
Breaking this formula down, on the left hand side, we have dH — expressed in BTUs per hour. This is the heat transfer rate that we are trying to compute.
On the right hand side we have the product of the following terms:
0.2417 -- the specific heat capacity of moderately moist air (65F at 50% relative humidity) measured in Btu/lb-oF. The amount of energy required to raise the temperature of one pound of that moist air by one degree Fahrenheit.TS - TR -- the measured difference in supply and return temperatures in degrees FahrenheitFCFM -- the measured air flow through the heat pump measured in cubic feet per minute.0753 -- density of air at sea level(65F at 50% relative humidity)in pounds per cubic foot. .0753 * FCFM is the pounds of air moving through the air handler in each minute.60 -- minutes per hour
This approximate formula makes two simplifications about moisture:
- We use a single term for specific heat for moist air, combining the specific heat of dry air and the specific heat of the water vapor in it — using .2417, the specific heat of 65F air at 50% relative humidity (computed using the ASHRAE Library of Psychrometric, Thermodynamic, and Transport Properties for Real Humid Air, Steam, Water, and Ice, I-P and SI Units). Our return air temperatures run in the 60 to 70 F range and our average return relative humidity runs in the 40s. The specific heats do not vary much in this range (or along the declining humidity curve as the air warms across the heat pump). See also ASHRAE fundamentals hand book chapter on Psychrometrics Table 2. Although the specific heat capacity of water vapor is a greater than the specific heat of air (.44 as opposed .24), the moisture content of air in the home is only about 1% by mass even at high relative humidity.
- We omit a term reflecting the evaporation energy of the water vapor in the air. This is a significant term, but does not change as air is heated through the heat pump without adding moisture. If instead of measuring energy gain in heating, we were measuring energy loss in cooling, water would be condensing out and we could not ignore the energy yielded by the condensation process.
Additionally, we are assuming standard sea level air pressure and ignoring variations in barometric pressure and moisture that affect the density of the moist air entering the heat pump. We are located only 28 meters above sea level. In 2023, barometric pressure at sea level in East Boston varied from 28.9 to 30.6 (the high and low both occurred in December), in other words as +/- 3% versus standard pressure.
With the ASHRAE Library of Psychrometric, Thermodynamic, and Transport Properties for Real Humid Air, Steam, Water, and Ice, I-P and SI Units), we were able to do computations without the simplifying assumptions above. Using actual minute-by-minute air density and specific heat (based on humidity monitoring and barometer readings) does not materially alter the results of the computations. However precise we are able to get with the temperature, humidity, and pressure measurements, our numbers will always suffer from much larger error and uncertainty due to the air flow measurements as discussed below.
Measurement instruments
Power, temperature and humidity — off-the-shelf meters
Devices to measure and record power, temperature, and humidity are widely available.
- We use an Emporia Vue energy monitor to directly measure the minute-by-minute power use of our heat pumps and other appliances. The Emporia Vue energy monitor is an inexpensive little box that installs within an electrical panel. It comes with clamps to attach around each circuit coming out of the panel. These clamps are plugged into the energy monitoring box which transmits real time power measurement on each circuit through the local wireless network to a website from which we can read a second-by-second log of kilowatts of power on each circuit.
- We are using Hobo MX2302A data loggers to measure and log temperature and humidity for return and supply air. These are industry-standard, good-quality monitors. We also used much cheaper Govee sensors for rougher measurements of temperature and humidity at various other points. (While our simplified formula above does not require humidity measurements, our monitors do capture humidity and we could use it later for cooling efficiency measurements and/or for slightly more precise heat transfer estimates.)
The HOBO monitors haven’t given us reason to doubt their accuracy, except for one humidity meter which clearly failed (stuck at 100%). However, a recent repair episode taught us that placement within the air flow can mean a difference in readings, even among locations close to the air handler outlet within the supply duct. As the table below details, the temperature of the air flow after the repair varied by over 15 degrees across points within 18″ of each other.
Temperature readings before and after air handler coil replacement and reinstallation
| Temperature sensor location | Sensor reported temp (F) at peak operation |
|---|---|
| Before repair, HOBO MX 2302A sensor located at side of supply duct 3″ from air handler outlet. | Up to 115 |
| After repair, same sensor located in same place. | Up to 96 (a Testo 425 probe inserted to same point yielded same or lower temperatures) |
| In same operational cycle as it showed low 90s, same sensor moved downstream approximately 3′ and centered in the flow | Up to 111 |
| In same operational cycle, additional HOBO sensor placed approximately 1′ from air handler outlet at side of supply duct | Up to 106 |
| In same operational cycle, straight probe (Testo 425) 3 inches away from air handler outlet but centered in outlet | Up to 112.3 (but showed readings at south edge below 96, consistent with other sensor) |
| In same operational cycle, multiple probes placed in a vent approximately 8 feet downstream for comparison | 104 to 107 — 106.7, HOBO MX 2302A; 107.2 Testo 405; 107.4, Testo 425; 104.2, SensorPush. |
This episode cost us six weeks of data from the upstairs unit — initially we believed that the low temperature readings after the repair indicated that the repair had degraded the operation of the pump and we were content to observe the operation of a degraded pump for a few weeks. After a few weeks we called for a service visit which revealed that the pump was actually generating lots of heat, suggesting that the sensor was defective and reading low. We then bought a brand new MX2302A sensor and it agreed with the old one to two decimal points as to temperature. We finally figured out that the heat pump was more or less fine and that the sensor was accurate and that the issue was sensor placement.
The episode was alarming as it raised the possibility of inaccuracy of our downstairs temperature readings — the downstairs supply temperature probe was placed close to the edge of the air handler outlet just as the upstairs probe was initially. However, (a) we had a lot of additional temperature readings downstairs as a result of the duct traverses discussed below and those readings were consistent with the temperatures reported by the edge-placed supply temperature probe; (b) the readings from the edge-placed upstairs probe had been credible prior to the repair. The upstairs repair was a full replacement of the air handler coil which the technician believed was leaking refrigerant. The technician had trouble removing the old coil. After several hours of exasperating struggle, he removed the whole air handler and took it back to the shop. We much later learned that in the repair and reinstallation of the coil, the technician had failed to replace one of the two filters that span the return duct, so air flow on the filterless side was greater — enough to throw off the temperature reading near the edge of the flow but not enough to make much difference in overall temperature of the supply air.
Air flow — duct traverse
Air flow is a hard quantity to measure. There is no available instrument that would work in our duct system to give us real-time flow measurement. So, we have to do careful measurements of a typical operating state and assume that that operating state remains stable. Our power and other measurements do give us comfort as to the stability of the system operations.
Even for a particular operating state, it is more or less impossible to measure air flow with precision better than ten percent in the field. We could have saved a lot of time and wouldn’t have been too far off if we had just assumed that the air handler was functioning as rated, but we wanted to learn as much as possible and take nothing for granted. We were guided by the ASHRAE Standard 111-2024 (most recent version), Measurement, Testing, Adjusting, and Balancing of Building HVAC Systems which provides guidelines and recommendations for instruments and procedures used in field air flow measurement.
Our heat pump air handlers blow air through ducts (as opposed to from standalone wall units). The standard method of measurement for flow in ducts is the “duct traverse”. ASHRAE states that:
The duct traverse . . . is the only accepted method for field-testing the flow rate performance of fans.
ASHRAE Standard 111-2024, Section 5.7.6
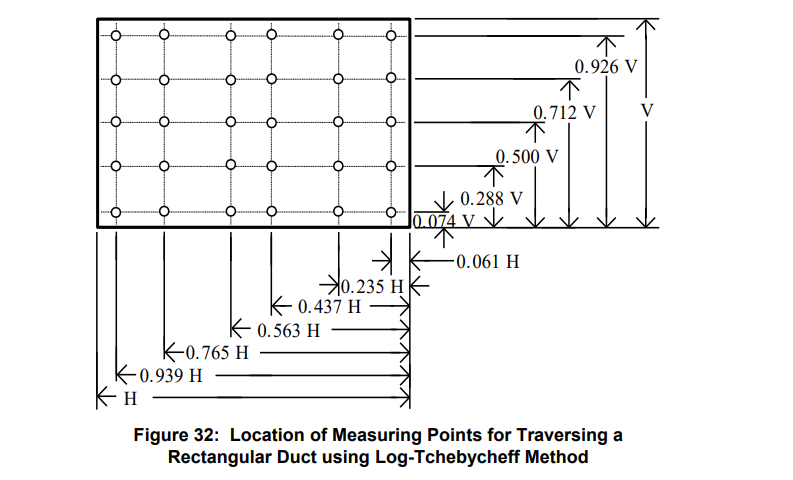
To set up a duct traverse, one drills a row of holes (perpendicular to the direction of air flow) in an accessible surface of the duct. One then inserts a probe to specified depths to measure flow velocity at multiple points in a matrix designed so that the average of the measured flow velocities will accurately represent flow in the duct.
We conducted duct traverses using two different types of air flow probes and compared measurements:
- A Testo 425 hot wire anemometer — this probe measures flow velocity based on the rate at which a hot wire is cooled by the flow. (We tested calibration of the 425 by comparison to a similar hotwire probe, a Testo 405i. Results were near the same, provided that both probes were allowed to warm up to full temperature when used in hot air vents. These two probes did diverge as to temperature at room temperatures with the 425 reading six degrees higher and the 405 being closer to other instruments.)
- An Alnor EBT731 manometer with a Pitot tube, an L-shaped probe that measures air flow velocity by comparing the air pressure on an opening pointed directly into the flow with the air pressure on openings on the side of the probe looking perpendicular to the flow. The flow-facing opening measures “total pressure” while the perpendicular openings measure “static pressure.” The difference is “velocity pressure,” from which flow rate can be computed based on standard assumptions (or additional measurements) as to air density.
ASHRAE 111 prefers the Pitot Tube:
A pitot-static tube, when used with a manometer, is a most reliable and rugged instrument. Its use as a direct measurement tool is preferred over many other methods for the field measurement of air velocity, system total air, outdoor air, return air quantities, fan static pressure, fan total pressure, and fan outlet velocity pressures where such measured quantities may be required within the range or capabilities of the instrument.
ASHRAE 111, 4.5.1(c)
However, even the Pitot Tube used by the best technicians in the best conditions has errors of 5% to 10% and often errors are greater.
Rigorous error analysis shows that flow rate determinations by the pitot-static tube and manometer combination method range from 5% to 10% error. Qualified technicians can obtain measurements that range between 5% and 10% accuracy of actual flow under good field conditions. Suitable traverse conditions do not always exist, and measurements can then exceed a ±10% due to measured uncertainties.
ASHRAE 111, 4.5.3
In our case, we got very similar results from both instruments. However:
- We found that the hotwire anemometer reads the same velocity whether forwards or backward and still measures partial positive velocities when its opening is oriented perpendicular to the flow (instead of along the flow as prescribed).
- The Pitot tube is more sensitive to direction and will show negative velocities if oriented perpendicular to the flow (the static pressure openings become exposed to velocity pressure) and zero velocities if away from the flow.
From these properties, one would expect that the hot-wire measurement would generally be above the Pitot measurement to the extent flow is turbulent and this was true in about 80% of our point measurements. The exceptions were almost all along the edges where the Pitot tube, which is more bulky than the anemometer, may have been constricting flow and creating an accelerated flow along its axis which may have reduced the static pressure component of its measurement through a Bernoulli effect (so exaggerating the computed velocity pressure).
To meet ASHRAE reliability standards (ASHRAE 111, Section 5.7.6), at least 75% of the point flow measurements from a duct traverse must exceed 1/10 of the maximum point flow measured and none should be zero or less. Our pitot-tube traverses did meet readily meet these accuracy standards. None of the point measurements in any of our main duct traverses was under 25% of the maximum point for the traverse. Our results were repeatable: We repeated pitot-tube traverses of each of our main two duct branches three times. For each branch, all three results were within 3% of each the average of the three results.
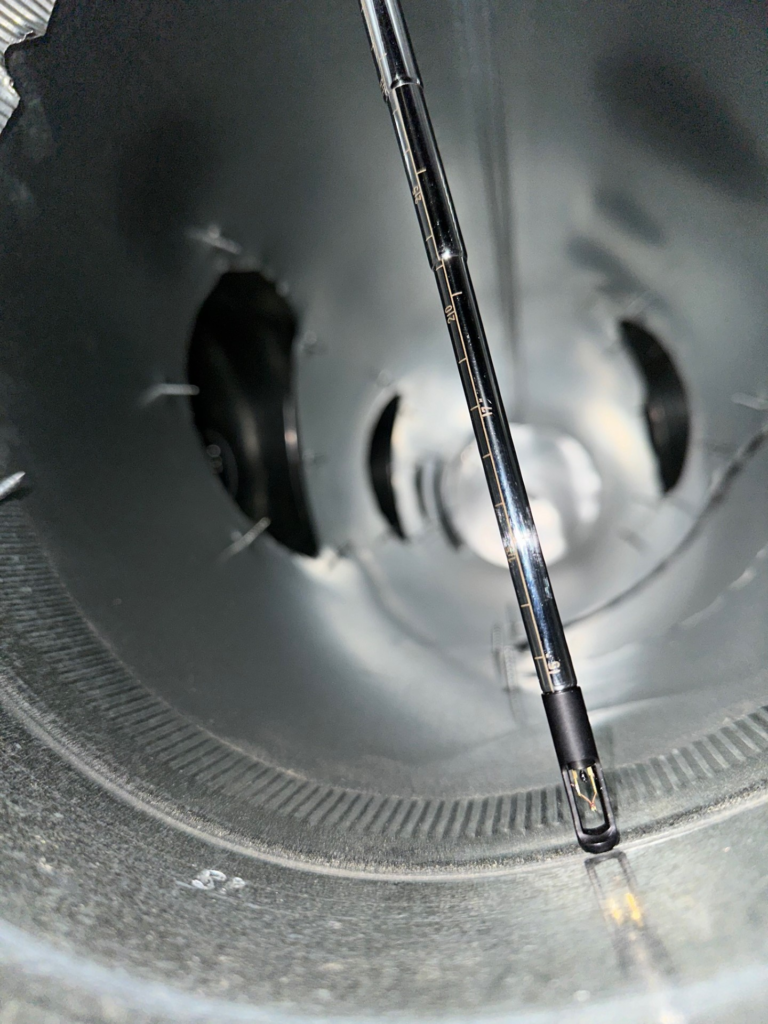
The image below shows the hot wire anemometer probe resting inside one of the cylindrical upstairs ducts — as if measuring the flow at a point along the far wall of the duct. (The downstairs ducts, which we could not photograph from the inside, are rectangular.)
Air flow — additional measurements
We used three additional instruments to test the relative volumes of flow across different ducts in the system.
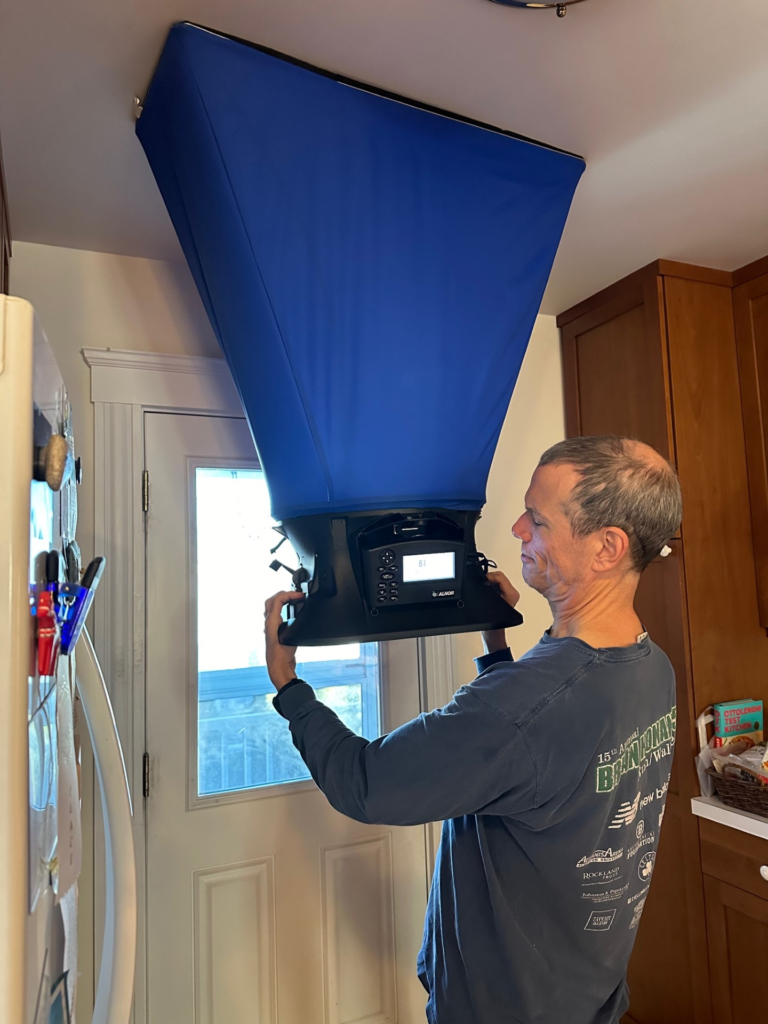
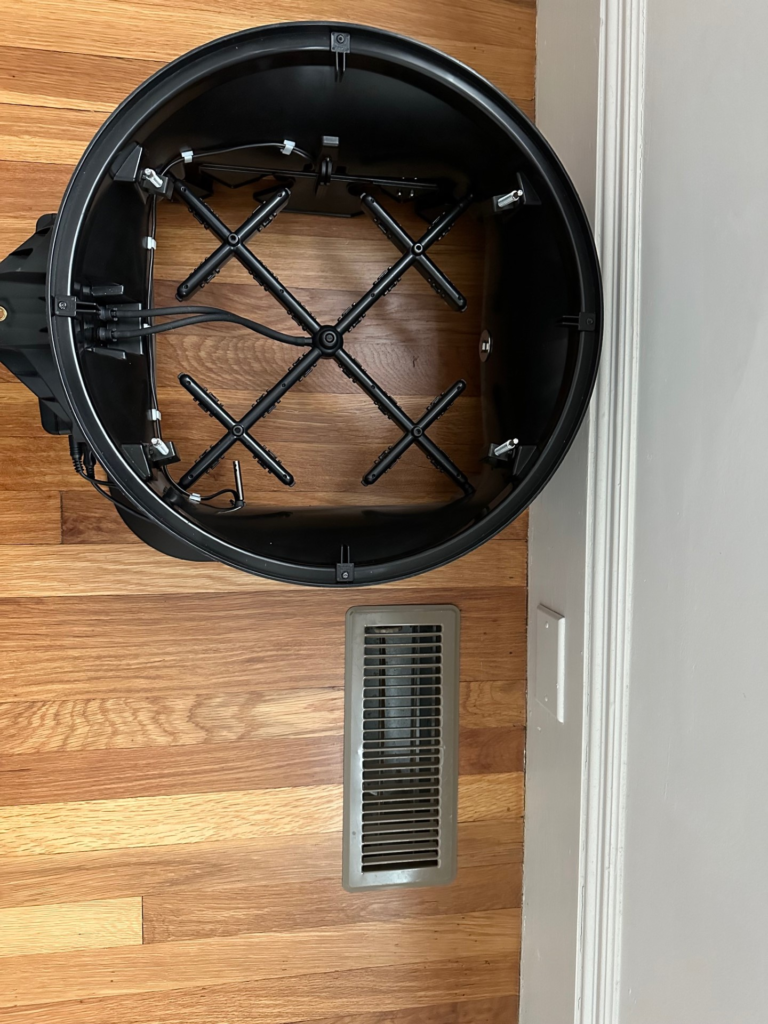
- Alnor EBT731 manometer with a capture hood attached — functioning as a balometer. The EBT731 is the same manometer we used with the Pitot tube for duct traversal, but it becomes a “balometer” — a duct flow balancing tool — when mated with (a) a large capture hood for placing over duct outlets (b) a plastic grid of tubing at the mouth of the capture hood which functions like Pitot tube, but has multiple holes pointing in the direction of the flow to capture velocity pressure at multiple points. When activated, the instrument samples pressure for five or 10 seconds than produces a flow estimate. Note: We measured flow without the “backpressure” correction in the EBT731 balometer because we were measuring very low flows, never over 150 cfm and mostly under 100 cfm. The physical dimensions of the ducts were much less than the smallest opening of the balometer and were further obstructed by grills. The balometer measurement grid is relatively sparse — see image further below. So, the balometer hood did not materially constrain the flow from the vents and should not generate material back pressure.
- Alnor 6200 low flow balometer. The Alnor 6200 functions on the same principles as the EBT731, but is designed to be more sensitive and have higher accuracy with flows under 500 cfm. It has two pressure sampling grids positioned in a longer housing. None of our vents had flows over 150cfm so this was likely a more accurate tool than the EBT731 for our purposes.
- Testo 417 rotating vane anemometer. This just a light-weight fan that spins up and reads a velocity when positioned in an air flow. It is fairly accurate as to the flow rate it indicates, but our vents are fed by ducts coming in at different angles so the flow comes out in different angles and patterns. Additionally, we had no “k factor” data for the grills — no definition of the effective area of the vent covered by the grill. It was not possible to to derive more than the roughest relative flow values from the instrument.
The two Alnor balometers are both very high quality instruments but the manuals for both recommend additional calibration using a duct traverse. ASHRAE 111 makes the same recommendation in section 5.7.9.b. These recommendations are especially applicable in our context — low flows with vent diffusers that are much smaller than the capture device and so can be positioned to create different turbulent flows within the balometer hood. These turbulent flows impact the measurement grid unevenly and distort measurements. Nonetheless, the balometers offered ballpark flow estimates and defined a consistent proportionality of relative flows across the various vents. As will be seen, the total flow measurements (summing across ducts) from the two balometers bracketed the duct traverse measurements.
Air flow and power measurement
Mathematically, the rate that energy is transferred by the fan to the air moving through it is proportionate to the total fan pressure and the flow rate through the fan. Total fan pressure is measured as the difference in total pressure (static plus velocity pressure) measured at the outlet and the inlet to the fan. This suggests the possibility of making inferences about flow levels from the power being delivered to the fan and the total fan pressure. We could estimate total fan pressure by measuring the difference in static pressure only, assuming that flow velocity was the same on both sides of the fan, and we also had power measurement on the air handler. However, attempts to back into a flow estimate from these variables yields poor results because of three confounding variables.
- Small motor efficiency is much less than 100% — the electric power sent to the motor is not fully converted to mechanical rotational power for the fan. Our fan motor is under 1/2 horsepower in peak output; compare this collection of larger, more efficient motor ratings from DOE (Attachment C).
- Small fan efficiency is much less than 100% — the mechanical power used by the fan is not fully converted into forward motion of air through the fan: Some of it is lost to noise, vibration, and heat. See, for example, this fan manufacturer literature rating its very large fans as having peak total efficiencies below 65%, with efficiency dropping at lower output and smaller fans being generally less efficient. Our air handler fan handles 1% or 2% of the load handled by these large fans. The fan in our handler is a Sirocco design. See this study of Sirocco fans showing peak efficiency at 60% or less.
- The air handler consists of a fan and a heat exchanger which looks like an automotive radiator, a coil of pipes running through fins. The air coming off the air handler fan has to flow through that and so loses energy and pressure before it exits the air handler, confounding any direct application of fan mathematics to measurements external to the air handler.
Because these variables are unknown and significant, a direct estimate of flow from fan power consumption is not possible. There is no way around doing the direct flow measurements above. Note that efficiency is especially low and uncertain for both motors and fans when output is below peak. In our case, the air handler motor is rated to 350 watts (286 watts at peak rated ampacity), but we only run at 94 watts, so efficiency is especially low and uncertain. Since motor and fan efficiency both vary with flow levels, one cannot even infer flow changes from power changes; this is confirmed by flow measurements at non-typical fan power levels reported below.
To be clear, fan and fan motor efficiency are minor variables in the computation of heat pump performance. While at peak output the fan is using 94 watts, the compressor (in our case) is using 2000 watts. The air handler fan might be more efficient if it were sized smaller to match our medium-pressure ducts, but it makes sense for a heat pump manufacturer to use a larger fan that can accommodate a range of duct pressures.
A note about terms we found confusing: “Fan static pressure” is not equivalent to the difference in static pressure across the fan. See the blog posts by Mat Ansari referred to under Resources below for a helpful clarification. Further “external static pressure” as a rating variable for air handlers is not at all comparable to “fan static pressure” as used in efficiency measurement; it is, however, useful for sizing the air handler to match pressure and flow for a known duct system.
Flow measurement results
The chart below shows the results of measurements described above. We conducted measurements repeatedly and the chart below presents averages. The detailed measurement results are attached.
Total Downstairs Air Handler CFM — Alternative Measurements
| Measurement Method | CFM Estimate |
|---|---|
| Hot wire anemometer traverses of two main supply ducts* | 593 |
| Pitot tube traverses of two main supply ducts* | 545 |
| Measurements of flow totaled across supply vents** | 479 to 719 |
| Rated flow of air handler per its manual*** | 635 |
** These include measurements at each of 9 supply vents using (a) the Alnor EBT731 balometer without back pressure correction; (b) the Testo 417 rotating vane anemometer (with no k factor for grills); (c) the Alnor 6200 low flow balometer. These instruments were all uncalibrated to our supply vents so they are of only modest interest as to total flow. However, the measurements are mostly proportional across ducts/vents. Percentage breakdowns, including comparisons of the individual vent flow totals to the supply duct traverses appear in the attachment. Two measurements are reported in the attachment since we made them, but we do not give them weight: (a) The EBT731 balometer with back pressure adjustment is an inappropriate method for our very low flow vents. The flows and vents are too small relative to the balometer opening to generate back pressure and, in fact, the balometer often threw errors in adjustment mode. Backpressure adjustment involves constricting flow with a flap and applying an algorithm to the difference in flows with and without the flap; the errors thrown by the instrument in adjustment mode indicate no difference in flow (or an illogical increase in measured flow) when the flow is constricted. (b) An anemometer traverse of the return duct was done at a place adjacent to a huge double twist and showed high turbulence with widely varying flow rates across cells.
***The air handler is supposed to be calibrated at the time of installation to achieve this air flow. We did a measurement of external static pressure across the air handler which was approximately .4″ of water column — consistent with the primary rated pressure level for the air handler (which can be calibrated to generate static pressure from .2″ to .8″)
We conducted more limited measurements of the upstairs air system. We got balometer totals across vents averaging 577 CFM and we did a return duct traverse that yielded 600 CFM. These results are not persuasive in themselves. There is no good plane for a duct traverse in the upstairs unit; most of the ducts are flexible tubing. But the results are roughly consistent with the downstairs unit which has an identical air handler. The two systems are not, however, perfectly comparable — the downstairs duct system is somewhat smaller and uses hard ducts which offer less air friction than the flexible tubing upstairs; the downstairs air handler also draws 10 watts less than the upstairs air handler.
Summarizing as to flow: Using appropriately round numbers and rounding up so as not to underestimate flow (which could unfairly disfavor the ultimate heat pump performance estimates), we estimate 575CFM as the typical flow in both the upstairs and downstairs units.
The measurements above were taken with each system running in its “typical” operational mode as defined below:
- For the downstairs system, all vents open.
- For the upstairs system, third floor vents closed, all other vents open. Closing vents only cuts flow from them by roughly half.
- In both cases, fan set on the highest flow setting. Note that the high fan setting downstairs draws approximately 93-94 watts, while the high setting upstairs draws approximately 100-101 watts with the ERV off and 103-104 watts with the ERV on. By the balometer method, the increase in total flow with the ERV on upstairs was 4%. By the anemometer method, there was no increase in flow in the duct with the ERV on. Both measurements suggest an ERV increment that is within the noise level of our flow measurements and we do not attempt to correct for it. There was no consistent connection between ERV and flow levels in the downstairs unit; this is unsurprising as there is no duct connection between the ERV and the air handler downstairs.
In addition to the extensive measurement of the typical operational mode at its maximum power, for the downstairs units we caught moments of start up where the fan runs at two lower power stages (38 and 60 watts as opposed to typical 94 watts). The flow at these lower stages correlated closely with the square root of pressure, as fan laws would predict. However, in the lower power stages, the CFM is not reduced by the cube-root of the power reduction, as fan laws would predict, but by roughly the square-root of power — a larger reduction consistent with a decline in fan and motor efficiency at low operating levels. More detailed results from these alternative states are reported in the data attached (“Final Flow” spreadsheet, Flow vs Watts tab).
Estimating real time flow from typical flow measurements
Our instruments allow us to measure flow for a typical static operational mode of our heating system defined by which ducts are open and by the “high” fan setting. For testing purposes this winter, we are endeavoring to maintain that typical operational mode. The chart below is a histogram of the fan power readings aggregated by minute for the upstairs unit over 17000 minutes of non-zero power draw. Almost all of the values cluster around 100 watts and a few are clustered around 66 watts and a very few at 40 watts — these lower wattage periods occur mostly during start up and during defrost cycles. As noted above, we have actual flow measurements for those lower wattage periods. For efficiency measurement purposes, we will estimate CFM based on the typical full power mode adjusted by the square of any power reduction as suggested by the measurements above.
Histogram of upstairs air handler operating power (17,000 minutes excluding zero values)
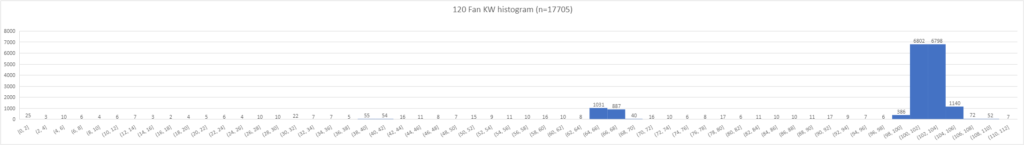
Note that the operating power of the Daikin air handler fan does not vary dynamically to maintain flow across varying duct conditions — we confirmed this by blocking ducts and seeing overall CFM across all ducts drop. See the “118 Compiled Balometer” tab of the early measurement spreadsheet. Rather, operating power for the fan is configured at the time of unit installation through a partially automated process designed to yield normal flow rates at the intended 635CFM given the duct pressures found within the system at the time of installation. See fan manual at page 15 of the installation section, pdf page 243 and also pdf page 106.
Conclusion
We have in place a measurement framework that will reduce the guesswork in our efficiency estimates. No measurement method is perfect, especially measurements of air flow, but we have consistent results from different instruments, so we feel very confident that with the 575CFM level we have the error magnitude below plus or minus 20% and reasonably confident that we are about right. We will report on our direct metering results in the spring.
Resources
- Data/computation downloads
- “Final” flow measurement results
- Early measurement results
- Moist air computations here — most of this spreadsheet cannot be manipulated without purchasing and installing a license for the excel version of the ASHRAE Library of Psychrometric, Thermodynamic, and Transport Properties for Real Humid Air, Steam, Water, and Ice, I-P and SI Units.
- ERV Energy Loss Analysis
- Primary Concept and Data Resources
- ASHRAE Fundamentals Handbook, Chapter on Psychrometrics.
- ASHRAE Library of Psychrometric, Thermodynamic, and Transport Properties for Real Humid Air, Steam, Water, and Ice, I-P and SI Units (excel functions)
- ASHRAE Standard 51-16, Laboratory Methods of Testing Fans for Certified Aerodynamic Performance Rating
- NASA Standard Atmosphere, 1976
- National Institute of Standards Unit Conversions
- ASHRAE Standard 111-2024 (most recent version), Measurement, Testing, Adjusting, and Balancing of Building HVAC Systems
- Text Books
- Online: British Columbia Campus Press, Introduction to Engineering Thermodynamics, Claire Yu Yan
- Online: University of Texas, Austin
- Hard copy: Chemistry, Structure and Properties, Nivaldo Tro, Chapter 10 on Thermochemistry
- Additional Resources
- Alnor/TSI Product Documentation and Manuals (include methodological advice)
- Barometer readings for Boston
- Daikin heat pump engineering manual
- Engineering Tool Box (a first-glance source for many data items and formulae)
I’m happy to see you have ERVs, when I was collecting quotes the installers tried to talk me out of them, but I think they are important for fresh air, even in old buildings. Since then I’ve bought a CO2 monitor and the level of CO2 easily exceeds 1000ppm in an occupied closed room, again even with horsehair plaster and no plastic house wrap.