
Energy Savings Before Mass Save — five post series
The two simple findings of this post are: (1) on average in Massachusetts homes, thermostat settings are much lower now than they were in the 1970s and (2) these lower settings reduce Massachusetts space heating energy consumption by approximately 25%.
This post is the fourth in a series of posts exploring why residential fossil energy use in Massachusetts declined so dramatically even before the Green Communities Act of 2008 launched intensive energy efficiency efforts. How much did consumer behavior change contribute to the decline? We’ve already concluded that thermostat settings must have explained much of the sudden drop in home energy consumption from 1978 to 1981. We’ve also noted that home energy consumption rebounded after 1981, suggesting at least partial reversal of behavior changes as energy prices dropped. Here we dive deeper on the issue of historical thermostat settings.
The sections of this post are as follows:
- Thermostat Settings in the Early 1970s
- Thermostat Settings since 1981
- Massachusetts settings as against regional and national settings
- Impact of thermostat settings on heating energy use
- Putting the pieces together
- Conclusions
- Resources
Thermostat Settings in the Early 1970s
Several kinds of evidence indicate that typical 24-hour-average home temperature settings in the years before the successive energy crises of the 1970s were probably well over 70 degrees, perhaps as high as 75 degrees, in Massachusetts and in most of the country. This section reviews the available evidence.
Advice to consumers in the 1960s and 1970s
Newspapers and pamphlets and public officials urged temperature settings in the lower 70s, often explicitly acknowledging that common settings were in the mid to high 70s.
- Bernard Gladstone, a Sunday New York Times home improvement columnist, took an interest in thermostats and urged temperatures be moved to the low 70s with a night set back:
- Article under the heading “Thermostats Save Fuel and Improve Comfort” includes recommendation of temperature of 70 to 72 in the day and a 5 degree setback at night. New York Times (February 28, 1960, page 435)
- Benefits of insulation: “in some houses thermostats are always being pushed up to 75 degrees or higher, while in others everyone is comfortable with a setting of 70–72 degrees.” New York Times, December 6, 1970, page 214.
- “Lower thermostats about four or five degrees each night, and turn them down the same amount when leaving for 12 hours or more. Settings of 70 to 72 for the day time, and 66 to 68 for the night, are recommended for a properly insulated and weather-stripped home.” New York Times, December 13, 1970, page 164.
- Another Sunday New York Times columnist suggested cutting from 75 to 70: “Heating authorities say that the homeowner should experiment on a particularly cold day to find the lowest indoor temperature at which the home is comfortable. If the thermostat has been kept at 75 degrees, it may be found that a setting of 70 degrees isn’t too cool.” New York Times, Dec. 13 1970, p324.
- Similar pre-embargo fuel shortage advice from Standard Oil: “Keep thermostat at steady 70 degrees which is less costly than 75.” New York Times, January 1973, p 46.
- “If you are now setting your thermostat at 76 or 80°F consider lowering the setting to 72 or 70 or 68°F and wearing more clothing.” Technical Options For Energy Conservation In Buildings, July 1973.
- A Citizens Action Guide to Energy Conservation in 1974 advocated cutting home thermostat settings down from 75 to 67.5 at night and 70 in the day.
- “We must ask everyone to lower the thermostat in your home by at least 6 degrees so that we can achieve a national daytime average of 68 degrees. Incidentally, my doctor tells me that in a temperature of 66 to 68 degrees, you are really more healthy than when it is 75 to 78.” President Nixon Speech, November 7, 1973. Same target set in President’s Message to Congress recorded in legislative history of Energy Reorganization Act of 1974. Same target endorsed by Mayor Lindsay.
The 1973 Lifestyles and Energy Survey
The Energy Policy Project of the Ford Foundation funded what may have been the first national household survey of energy use patterns. The project surveyed homes in May and June in 1973 — before the oil embargo, but after the shortages of the previous winter. The survey selected a geographically and demographically representative national sample of 2,224 households and succeeded in interviewing 1,455 or 65 percent of them. The survey report includes the following relevant table:
Indoor Temperature Control and Preference in Winter by Heating Degree Days, 1973 (percent of households)
| Winter indoor temperature characteristics | All Households | <3500 HDD | 3500-5499 HDD | 5500+HDD |
| All households | 100 | 100 | 100 | 100 |
| With thermostat or valve | 81 | 70 | 86 | 87 |
| Temperature during daya | ||||
| Under 70 | 12 | 12 | 14 | 10 |
| 70-72 | 52 | 51 | 51 | 56 |
| 73 or higher | 33 | 34 | 33 | 33 |
| Don’t know | 2 | 4 | 2 | 2 |
| Temperature at nighta | ||||
| Under 70 | 45 | 51 | 49 | 38 |
| 70-72 | 35 | 30 | 33 | 41 |
| 73 or higher | 16 | 13 | 15 | 19 |
| Don’t know | 4 | 7 | 3 | 2 |
Reproduction of Table 3-14 on page 48 in American energy consumer, Dorothy K. Newman and Dawn Day, Ballenger, 1975. Heating Degree Day grouping are based on 30-year averages from 1931 to 1960 with 65 degrees as base (see page 59 for map and page 252 for discussion). The “night” question refers to “when people are asleep” (page 207).
A few observations about this table:
- In the coldest region, in the last column, a strong majority of homeowners have temperatures over 70 both day and night.
- Massachusetts lies in the coldest region — heating degree days over 5500 per year.
- The day settings do not vary much by region.
- The night (sleeping) settings are higher in the coldest region.
- Unfortunately, the survey does not report temperature averages.
Additional contemporary findings consistent with temperatures settings above 70 degrees in the 1970s
- “Federal agencies had dropped their winter thermostat settings by four degrees, to a range of 70–72 degrees.” New York Times, October 10, 1973
- “The two primary comfort control components in the characteristic house were the gas-fired furnace and the electrically driven air conditioner. Their functions were to supply the heating and cooling demands of the thermostat set at 75°F and the relative humidity at 40 percent.” Parameters for modeling in Residential Energy Consumption for Single Family Housing, March 1973.
- “An indoor year-round design temperature of 75° was also assumed.” 1971 Model home assumptions for determining the Value of Thermal Insulation in Residential construction.
- Survey of 1000 New York office buildings in 1974/75 found that “Thermostats on the average are maintained at 71 deg F during a typical winter day . . . . This is generally more conservative of energy than pre-embargo practice.” Energy conservation in existing office buildings
- Los Angeles office buildings typically cut thermostat settings from 75 to 70. Rand study cited in Social and Institutional Factors in Energy Conservation. (1976)
- Large majorities in several surveys in the 1970s reported cutting thermostat settings to save energy. SERI, 1979, Public Opinion About Energy Same publication also here. 62% reported some or very much conservation of heat during the winter of 1973-74, Consumer Adaptation to Energy Shortages.
- 1977 Analysis of recent national surveys finds average temperatures of 69-70, down a degree from prior year. Suggests thermostat changes did not make much difference from prior year. Analysis of Residential Fuel Conservation Behavior, 1977.
- Review article in 1983 finds retrospectively “it remains the case that Americans definitely live in colder homes today than they did 10 years ago . . . the decline in indoor temperatures has probably played the major role in reducing average household energy use.” Energy in American Homes, Changes and Prospects, Myers and Schipper (July 1983).
Thermostat Settings since 1981
We know that energy use declined dramatically between 1978 and 1981, but we don’t have data on thermostat settings through this decline. The Energy Information Administration’s Residential Energy Consumption Survey first collected data on indoor temperature settings in its 1981 edition. (Three earlier RECS were administered beginning in 1978 but did not cover indoor temperature.) The temperature questions have remained essentially the same from 1981 to 2020.
The survey temperature settings are self-reported and the survey reports acknowledge the inherent inaccuracy of the data. However, the story the data tell seems fairly clear: First, thermostat settings in the 1980s were much lower than we have concluded that they were in the 1970s. Second, while settings have drifted slightly upwards, they have not returned to the levels before the crisis.
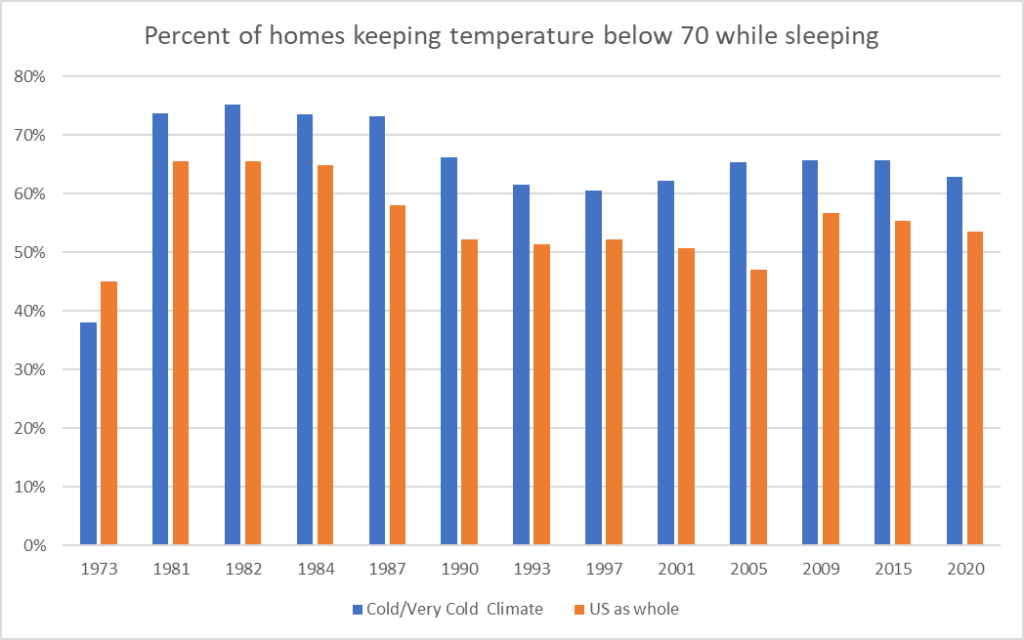
The left-most pair of bars in the chart below repeats the finding from the Lifestyles survey: in 1973, before the crisis, only a minority of people kept their thermostats below 70 while sleeping. The chart below shows further that since at least 1981 and through today, most people are sleeping with thermostats below 70, especially in colder climates like Massachusetts.
Homes reporting temperatures below 70 while sleeping — nationwide and in colder climate areas: 1973 to 2020
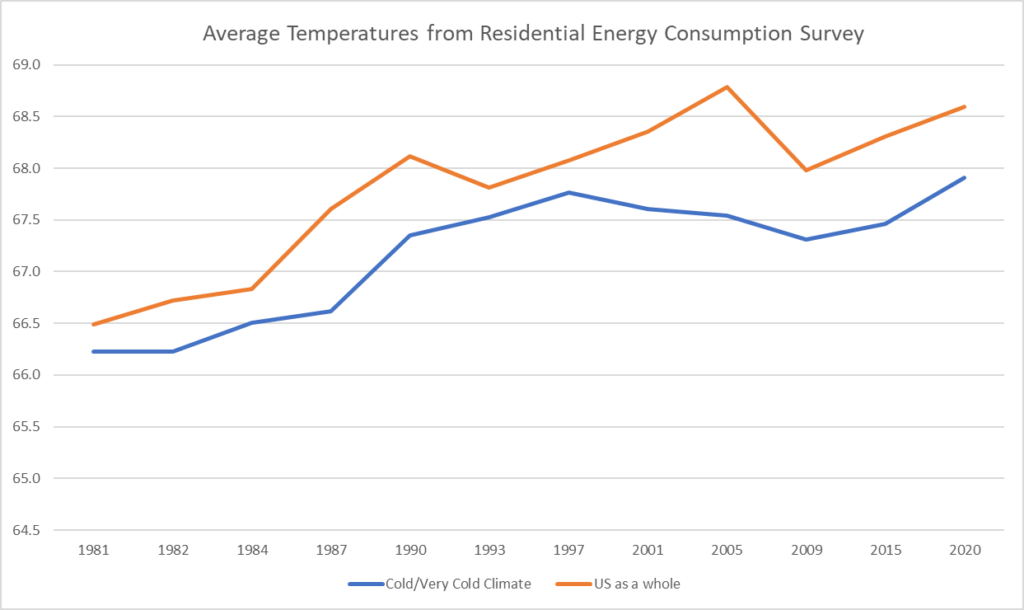
The percentage-below-70 statistic presented above shows a general trend, but cannot be translated into a magnitude of energy savings. The next chart shows rough “average” sleeping temperature settings from the surveys since 1981 — this chart shows an uptrend, but settings remained within a very narrow range from 66.2 to 68.3 degrees
Average* indoor temperatures reported — nationwide and in colder climate areas: Survey years, 1981 to 2020
Massachusetts temperature settings as against regional and national settings
The busy reader can skip to the next section because this section only serves to refine and increase confidence in the temperature findings in other sections. The available survey data discussed above cover the country as a whole or colder climates (which include New England). We have don’t have as many data points for Massachusetts specifically. This section looks closely at how Massachusetts settings relate to national settings.
In short, it appears that:
- Massachusetts settings are very close to the average for New England.
- New England settings run below settings for other cold climate states by a degree or more.
- Cold climate settings run half a degree or so below national settings.
Only the second of these three points is at all surprising.
The chart below collects and compares Massachusetts data points with broader regions for selected years.
Massachusetts and regional average* temperature settings from several studies
| 1981 | 1987 | 2009 | 2020 | |
| Massachusetts from Mass Save Surveys (2008 RASS, 2019 Baseline) | 63.6 | 66.2 | ||
| Massachusetts from RECS 2009 reported temperature bins and 2020 RECS PUMS | 65.9 | 66.5 | ||
| New England from RECS PUMS (/ only oil households for 1987) | 65.8/ 65.6 | 65.9 | 66.7 | |
| New England and >5499 HDD from RECS PUMS | 65.9 | 66.0 | 66.5 | |
| >5499 HDD (cold climates) from RECS Reports (1981) and RECS PUMS | 66.2 | 66.8 | 67.4 | 68.0 |
| US from RECS Reports (1981) and RECS PUMS | 66.5 | 67.7 | 68.0 | 68.6 |
| US Average from Web Connected Thermostat Study (2016?) | 70.0 | |||
| US Cold Climate Average from Web Connected Thermostat Study (2016?) | 69.4 |
Several observations from and about the table above.
- The Mass Save surveys come in a little lower than the RECS. It may be that the RECS is more credible on temperature settings. The Mass Save studies are large samples, but used weak recruitment methods with low response rates (22% for RASS and single-digit for each of three waves of Baseline recruitment). The possibility for some form of self-selection by energy conscious consumers exists in these surveys. By contrast, the 2009 RECS response rate was 79%. The RECS interviews are mostly in-person, in-home interviews as opposed to mail responses.
- The RECS survey average for Massachusetts runs very close to RECS New England as a whole. This makes sense because Massachusetts has average heating degree days close to the average for New England, sits in generally the same energy market, and comprises almost half of all the households in New England anyway.
- The RECS survey data for New England as a whole do not differ much from RECS data for only the colder portions of New England (>5499 HDD). This makes sense because 93% of homes in New England have HDD>5499 (based on 30 year averages, 1981-2010, taken from nearest weather station with base 65 — of course, this varies year to year). Moreover, the average HDD for those homes above 5499 is 6494, not too far different from the average below 5499 of 5401.
- The RECS survey average for New England runs about 1.4 degrees below that for all colder climate states — this relationship holds on average for all survey years from 1987 to 2020 (including years not shown in the chart).
- A large thermostat dataset from web connected thermostats suggests settings above those reported to RECS nationwide.
There is no straightforward method for calculation of standard error terms for the weighted averages presented above (which are built on top of strata weightings provided for each survey record by RECS). However, if the relationships observed above hold, then we can infer that Massachusetts average temperatures were down to a 24 hour average of 64 to 65 degrees in 1981 — about 1.4 degrees or a little more below other colder climate areas, which were averaging 66.2 degrees according to RECS.
Economics of why Massachusetts and New England thermostat settings are lower than in other cold climate states
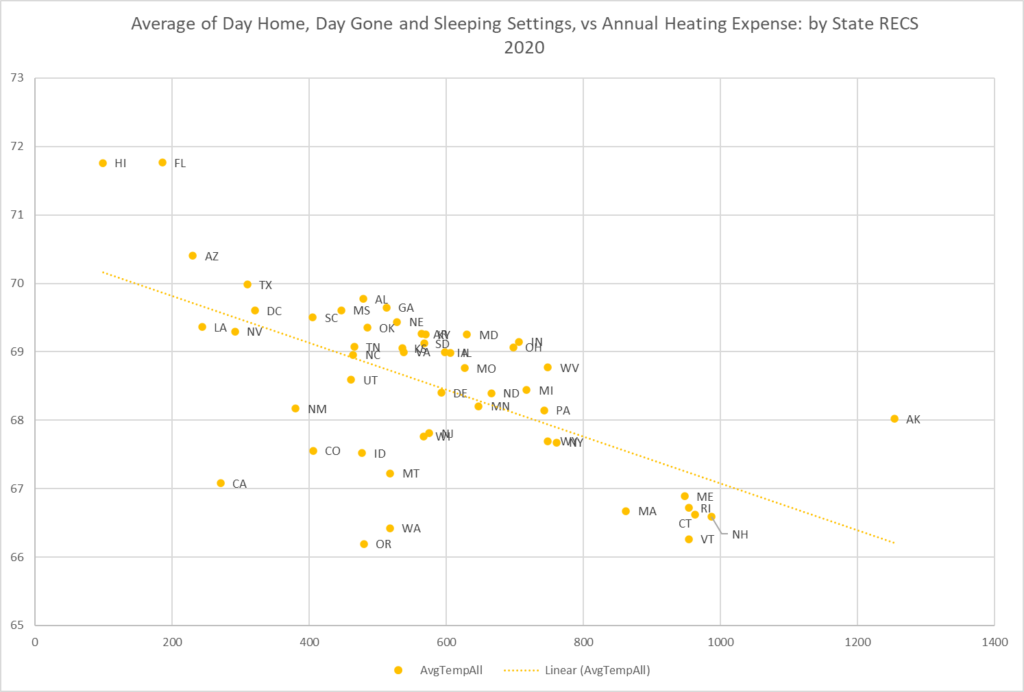
As noted above, Massachusetts and New England thermostat settings generally are below settings in other cold climate states. This makes economic sense because New England heating energy costs are higher than elsewhere. Where heating costs are high, due to a combination of energy prices and climate, people likely turn their thermostats lower. The scatter chart below shows how all the New England states cluster towards the bottom of thermostat settings and towards the top of per home heating costs. The vertical axis in the chart is average thermostat settings; the horizontal access is average annual energy costs. Both variables are derived from the 2020 RECS public use microdata sample.
Average thermostat settings vs average household heating expenses — by state in 2020 from RECS Public Use Micro Sample data
The following chart further explains New England’s relative predicament. New England states appear in the middle-top right area — with modestly above average unit costs for heating energy but considerably higher heating needs. The other cold climate states, mostly in the mid-West, have lower unit costs for heating energy and appear in the lower-right area.
Energy costs ($/MMBTU) vs heating degree days in 2020
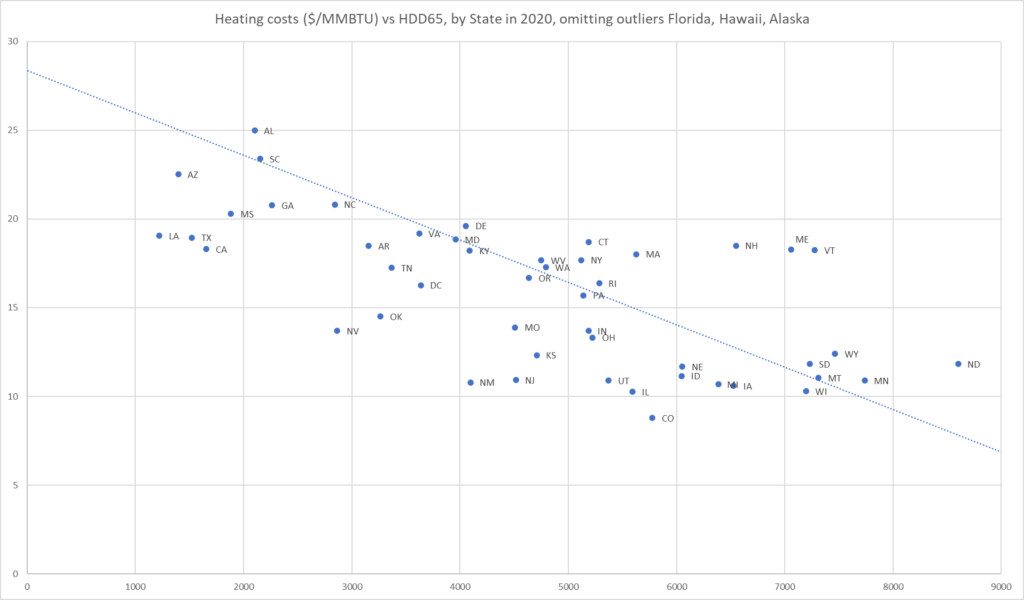
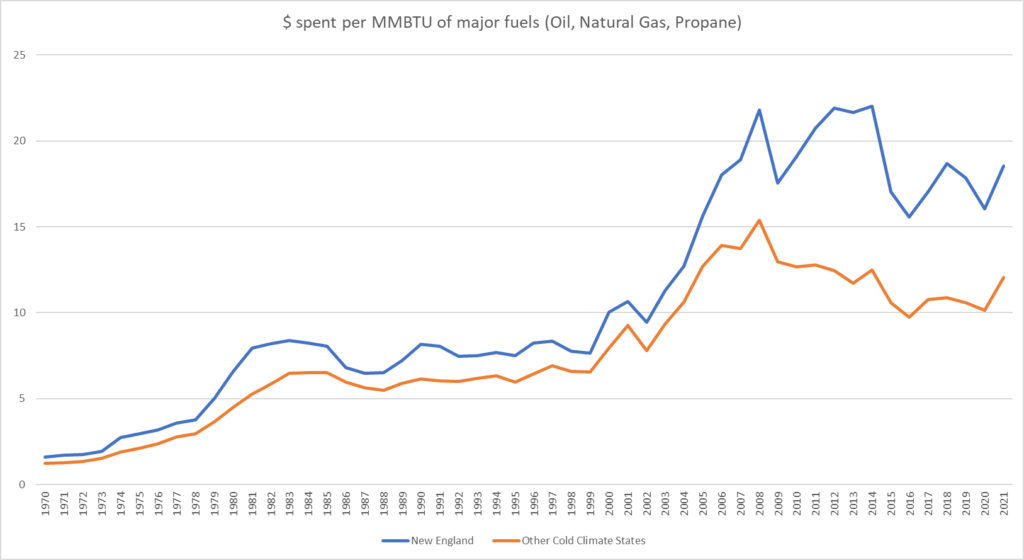
The disparity in energy prices between New England and other colder climate states which appears in these 2020 snapshots has persisted throughout the last 50 years. The disparity derives from (a) consistently lower gas prices in central and western states and (b) heavier reliance on oil in New England — although oil prices do not differ widely across states, oil has become more expensive than gas in New England over the past 15 years. See Climate and Energy Prices Spreadsheet.
Spending per MMBTU for major fossil fuels (oil, natural gas, propane) by the Residential Sector — New England vs other cold climate states: 1970 through 2021.
Impact of thermostat settings on heating energy use
An understanding of how thermostat settings affect heating energy use will help us compare known energy use changes to the thermostat setting changes that we are documenting.
A host of other variables being held equal, home heating energy use varies linearly with the difference between inside and outside temperature. Most homes have some internal sources of heat — stoves, dryers, water heaters, office equipment, entertainment equipment, and the occupants themselves. These “internal gains” cover a portion of the heating load, so that no heating system energy use is necessary to maintain comfort even when outside temperatures are only modestly below the desired indoor temperature. The balance point is the outside temperature below which heating system energy use becomes necessary. Lowering the thermostat lowers the target indoor temperature and lowers the balance point. A balance point of 65 has traditionally been assumed, and, for some homes, that balance point might correspond to a traditional indoor temperature setting of 70 or 75. The better insulated the home and/or the more internal gains in the home, the wider the difference between the balance point and the indoor temperature setting. Seasonal heating use is proportional to the total number of “degree-days” in the season computed from the appropriate balance point. For example with a balance point of 65, one day with an average temperature of 40 generates 25 degree days.
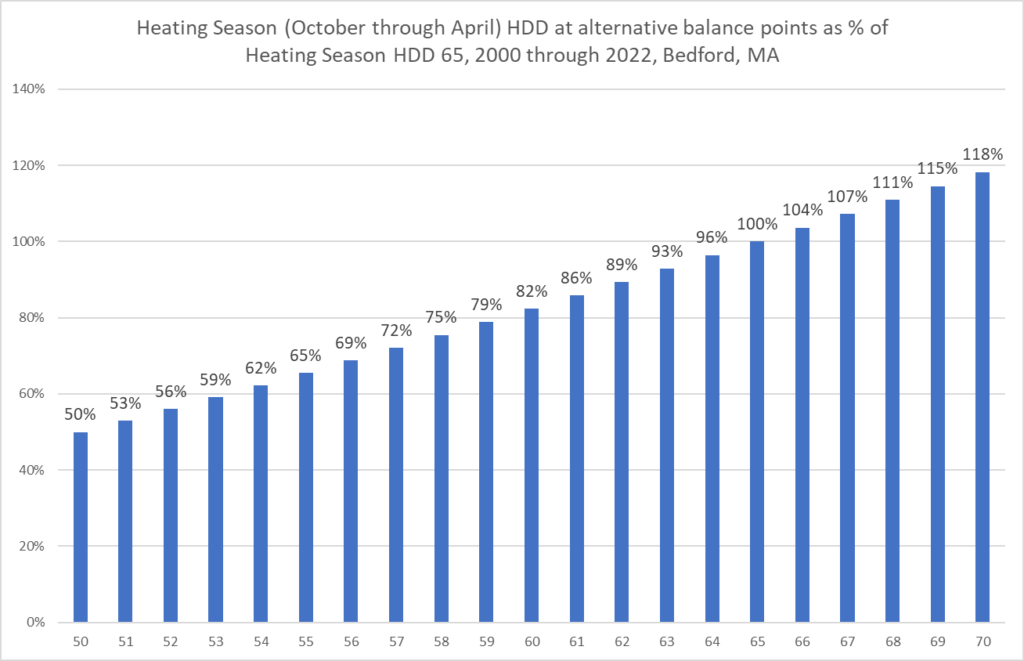
Heating degree days vary from location to location and from season to season. Limiting analysis to the October through April months that comprise the heating season, for balance points below 70, the relationship between balance point and heating degree days is approximately linear, but not exactly linear. (It is not exactly linear because for lower balance points, there will be some days even in the heating season when outside temperature exceeds the balance point and one does not assign negative heating energy use to those days; rather one just assigns zero heating energy use.) The chart below shows how heating degree days vary with balance point using 22 years of weather data for Bedford Massachusetts. For this weather station, a 1 degree temperature setting decrease from HDD65 to HDD64 reduces heating degree days by 3.6%. As one progresses to lower balance points, each degree of change results in a smaller change in heating degree days; going from HDD51 to HDD50 reduces HDD by 3.0% of HDD65.
Heating degrees days for alternative balance points — percentage difference from balance point 65, Bedford Massachusetts, 23 seasons, 2000 through 2022 (April through October)
Electricity can be used for many purposes and space heating accounted for only 10% of electricity consumption in Massachusetts in 2020. However, as the chart below details, space heating does account for roughly 70% of all fossil fuel energy consumed on site in homes, and roughly 80% of oil consumption. If each degree of decrease in balance point results in a 3.0 to 3.6% reduction in heating energy consumption, it results in 2.0 to 2.5% reduction in overall fossil energy use. To the extent homes were less insulated back in 1980, heating may have accounted for a larger of overall energy use then and reductions in temperature setting might have made a modestly greater difference.
Shares of fuel allocated to space heating by fuel; fuel share of space heating (2020 from RECS)
| Natural Gas | Propane | Oil | Electricity | Fossil | |||||
| % used for Space heating | as % of SH | % used for Space heating | as % of SH | % used for Space heating | as % of SH | % used for Space heating | as % of SH | SH as % of Fossil BTU | |
| Mass. | 69% | 56% | 50% | 3% | 78% | 36% | 10% | 5% | 71% |
| New England | 69% | 43% | 58% | 6% | 80% | 46% | 9% | 5% | 73% |
| Northeast | 69% | 63% | 65% | 5% | 78% | 25% | 11% | 7% | 71% |
| US Total | 68% | 72% | 70% | 7% | 80% | 8% | 12% | 14% | 69% |
Putting the pieces together
We have in a previous post concluded that thermostat settings and perhaps other behavioral changes (like shutting off rooms and keeping windows closed) had to account for much of the 51% drop in fuel oil consumption in Massachusetts at the time of the Mideast energy crisis. We are now in a position to refine that statement and characterize the longer term change in Massachusetts thermostat settings
- From the various, pre-1978 sources, it appears most likely that thermostat settings before 1978 averaged somewhere in the low to mid-70s.
- For 1981 through 1984, three surveys put cold climate temperature settings in the 66 to 66.5 range, but Massachusetts was likely below that because we know, that as a consistent pattern, New England temperature settings run below settings in the other cold climate areas.
- From full and consistent survey data, it’s fairly clear that settings in Massachusetts from 1987 through today have drifted slightly upward from roughly 66 to roughly 67.
It appears that after the oil price shock, permanent behavior changes occurred that have made a substantial difference in our energy consumption.
The attached Behavior Change spreadsheet develops a couple of alternative models that attempt to reconcile these findings with known data on energy use from the State Energy Data System. Several points emerge persuasively from these crude models:
- The huge drop in total residential energy consumption leads the models to define a large drop in thermostat settings, on the order of 10 to 15 degrees, between 1978 and 1981. This places thermostat settings in 1978 in the mid-70s degree range, which is consistent with the other data points above. The drop is so large that other hard-to-characterize behavior changes like closing windows and shutting off rooms likely also have played a role.
- Unless one accepts either very high pre-1978 settings (74 or above) or very low 1981 settings (under 60), it’s very hard to explain the large drop in oil consumption. The raw percentage drop in oil consumption is 51% during that period. One likely scenario is that there was a high rate of switching to gas burners — above normal replacement rates. We do have one survey finding from the 1979 RECS (Figure 5) which showed oil to gas conversions at 3 or 4 % annually nationwide. A conversion rate as high as 5% in Massachusetts during the period of the big swing can be fitted with census fuel source data by assuming that the conversions slowed down after 1981. It makes sense that gas homes also turned down thermostats during the crisis because gas prices also rose, although not as much as oil. Reductions in thermostat settings in gas homes likely led to a drop in consumption which masks the conversions (gas energy use actually rose during the 1978 to 1981 years).
- It seems like burner efficiency improvements and behavior (including thermostat settings) can explain most of the long term drop, but making a modest building envelope improvement assumption (0.4% per year) leads to a better long term fit for the data.
This analysis reinforces the conclusion of the previous post that there were big behavior changes from 1978 to 1981. It also reinforces the evidence reviewed at the top of this post that pre-1978 thermostat settings may have averaged as high as 75 degrees.
Conclusions
The discussion above supports the following conclusions about average thermostat settings in Massachusetts:
- Late 1970s — as high as 75 degrees (or perhaps somewhat lower but combined with wasteful behaviors like leaving windows open)
- 1978 to 1981 — plunge to a low point, perhaps as low as 62 degrees (or perhaps higher, but combined with other conservation behaviors).
- 1981 to 1987 — rebound to approximately 66 degrees
- 1987 to 2020 — stability and slight drift upward towards 67 degrees
- The approximately 4 to 8 degree long term reduction may save as much as 26% off our home space heating energy consumption.
Resources
- Spreadsheet of sources and computations for this post.
- Spreadsheet of state energy historical prices and expenditures for economics comparisons
- MS Access Database of public use microsample data from the Residential Energy Consumption Survey
- Related posts
Next or Return to Series Intro or Return to heat pump outline
This seems like a lot of time and money spent for decisions that vary strongly from household to household. My service technicians can attest there is wide variability in temperature from home to home. What’s more important in dropping fuel use is that from the late 70’s on virtually 100% of the heating systems have been replaced with far more efficient units. Some have been replaced twice. Also, hot water generation has moved from tankless coils to indirect fired storage tanks, which reduced the fuel demand for hot water production dramatically. These equipment upgrades combined with thermal barrier upgrades was the biggest driver in reducing demand. Sadly, utilities and environmental warriors have excluded heating oil and propane from the Mass Save program, which means it is more financially challenging for folks to upgrade their equipment. They are not jumping on the heat pump wagon, and even without rebates and financing are replacing their old equipment with new oil equipment – we’re still doing 10-12 heating systems a week. Wouldn’t it make sense to put oil and propane back on Mass Save as cutting 30-40% is better than sticking with older, inefficient equipment, which is what some people are forced to do. All or nothing isn’t cutting it. The folks involved in space heating regulation should take a look at the electric car market – which is now over-saturated and manufacturers are panicking as inventories build as demand dries up.
Thanks, Ken. I agree that thermostat settings do vary a lot even today. The chart below confirms that.
I also agree that burner efficiency improvements have been very helpful.
The point in this post is that average thermostat settings have gone down a lot over time and that is another important contributor to historical shifts in energy consumption.