
This post is intended as a reference document to support the conversation about Boston property tax bills. Overall, Boston residential tax rates are relatively low by statewide standards. However, this year brought two kinds of shifts in relative value. First, the property tax burden shifted somewhat from commercial to residential due to declines in commercial values. Second, due to FY25 being a revaluation year, there were more dramatic shifts among residential properties. Some residential properties show deep tax reductions; some show sharp increases. The shifts among residential properties are dispersed across neighborhoods and residential property types, but the shifts among residential properties do not appear to be wider than in the last revaluation in FY21.
Boston tax rates
Transparency of valuations in Boston
Every conversation about taxes in Boston should start with appreciation for the work that the Boston assessors do. Property tax assessment in Boston is professional, transparent, and motivated by a desire for accuracy. Estimating the individual market values of over 180,000 properties is no small task and requires diligence and expertise. The results cannot be perfect, and market values are perennially debatable, but I personally respect the process and appreciate how much better the process is today than it was 50 years ago.
Fifty years ago, property valuations in Boston and in many other Massachusetts communities were a disaster: Property valuations were decades out of date, wildly inaccurate, apparently political, and even racially biased. Valuations in Roxbury were as much as twice the valuations of comparably valuable homes in South Boston. In the 70s and the 80s, a combination of court decisions, popular referenda, and legislative actions empowered state regulators to compel communities to align their assessed values with true market values. Today, we have a system that preserves local control of the assessment process within a state regulatory framework defined and overseen by the state department of revenue’s division of local services. In general, there is a strong partnership between DLS and local assessors and together they administer a system that is recognized as a model for other jurisdictions to aspire to. For a history of property tax assessment reform in Massachusetts, view Successful Property Tax Reform: The Case of Massachusetts offered by the Lincoln Land Institute (the online course is free, requires about 90 minutes, and can be started immediately upon online registration).
All of the analysis in this post is possible only because we have a transparent property tax system in Massachusetts. Almost all information of interest about property taxes is publicly available at the state’s Municipal Data Bank. Boston does an especially nice job making valuations (and building permit data) for each year available for download at the city’s site. All communities report their valuations to DLS and the state publishes a consolidated map of all valuations online.
Setting the tax rates
The table below summarizes by property class the total values for the over 180,000 properties in the downloaded Boston Assessment Data for years FY24 and FY25. The table shows the overall increase in residential and the overall decrease in commercial which has been widely discussed.
| Class | FY2024 Total Valuation | FY 2025 Total Valuation | %change |
|---|---|---|---|
| Multiple Use | 17,632,903,291 | 18,035,127,142 | 2.3% |
| Residential | 133,275,507,003 | 139,476,934,900 | 4.7% |
| Commercial | 59,381,307,652 | 57,771,098,413 | -2.7% |
| Industrial | 1,403,466,881 | 1,404,912,654 | 0.1% |
| Agricultural* | 670,700 | 641,900 | -4.3% |
| Total | 211,693,855,527 | 216,688,715,009 | 2.4% |
*Treated as commercial in tax rate computations.
Working from these downloaded real property valuations to the actual tax rates and tax bills for FY25 involves the following steps, computations for which are detailed in this spreadsheet. Knowing that these steps can be worked mathematically from the download through to the bills gives confidence in the downloaded data.
- Add in valuations for personal property ($9.7 billion) which are not reflected in the online real estate database to get a final total valuation ($226.4 billion).
- Compute the total tax levy as the maximum tax levy authorized by Proposition 2.5 ($3.359 billion) and adjust it down just a little bit to allow for final tax rates that are exact to the penny ($3.358 billion).
- Compute the overall effective tax rate as the total tax levy divided by the total valuation ($14.83 per $1000)
- Allocate the valuation of multiple use real properties between residential and non-residential (commercial, industrial, personal) — the resulting total valuation split is 68.0% residential and 32.0% non-residential.
- Boost the non-residential tax rate to 175% of the overall tax rate (175% * $14.83 = $25.96) — this is the step which shifts taxes from residential taxpayers to non-residential taxpayers.
- Apply the boosted tax rate to the non-residential valuation to compute the non-residential portion of the levy ($1.878 billion or 55.9%)
- Compute the residential exemption as the simple average value of all properties classified as “Class 1 Residential,” including not only single family and multi-family dwellings, but condo parking spaces, condo storage areas, vacant lots zoned residential, etc. ($344,060). (Although there are some arguably gray areas around tax exempt property and ancillary property in this computation, the official value follows directly from the downloaded data by including all properties with land use codes beginning with “1” and also including the allocated residential value of multiple use properties. See G.L. c. 59, s 5C for the authorization of the residential exemption and G.L. c. 59, s.2A(b) for the definition of “Class 1, Residential.”)
- Back out the exemptions for owner-occupied parcels (77,003) from the residential valuations to compute a net residential valuation for purposes of computing the residential tax rate. The final exact version of this computation reflects that the residential exemption is the lesser of $344,060 and 90% of the value of the property. This cuts the taxable residential valuation from $154.0 billion to $127.8 billion.
- Compute the residential levy as the total tax levy less the boosted non-residential portion of the levy, $1.480 billion or 44.1%.
- Compute the nominal residential tax rate as the residential tax levy divided by the net residential valuation: $11.58 (this rate compares to $9.61, the effective rate that would produce the same levy if there were no residential exemption).
The final rates are summarized in the table below:
Boston tax rates FY24 and FY25
| Boston FY24 | Boston FY25 | |
|---|---|---|
| Residential nominal rate | $10.90 | $11.58 |
| Residential effective rate (residential levy divided by gross residential value, value not reduced by residential exemption) | $9.02 | $9.61 |
| Commercial rate | $25.27 | $25.96 |
| Overall average rate for all property classes (total levy divided by gross value, value not reduced by residential exemption)) | $14.44 | $14.83 |
Effective tax rates with the residential exemption
As noted above, in Boston, for owner occupants, individual property tax bills are reduced by the residential exemption. The exemption amount is $344,060 in FY 2025. The taxable valuation of a property is the full assessed valuation less the exemption (but not less than 10% of the valuation). The tax bill is computed as the nominal tax rate ($11.58) times the taxable valuation. As noted above, the nominal tax rate is increased (from $9.61 in FY25) to preserve the size of the residential levy when the total taxable valuation is reduced by the exemption.
The exemption results in a range of tax rates for different properties from as little as $1.16 per thousand up to $11.58 per thousand. Lower value owner-occupied properties have reduced tax bills and reduced effective tax rates because as much as 90% of their value may be exempt. The solid blue line in the chart below shows the distribution of effective tax rates across all Boston residential properties net of the exemption. The rate tops out at the full nominal $11.58 applicable to the roughly half of properties that are not owner-occupied and not eligible for the exemption.
Boston residential properties arrayed by FY25 effective tax rate net of exemption
(vertical axis is $ per 1000; horizontal access is percentile among residential properties)
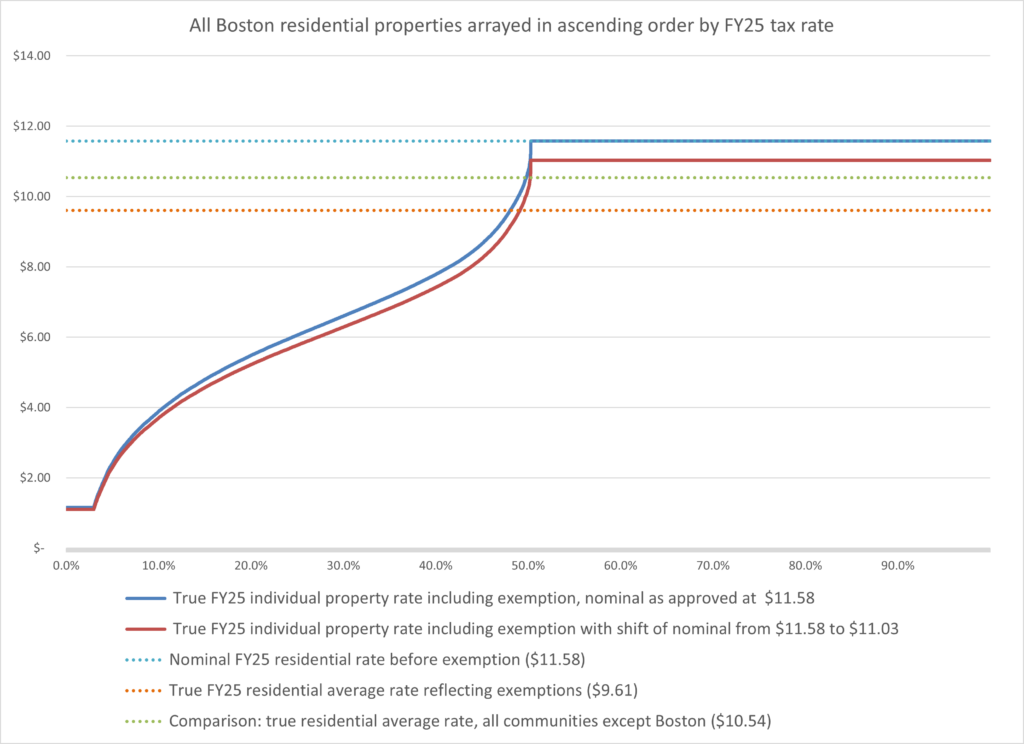
The following observations can be made from the chart above:
- Almost 50% of Boston taxpayers pay less (most of them much less) than the statewide average residential tax rate ($10.54). These are all owner-occupants who benefit from the residential exemption.
- 3% pay only $1.16 per 1,000 (the minimum amount after the exemption).
- A typical owner-occupant pays approximately $6 per $1,000.
- Non-owner-occupants pay the full nominal rate $11.58 per $1,000 which is above the statewide average rate of $10.54.
- The city’s proposed tax shift from residential to commercial would lower all of these rates slightly.
Comparing tax rates
The table below offers several comparisons of tax rates. The table is sorted to put the largest communities at the top, but the reader can select and sort within the table. A few observations about Boston’s 2025 tax rates:
- Boston’s residential tax levy is among the lowest as a percentage of personal income — Boston ranks 332nd out of the 351 Massachusetts communities on that measure. Only 19 communities have lower residential taxes as percent of income. These include some communities which have very high income and a few other communities who, like Boston, are able to shift the residential burden to businesses.
- Boston’s nominal residential tax rate (not reflecting the residential exemption) ranks 216th from the top among the state’s 351 communities.
- Boston’s effective residential tax rate (truly reflecting the residential exemption) ranks 290th from the top.
- Boston’s nominal residential rate is above a majority of the 19 other largest communities, but Boston’s effective rate is below that of a majority of those communities.
- For many Boston homeowners benefiting from the residential exemption, the Fiscal 2025 effective tax rates are among the lowest in the state: as shown above, effective tax rates for Boston homeowners with exemptions are variable but roughly half are below $6 per thousand). Only 15 communities (most of them seasonal communities) have effective tax rates below $6 (although approximately 10 more may have tax rates are similarly low for some of their homeowners because of a residential exemptions).
Tax rate comparisons for Fiscal 2025 among Massachusetts Communities
| Municipality | Population | DOR Income Per Capita | Nominal Residential Rate | Effective Residential Rate | Residential Levy as % of Income | Residential levy per capita |
|---|---|---|---|---|---|---|
| Boston | 650,706 | 76,780 | $11.58 | $9.61 | 2.96% | $ 2,274 |
| Worcester | 205,319 | 25,451 | $13.19 | $13.19 | 4.85% | $ 1,234 |
| Springfield | 154,064 | 19,256 | $15.68 | $15.68 | 5.52% | $ 1,063 |
| Cambridge | 118,488 | 93,288 | $6.35 | $5.29 | 1.92% | $ 1,793 |
| Lowell | 113,608 | 26,787 | $11.48 | $11.48 | 4.65% | $ 1,245 |
| Brockton | 104,826 | 24,698 | $12.11 | $12.11 | 5.21% | $ 1,287 |
| Quincy | 101,727 | 43,000 | $11.53 | $11.53 | 5.38% | $ 2,312 |
| Lynn | 100,891 | 25,320 | $10.36 | $10.36 | 5.38% | $ 1,362 |
| New Bedford | 100,682 | 21,627 | $11.31 | $11.31 | 5.10% | $ 1,103 |
| Fall River | 93,682 | 21,636 | $11.45 | $11.45 | 4.88% | $ 1,056 |
| Lawrence | 87,954 | 20,915 | $8.80 | $8.80 | 3.30% | $ 690 |
| Newton | 87,381 | 239,346 | $9.80 | $9.80 | 1.81% | $ 4,334 |
| Somerville | 79,762 | 59,654 | $10.91 | $8.90 | 3.71% | $ 2,214 |
| Framingham | 70,963 | 47,632 | $11.94 | $11.94 | 4.44% | $ 2,115 |
| Haverhill | 67,153 | 34,981 | $10.71 | $10.71 | 4.54% | $ 1,587 |
| Medford | 65,399 | 47,556 | $8.80 | $8.80 | 3.98% | $ 1,894 |
| Malden | 64,712 | 34,334 | $11.32 | $9.17 | 4.13% | $ 1,417 |
| Plymouth | 64,269 | 48,564 | $12.69 | $12.69 | 6.35% | $ 3,085 |
| Waltham | 64,065 | 50,143 | $9.82 | $7.22 | 2.94% | $ 1,473 |
| Brookline | 62,535 | 129,576 | $9.87 | $8.75 | 3.24% | $ 4,193 |
| Taunton | 59,922 | 30,438 | $10.94 | $10.94 | 4.81% | $ 1,464 |
| Revere | 58,528 | 30,194 | $9.07 | $9.07 | 5.15% | $ 1,556 |
| Weymouth | 57,410 | 44,810 | $10.10 | $10.10 | 4.46% | $ 1,997 |
| Chicopee | 54,980 | 24,527 | $15.16 | $15.16 | 5.22% | $ 1,280 |
| Peabody | 53,896 | 40,322 | $9.26 | $9.26 | 4.27% | $ 1,723 |
| Methuen | 53,241 | 37,061 | $10.58 | $10.58 | 4.55% | $ 1,686 |
| Barnstable | 49,532 | 53,740 | $6.94 | $6.10 | 5.08% | $ 2,732 |
| Everett | 49,350 | 25,543 | $11.39 | $10.07 | 5.43% | $ 1,387 |
| Attleboro | 46,601 | 39,991 | $12.55 | $12.55 | 4.32% | $ 1,729 |
| Arlington | 45,522 | 88,688 | $10.77 | $10.77 | 3.90% | $ 3,459 |
| Salem | 44,722 | 39,587 | $11.34 | $11.34 | 4.99% | $ 1,975 |
| Leominster | 43,646 | 34,695 | $14.03 | $14.03 | 4.93% | $ 1,712 |
| Pittsfield | 43,310 | 31,497 | $17.94 | $17.94 | 5.63% | $ 1,774 |
| Beverly | 42,235 | 62,463 | $10.99 | $10.99 | 3.88% | $ 2,424 |
| Fitchburg | 41,502 | 25,471 | $13.51 | $13.51 | 5.29% | $ 1,347 |
| Billerica | 41,319 | 51,246 | $11.37 | $11.37 | 4.69% | $ 2,403 |
| Woburn | 41,248 | 53,893 | $8.54 | $8.54 | 3.37% | $ 1,819 |
| Marlborough | 40,971 | 42,729 | $9.86 | $9.86 | 3.82% | $ 1,633 |
| Westfield | 40,535 | 34,361 | $15.18 | $15.18 | 4.48% | $ 1,538 |
| Amherst | 40,059 | 23,779 | $17.95 | $17.95 | 6.30% | $ 1,497 |
| Shrewsbury | 39,805 | 72,635 | $12.04 | $12.04 | 3.45% | $ 2,506 |
| Chelsea | 38,637 | 24,704 | $11.51 | $9.75 | 4.54% | $ 1,121 |
| Braintree | 38,567 | 53,799 | $9.98 | $9.98 | 3.96% | $ 2,133 |
| Holyoke | 37,720 | 22,368 | $17.46 | $17.46 | 4.92% | $ 1,101 |
| Andover | 36,363 | 119,706 | $12.49 | $12.47 | 3.11% | $ 3,721 |
| Natick | 36,272 | 80,295 | $11.96 | $11.96 | 4.14% | $ 3,327 |
| Chelmsford | 35,906 | 66,946 | $13.90 | $13.90 | 4.27% | $ 2,860 |
| Watertown | 35,022 | 62,475 | $11.68 | $9.17 | 3.85% | $ 2,407 |
| Randolph | 34,530 | 33,603 | $11.61 | $11.61 | 5.34% | $ 1,794 |
| Lexington | 34,074 | 174,217 | $12.23 | $12.23 | 3.29% | $ 5,735 |
| Franklin | 33,656 | 64,184 | $11.62 | $11.62 | 3.67% | $ 2,353 |
| Dartmouth | 33,406 | 49,314 | $8.26 | $8.26 | 3.62% | $ 1,785 |
| Falmouth | 33,104 | 62,029 | $5.87 | $5.87 | 5.86% | $ 3,632 |
| Needham | 32,114 | 169,870 | $10.60 | $10.60 | 2.72% | $ 4,622 |
| Dracut | 32,060 | 42,616 | $10.12 | $10.12 | 4.06% | $ 1,729 |
| Norwood | 31,317 | 52,847 | $10.52 | $10.52 | 3.75% | $ 1,979 |
| North Andover | 31,295 | 81,207 | $11.26 | $11.26 | 3.09% | $ 2,512 |
| North Attleborough | 30,930 | 55,139 | $11.79 | $11.79 | 3.47% | $ 1,912 |
| Tewksbury | 30,833 | 51,763 | $13.22 | $13.22 | 5.31% | $ 2,747 |
| Wellesley | 30,524 | 334,709 | $10.28 | $10.28 | 1.58% | $ 5,280 |
| Milford | 30,196 | 39,858 | $12.80 | $12.80 | 4.98% | $ 1,984 |
| Gloucester | 29,836 | 58,837 | $9.72 | $9.72 | 5.50% | $ 3,237 |
| Northampton | 29,327 | 45,873 | $13.93 | $13.93 | 4.88% | $ 2,240 |
| Melrose | 29,155 | 67,216 | $9.90 | $9.90 | 3.71% | $ 2,493 |
| Stoughton | 28,969 | 41,746 | $12.38 | $12.38 | 5.13% | $ 2,142 |
| Bridgewater | 28,780 | 41,141 | $11.83 | $11.83 | 4.38% | $ 1,800 |
| Saugus | 28,547 | 44,588 | $10.68 | $10.68 | 5.02% | $ 2,238 |
| West Springfield | 28,501 | 36,399 | $14.87 | $14.87 | 3.99% | $ 1,453 |
| Agawam | 28,393 | 35,689 | $14.64 | $14.64 | 4.92% | $ 1,756 |
| Milton | 28,364 | 100,620 | $11.09 | $11.09 | 3.34% | $ 3,360 |
| Danvers | 27,781 | 60,349 | $10.99 | $10.99 | 3.91% | $ 2,360 |
| Wakefield | 27,069 | 61,962 | $11.35 | $11.28 | 4.57% | $ 2,833 |
| Belmont | 26,710 | 140,907 | $11.39 | $11.39 | 3.33% | $ 4,695 |
| Walpole | 26,277 | 71,933 | $12.83 | $12.83 | 4.31% | $ 3,101 |
| Burlington | 25,966 | 66,067 | $8.66 | $8.66 | 3.22% | $ 2,129 |
| Marshfield | 25,713 | 67,082 | $9.90 | $9.90 | 4.53% | $ 3,039 |
| Yarmouth | 25,244 | 44,804 | $7.08 | $7.08 | 6.41% | $ 2,873 |
| Easton | 25,240 | 65,359 | $12.48 | $12.48 | 3.88% | $ 2,534 |
| Reading | 25,205 | 84,143 | $11.39 | $11.33 | 3.92% | $ 3,299 |
| Dedham | 24,997 | 77,892 | $12.62 | $12.62 | 4.13% | $ 3,217 |
| Canton | 24,609 | 78,194 | $9.89 | $9.89 | 3.11% | $ 2,433 |
| Middleborough | 24,376 | 37,564 | $13.41 | $13.41 | 5.44% | $ 2,042 |
| Westford | 24,353 | 82,731 | $13.47 | $13.47 | 4.29% | $ 3,551 |
| Hingham | 24,130 | 187,681 | $10.69 | $10.69 | 2.28% | $ 4,275 |
| Acton | 23,829 | 92,784 | $17.15 | $17.15 | 4.68% | $ 4,339 |
| Mansfield | 23,816 | 61,467 | $13.17 | $13.17 | 4.01% | $ 2,467 |
| Wareham | 23,151 | 31,782 | $8.55 | $8.55 | 6.05% | $ 1,924 |
| Wilmington | 22,904 | 58,187 | $11.45 | $11.45 | 4.68% | $ 2,721 |
| Stoneham | 22,705 | 59,977 | $10.23 | $10.23 | 4.16% | $ 2,496 |
| Winchester | 22,640 | 175,805 | $11.09 | $11.09 | 3.03% | $ 5,327 |
| Westborough | 21,506 | 80,712 | $16.29 | $16.29 | 4.09% | $ 3,300 |
| Gardner | 20,902 | 25,784 | $14.36 | $14.36 | 5.27% | $ 1,360 |
| Ludlow | 20,871 | 35,908 | $17.35 | $17.35 | 5.79% | $ 2,081 |
| Bourne | 20,667 | 50,375 | $7.81 | $7.81 | 5.34% | $ 2,691 |
| Sandwich | 20,611 | 57,701 | $10.57 | $10.57 | 5.90% | $ 3,407 |
| Marblehead | 20,233 | 130,610 | $9.05 | $9.05 | 3.05% | $ 3,983 |
| Holden | 19,880 | 56,534 | $13.86 | $13.86 | 4.51% | $ 2,550 |
| Grafton | 19,815 | 62,569 | $13.94 | $13.94 | 4.32% | $ 2,703 |
| Hudson | 19,744 | 49,853 | $13.88 | $13.88 | 5.34% | $ 2,661 |
| Hopkinton | 19,249 | 115,194 | $14.18 | $14.16 | 3.58% | $ 4,124 |
| Scituate | 19,190 | 94,999 | $9.99 | $9.99 | 4.35% | $ 4,134 |
| Norton | 19,108 | 47,373 | $12.97 | $12.97 | 4.53% | $ 2,145 |
| Sudbury | 18,965 | 155,522 | $14.64 | $14.59 | 3.36% | $ 5,225 |
| Newburyport | 18,662 | 87,382 | $9.58 | $9.58 | 3.94% | $ 3,439 |
| Winthrop | 18,510 | 45,268 | $10.32 | $10.32 | 4.41% | $ 1,996 |
| Foxborough | 18,488 | 74,729 | $13.22 | $13.22 | 3.44% | $ 2,571 |
| Ashland | 18,466 | 67,924 | $12.77 | $12.77 | 4.26% | $ 2,895 |
| Sharon | 18,408 | 89,747 | $17.48 | $17.48 | 4.96% | $ 4,449 |
| Pembroke | 18,297 | 52,327 | $12.02 | $12.02 | 4.75% | $ 2,485 |
| Somerset | 18,192 | 39,559 | $13.30 | $13.30 | 5.56% | $ 2,199 |
| South Hadley | 18,046 | 38,780 | $13.98 | $13.98 | 4.48% | $ 1,739 |
| Concord | 17,954 | 226,782 | $13.26 | $12.41 | 2.66% | $ 6,040 |
| Greenfield | 17,656 | 27,133 | $19.56 | $19.56 | 6.61% | $ 1,795 |
| Southbridge | 17,619 | 24,588 | $14.66 | $14.66 | 5.20% | $ 1,278 |
| Rockland | 17,609 | 36,166 | $13.67 | $13.67 | 5.95% | $ 2,150 |
| Webster | 17,601 | 35,584 | $11.88 | $11.88 | 4.41% | $ 1,570 |
| Bellingham | 17,407 | 42,868 | $12.56 | $12.56 | 4.90% | $ 2,099 |
| Swansea | 17,307 | 40,531 | $10.98 | $10.98 | 4.97% | $ 2,014 |
| Amesbury | 17,179 | 48,024 | $15.30 | $15.30 | 6.37% | $ 3,061 |
| Abington | 16,965 | 42,780 | $13.06 | $13.06 | 5.34% | $ 2,283 |
| Auburn | 16,762 | 42,242 | $14.29 | $14.29 | 5.09% | $ 2,150 |
| Westport | 16,413 | 56,741 | $7.45 | $7.45 | 3.92% | $ 2,222 |
| East Longmeadow | 16,343 | 52,249 | $18.48 | $18.48 | 5.15% | $ 2,691 |
| Northbridge | 16,337 | 44,990 | $11.79 | $11.79 | 3.94% | $ 1,770 |
| Westwood | 16,231 | 155,744 | $12.80 | $12.80 | 3.09% | $ 4,814 |
| Duxbury | 16,107 | 130,414 | $10.14 | $10.14 | 3.38% | $ 4,413 |
| Easthampton | 16,045 | 36,112 | $13.67 | $13.67 | 5.08% | $ 1,835 |
| Fairhaven | 15,837 | 41,830 | $9.32 | $9.32 | 4.06% | $ 1,696 |
| Northborough | 15,663 | 76,367 | $14.25 | $14.25 | 3.93% | $ 2,999 |
| Seekonk | 15,649 | 48,536 | $12.35 | $12.35 | 4.71% | $ 2,288 |
| Longmeadow | 15,632 | 114,925 | $21.12 | $21.12 | 3.33% | $ 3,824 |
| North Reading | 15,549 | 85,288 | $13.06 | $13.06 | 4.32% | $ 3,688 |
| Clinton | 15,484 | 34,975 | $13.30 | $13.30 | 4.72% | $ 1,650 |
| Raynham | 15,474 | 48,678 | $12.10 | $12.10 | 4.34% | $ 2,111 |
| Mashpee | 15,468 | 57,264 | ||||
| Belchertown | 15,316 | 41,992 | $14.51 | $14.51 | 5.03% | $ 2,113 |
| Swampscott | 15,280 | 93,266 | $11.47 | $11.47 | 3.63% | $ 3,386 |
| Whitman | 15,259 | 38,112 | $13.12 | $13.12 | 5.38% | $ 2,050 |
| Dennis | 14,932 | 54,924 | $4.33 | $4.33 | 6.32% | $ 3,472 |
| Holliston | 14,856 | 80,153 | $14.65 | $14.65 | 4.40% | $ 3,529 |
| Hanover | 14,758 | 74,032 | $12.35 | $12.35 | 4.17% | $ 3,087 |
| Wilbraham | 14,526 | 54,366 | $17.88 | $17.88 | 5.34% | $ 2,905 |
| Nantucket | 14,421 | 104,521 | $3.28 | $3.11 | 7.49% | $ 7,826 |
| Uxbridge | 14,386 | 45,489 | $13.11 | $13.11 | 4.93% | $ 2,241 |
| East Bridgewater | 14,338 | 42,736 | $13.67 | $13.67 | 5.32% | $ 2,276 |
| Bedford | 14,161 | 104,718 | $12.04 | $12.04 | 3.49% | $ 3,653 |
| Millbury | 13,936 | 42,232 | $13.39 | $13.39 | 5.29% | $ 2,235 |
| Ipswich | 13,848 | 81,006 | $11.15 | $11.15 | 4.23% | $ 3,423 |
| Kingston | 13,829 | 52,167 | $12.97 | $12.97 | 5.33% | $ 2,782 |
| Wayland | 13,664 | 227,716 | $15.63 | $15.63 | 2.75% | $ 6,261 |
| Harwich | 13,647 | 54,236 | $5.91 | $5.91 | 7.60% | $ 4,124 |
| Medway | 13,393 | 65,077 | $14.25 | $14.25 | 4.69% | $ 3,051 |
| Charlton | 13,360 | 46,852 | $11.13 | $11.13 | 4.00% | $ 1,876 |
| Oxford | 13,287 | 37,155 | $12.67 | $12.67 | 4.86% | $ 1,804 |
| Medfield | 13,072 | 136,384 | $13.80 | $13.80 | 3.00% | $ 4,094 |
| Rehoboth | 13,023 | 55,533 | $11.15 | $11.15 | 4.19% | $ 2,329 |
| Lynnfield | 12,951 | 107,831 | $10.56 | $10.56 | 3.32% | $ 3,585 |
| North Adams | 12,777 | 19,982 | $16.71 | $16.71 | 5.68% | $ 1,134 |
| Wrentham | 12,457 | 74,021 | $11.59 | $11.59 | 3.67% | $ 2,718 |
| Tyngsborough | 12,368 | 56,004 | $12.34 | $12.34 | 4.39% | $ 2,460 |
| Palmer | 12,337 | 29,777 | $16.48 | $16.48 | 5.65% | $ 1,682 |
| Spencer | 11,911 | 33,700 | $11.74 | $11.74 | 4.60% | $ 1,550 |
| Athol | 11,897 | 25,016 | $12.71 | $12.71 | 5.30% | $ 1,325 |
| Lakeville | 11,895 | 52,768 | $10.35 | $10.35 | 4.24% | $ 2,235 |
| Dudley | 11,850 | 34,084 | $10.57 | $10.57 | 4.13% | $ 1,408 |
| Lunenburg | 11,835 | 48,694 | $14.36 | $14.36 | 5.38% | $ 2,622 |
| Weston | 11,661 | 551,525 | $11.10 | $11.10 | 1.44% | $ 7,935 |
| Carver | 11,626 | 38,190 | $13.87 | $13.87 | 5.84% | $ 2,229 |
| Pepperell | 11,620 | 49,412 | $14.63 | $14.63 | 5.05% | $ 2,495 |
| Norfolk | 11,552 | 74,137 | $15.97 | $15.97 | 4.72% | $ 3,500 |
| Holbrook | 11,285 | 37,374 | $13.18 | $13.18 | 5.72% | $ 2,139 |
| Norwell | 11,280 | 132,335 | $13.07 | $13.07 | 3.28% | $ 4,337 |
| Groton | 11,162 | 87,562 | $15.25 | $15.25 | 4.18% | $ 3,662 |
| Leicester | 11,033 | 38,693 | $11.77 | $11.77 | 4.24% | $ 1,641 |
| Hanson | 10,587 | 46,839 | $13.38 | $13.38 | 5.22% | $ 2,444 |
| Acushnet | 10,585 | 40,392 | $10.79 | $10.79 | 4.54% | $ 1,834 |
| Maynard | 10,546 | 51,469 | $17.83 | $17.83 | 6.64% | $ 3,417 |
| Brewster | 10,444 | 52,538 | $6.88 | $6.88 | 8.29% | $ 4,358 |
| Southborough | 10,409 | 154,628 | $13.81 | $13.81 | 2.73% | $ 4,228 |
| Winchendon | 10,385 | 27,321 | $11.75 | $11.75 | 4.80% | $ 1,312 |
| Ware | 10,385 | 26,488 | $15.06 | $15.06 | 5.60% | $ 1,484 |
| Hull | 10,142 | 59,593 | $11.20 | $11.20 | 6.00% | $ 3,575 |
| Littleton | 10,139 | 75,339 | $14.86 | $14.86 | 4.75% | $ 3,577 |
| Sturbridge | 9,882 | 57,354 | $15.93 | $15.93 | 4.87% | $ 2,795 |
| Plainville | 9,865 | 50,487 | $11.56 | $11.56 | 3.82% | $ 1,929 |
| Middleton | 9,837 | 78,028 | $11.89 | $11.89 | 4.27% | $ 3,333 |
| Sutton | 9,379 | 67,471 | $12.02 | $12.02 | 4.05% | $ 2,733 |
| Rutland | 9,298 | 46,736 | $14.24 | $14.24 | 4.91% | $ 2,293 |
| Freetown | 9,236 | 45,931 | $9.91 | $9.91 | 4.23% | $ 1,943 |
| Blackstone | 9,211 | 38,481 | $15.10 | $15.10 | 5.29% | $ 2,037 |
| Southwick | 9,190 | 47,037 | $15.57 | $15.57 | 5.08% | $ 2,392 |
| Salisbury | 9,189 | 41,812 | $10.08 | $10.08 | 6.14% | $ 2,565 |
| Douglas | 9,153 | 47,942 | $13.17 | $13.17 | 4.70% | $ 2,253 |
| Townsend | 8,948 | 41,852 | $14.52 | $14.52 | 5.36% | $ 2,243 |
| Millis | 8,836 | 59,944 | $16.40 | $16.40 | 6.11% | $ 3,661 |
| Montague | 8,463 | 27,855 | $15.21 | $15.21 | 5.61% | $ 1,563 |
| Ayer | 8,424 | 44,451 | $11.96 | $11.96 | 4.32% | $ 1,919 |
| Georgetown | 8,408 | 62,148 | $11.06 | $11.06 | 4.38% | $ 2,720 |
| Lancaster | 8,394 | 47,134 | $16.16 | $16.16 | 5.30% | $ 2,499 |
| Cohasset | 8,346 | 185,475 | $11.58 | $11.58 | 3.01% | $ 5,582 |
| Westminster | 8,330 | 48,570 | $12.30 | $12.30 | 4.62% | $ 2,242 |
| Templeton | 8,183 | 33,081 | $12.12 | $12.12 | 4.79% | $ 1,585 |
| Dighton | 8,168 | 42,730 | $12.56 | $12.56 | 5.20% | $ 2,221 |
| Sterling | 8,139 | 59,945 | $12.88 | $12.88 | 4.30% | $ 2,578 |
| Upton | 8,128 | 68,878 | $13.15 | $13.15 | 4.33% | $ 2,983 |
| Boxford | 8,112 | 144,840 | $13.45 | $13.45 | 3.06% | $ 4,426 |
| Monson | 8,090 | 37,482 | $14.87 | $14.87 | 5.28% | $ 1,981 |
| Adams | 8,047 | 26,598 | $17.01 | $17.01 | 5.45% | $ 1,449 |
| West Boylston | 7,757 | 45,451 | $13.87 | $13.87 | 5.24% | $ 2,383 |
| Halifax | 7,698 | 41,693 | $14.27 | $14.27 | 5.85% | $ 2,440 |
| Williamstown | 7,663 | 47,254 | $13.80 | $13.80 | 5.12% | $ 2,419 |
| West Bridgewater | 7,625 | 44,799 | $13.67 | $13.67 | 5.32% | $ 2,381 |
| Orange | 7,558 | 24,059 | $16.45 | $16.45 | 6.94% | $ 1,669 |
| Hamilton | 7,526 | 107,398 | $15.65 | $15.65 | 4.26% | $ 4,573 |
| Great Barrington | 7,214 | 58,612 | $13.79 | $13.79 | 5.90% | $ 3,456 |
| Stow | 7,042 | 96,844 | $17.42 | $17.42 | 4.82% | $ 4,671 |
| Rockport | 6,925 | 69,656 | $8.76 | $8.76 | 5.77% | $ 4,021 |
| Harvard | 6,870 | 85,831 | $15.65 | $15.63 | 4.62% | $ 3,964 |
| Lincoln | 6,855 | 208,365 | $12.81 | $12.81 | 2.56% | $ 5,333 |
| Berkley | 6,797 | 47,561 | $12.01 | $12.01 | 4.82% | $ 2,294 |
| Shirley | 6,782 | 39,141 | $12.97 | $12.97 | 4.74% | $ 1,857 |
| Groveland | 6,721 | 51,825 | $12.69 | $12.69 | 5.52% | $ 2,863 |
| Chatham | 6,711 | 95,522 | $3.47 | $3.47 | 6.31% | $ 6,030 |
| Merrimac | 6,699 | 47,736 | $13.25 | $13.25 | 5.68% | $ 2,711 |
| Newbury | 6,695 | 127,380 | $7.45 | $7.45 | 2.32% | $ 2,954 |
| Mattapoisett | 6,589 | 75,605 | $10.76 | $10.76 | 5.54% | $ 4,188 |
| Topsfield | 6,504 | 97,237 | $14.99 | $14.99 | 4.55% | $ 4,426 |
| Orleans | 6,422 | 74,862 | $6.24 | $6.24 | 8.17% | $ 6,117 |
| Ashburnham | 6,372 | 39,549 | $14.87 | $14.87 | 6.58% | $ 2,602 |
| Mendon | 6,286 | 77,459 | $13.39 | $13.39 | 3.80% | $ 2,946 |
| Rowley | 6,283 | 59,762 | $11.77 | $11.77 | 4.87% | $ 2,908 |
| Dalton | 6,236 | 39,672 | $16.47 | $16.47 | 5.49% | $ 2,177 |
| Southampton | 6,207 | 54,934 | $14.17 | $14.17 | 4.23% | $ 2,326 |
| Granby | 6,055 | 41,187 | $15.37 | $15.37 | 5.82% | $ 2,398 |
| Hopedale | 6,008 | 49,114 | $16.61 | $16.61 | 5.59% | $ 2,744 |
| Dover | 5,860 | 361,388 | $11.27 | $11.27 | 1.85% | $ 6,687 |
| Eastham | 5,822 | 50,199 | $7.71 | $7.71 | 12.81% | $ 6,430 |
| Rochester | 5,816 | 52,832 | $10.82 | $10.82 | 4.78% | $ 2,528 |
| Bolton | 5,728 | 99,220 | $16.62 | $16.62 | 4.61% | $ 4,576 |
| Lee | 5,707 | 39,565 | $11.25 | $11.25 | 5.02% | $ 1,988 |
| Barre | 5,533 | 32,869 | $13.59 | $13.59 | 5.15% | $ 1,693 |
| Boxborough | 5,412 | 92,804 | $15.14 | $15.14 | 4.39% | $ 4,079 |
| Oak Bluffs | 5,379 | 35,050 | $5.05 | $4.91 | 15.46% | $ 5,419 |
| Manchester By The Sea | 5,354 | 240,634 | $9.15 | $9.15 | 2.42% | $ 5,828 |
| Marion | 5,291 | 90,361 | $9.32 | $9.32 | 4.69% | $ 4,233 |
| Hadley | 5,270 | 42,487 | $11.63 | $11.63 | 4.71% | $ 2,000 |
| Edgartown | 5,266 | 92,802 | $2.65 | $2.65 | 7.30% | $ 6,772 |
| Deerfield | 5,162 | 54,070 | $13.25 | $13.25 | 3.93% | $ 2,127 |
| Carlisle | 5,157 | 206,865 | $13.18 | $13.18 | 2.92% | $ 6,032 |
| Lenox | 5,064 | 71,325 | $9.05 | $9.05 | 3.87% | $ 2,759 |
| Paxton | 5,024 | 47,691 | $14.74 | $14.74 | 5.13% | $ 2,446 |
| Warren | 4,968 | 23,579 | $14.81 | $14.81 | 6.35% | $ 1,498 |
| Wenham | 4,926 | 108,662 | $15.54 | $15.54 | 3.90% | $ 4,239 |
| Boylston | 4,924 | 78,749 | $13.83 | $13.83 | 4.22% | $ 3,321 |
| Hampden | 4,915 | 53,288 | $15.09 | $15.09 | 4.79% | $ 2,550 |
| Tisbury | 4,886 | 31,005 | $7.57 | $6.93 | 21.91% | $ 6,792 |
| Avon | 4,735 | 45,108 | $13.34 | $13.34 | 4.83% | $ 2,177 |
| North Brookfield | 4,728 | 34,421 | $14.17 | $14.17 | 5.06% | $ 1,742 |
| West Newbury | 4,562 | 94,138 | $10.80 | $10.80 | 3.75% | $ 3,527 |
| Sherborn | 4,372 | 328,012 | $16.58 | $16.58 | 2.07% | $ 6,788 |
| Hubbardston | 4,335 | 44,903 | $11.68 | $11.68 | 4.23% | $ 1,901 |
| Berlin | 4,189 | 60,934 | $14.19 | $14.19 | 4.68% | $ 2,849 |
| West Brookfield | 3,817 | 44,837 | $10.78 | $10.78 | 3.74% | $ 1,675 |
| Provincetown | 3,723 | 103,933 | $5.60 | $5.22 | 6.58% | $ 6,840 |
| Brimfield | 3,690 | 44,744 | $14.14 | $14.14 | 4.97% | $ 2,225 |
| Essex | 3,668 | 126,795 | $12.99 | $12.99 | 3.40% | $ 4,312 |
| Sunderland | 3,647 | 59,903 | $13.02 | $13.02 | 3.14% | $ 1,882 |
| Wellfleet | 3,644 | 54,944 | $7.11 | $6.63 | 13.39% | $ 7,359 |
| West Tisbury | 3,594 | 44,013 | $4.53 | $4.47 | 12.91% | $ 5,684 |
| Princeton | 3,504 | 72,563 | $14.53 | $14.53 | 4.37% | $ 3,168 |
| Brookfield | 3,432 | 34,762 | $15.48 | $15.48 | 5.25% | $ 1,825 |
| Dunstable | 3,355 | 75,690 | $13.75 | $13.75 | 4.44% | $ 3,361 |
| Sheffield | 3,329 | 56,572 | $12.11 | $12.11 | 4.97% | $ 2,812 |
| Hatfield | 3,314 | 43,837 | $13.84 | $13.84 | 5.77% | $ 2,530 |
| Nahant | 3,289 | 85,154 | $9.15 | $9.15 | 4.44% | $ 3,782 |
| Cheshire | 3,215 | 36,195 | $11.13 | $11.13 | 3.91% | $ 1,417 |
| Ashby | 3,163 | 38,265 | $15.23 | $15.23 | 6.31% | $ 2,413 |
| Millville | 3,147 | 38,482 | $13.19 | $13.19 | 4.64% | $ 1,785 |
| Lanesborough | 3,016 | 38,153 | $16.73 | $16.73 | 7.20% | $ 2,748 |
| Plympton | 2,923 | 52,909 | $15.89 | $15.89 | 5.80% | $ 3,067 |
| Northfield | 2,872 | 38,182 | $13.84 | $13.84 | 5.28% | $ 2,014 |
| Hardwick | 2,658 | 28,673 | $13.15 | $13.15 | 5.85% | $ 1,676 |
| Holland | 2,573 | 37,165 | $12.98 | $12.98 | 6.87% | $ 2,555 |
| Truro | 2,486 | 60,222 | $6.18 | $5.73 | 14.00% | $ 8,431 |
| Williamsburg | 2,469 | 32,318 | $18.97 | $18.97 | 8.61% | $ 2,783 |
| East Brookfield | 2,204 | 38,251 | $12.84 | $12.84 | 5.35% | $ 2,046 |
| Bernardston | 2,104 | 37,494 | $14.27 | $14.27 | 5.32% | $ 1,996 |
| Huntington | 2,069 | 36,340 | $15.40 | $15.40 | 5.80% | $ 2,106 |
| Stockbridge | 1,998 | 68,401 | $7.09 | $7.09 | 6.37% | $ 4,357 |
| Becket | 1,931 | 36,209 | $8.76 | $8.76 | 8.69% | $ 3,147 |
| Hinsdale | 1,900 | 45,888 | $11.15 | $11.15 | 4.83% | $ 2,214 |
| Shelburne | 1,886 | 25,360 | $12.84 | $12.84 | 7.37% | $ 1,870 |
| Oakham | 1,866 | 41,435 | $11.55 | $11.55 | 4.56% | $ 1,889 |
| Leverett | 1,860 | 50,504 | $15.18 | $15.18 | 6.05% | $ 3,054 |
| Buckland | 1,810 | 25,403 | $16.94 | $16.94 | 9.58% | $ 2,433 |
| Wales | 1,807 | 28,823 | $14.42 | $14.42 | 7.02% | $ 2,022 |
| Conway | 1,760 | 47,767 | $14.44 | $14.44 | 5.80% | $ 2,769 |
| Shutesbury | 1,726 | 36,879 | $15.83 | $15.83 | 8.36% | $ 3,082 |
| Phillipston | 1,720 | 37,027 | $11.27 | $11.27 | 6.35% | $ 2,351 |
| Ashfield | 1,688 | 48,790 | $13.46 | $13.46 | 5.43% | $ 2,650 |
| Erving | 1,667 | 36,000 | $9.31 | $9.31 | 2.78% | $ 1,001 |
| Clarksburg | 1,643 | 29,474 | $13.58 | $13.58 | 4.49% | $ 1,323 |
| Russell | 1,631 | 37,015 | $18.30 | $18.30 | 5.98% | $ 2,213 |
| Otis | 1,626 | 50,272 | $6.46 | $6.46 | 7.01% | $ 3,526 |
| Whately | 1,623 | 25,928 | $13.34 | $13.34 | 9.33% | $ 2,419 |
| Westhampton | 1,620 | 49,506 | $20.79 | $20.79 | 6.75% | $ 3,341 |
| Colrain | 1,617 | 32,466 | $18.26 | $18.26 | 6.69% | $ 2,172 |
| Gill | 1,560 | 28,162 | $14.66 | $14.66 | 6.18% | $ 1,742 |
| Granville | 1,528 | 41,994 | $13.64 | $13.64 | 5.06% | $ 2,126 |
| New Marlborough | 1,510 | 43,025 | $6.94 | $6.94 | 8.70% | $ 3,742 |
| Richmond | 1,402 | 58,824 | $9.88 | $9.88 | 7.32% | $ 4,306 |
| Egremont | 1,374 | 39,823 | $6.26 | $6.26 | 9.23% | $ 3,677 |
| West Stockbridge | 1,329 | 91,260 | $9.62 | $9.62 | 4.69% | $ 4,281 |
| Pelham | 1,266 | 55,151 | $16.97 | $16.97 | 6.35% | $ 3,504 |
| Royalston | 1,261 | 29,975 | ||||
| Chilmark | 1,235 | 103,896 | ||||
| Chester | 1,220 | 30,530 | $18.06 | $18.06 | 7.79% | $ 2,377 |
| Blandford | 1,210 | 35,998 | $11.71 | $11.71 | 5.98% | $ 2,154 |
| Petersham | 1,183 | 46,952 | $14.49 | $14.49 | 5.87% | $ 2,758 |
| Worthington | 1,183 | 33,292 | $13.79 | $13.79 | 8.77% | $ 2,920 |
| Charlemont | 1,181 | 29,058 | $18.30 | $18.30 | 8.33% | $ 2,422 |
| Chesterfield | 1,175 | 25,075 | $15.52 | $15.52 | 12.40% | $ 3,109 |
| Monterey | 1,085 | 49,509 | $6.44 | $6.44 | 8.34% | $ 4,128 |
| New Salem | 1,008 | 30,227 | $13.58 | $13.58 | 7.82% | $ 2,364 |
| New Braintree | 990 | 46,509 | $14.86 | $14.86 | 5.18% | $ 2,409 |
| Sandisfield | 982 | 29,501 | $9.02 | $9.02 | 9.49% | $ 2,801 |
| Goshen | 947 | 18,585 | $13.99 | $13.99 | 17.06% | $ 3,171 |
| Wendell | 921 | 22,900 | ||||
| Cummington | 818 | 64,869 | $12.76 | $12.76 | 3.80% | $ 2,465 |
| Windsor | 818 | 36,407 | $11.34 | $11.34 | 5.52% | $ 2,008 |
| Montgomery | 818 | 39,782 | $11.34 | $11.34 | 5.42% | $ 2,157 |
| Peru | 803 | 26,340 | $15.95 | $15.95 | 8.82% | $ 2,322 |
| Warwick | 780 | 28,036 | $17.78 | $17.78 | 9.13% | $ 2,559 |
| Hancock | 746 | 21,374 | $2.69 | $2.69 | 4.42% | $ 944 |
| Leyden | 734 | 50,507 | $15.28 | $15.28 | 4.68% | $ 2,365 |
| Heath | 721 | 18,488 | $18.81 | $18.81 | 15.93% | $ 2,945 |
| Florida | 681 | 24,226 | $7.77 | $7.77 | 4.13% | $ 1,001 |
| Savoy | 646 | 33,237 | $16.62 | $16.62 | 6.64% | $ 2,208 |
| Plainfield | 629 | 32,224 | $18.48 | $18.48 | 8.96% | $ 2,888 |
| Washington | 497 | 34,793 | $14.16 | $14.16 | 9.36% | $ 3,258 |
| Alford | 483 | 84,482 | $4.95 | $4.95 | 4.47% | $ 3,772 |
| Tolland | 467 | 32,214 | $7.47 | $7.47 | 11.39% | $ 3,669 |
| Aquinnah | 444 | 65,191 | $6.76 | $6.76 | 22.22% | $ 14,484 |
| Rowe | 421 | 35,473 | $5.14 | $5.14 | 2.40% | $ 850 |
| Tyringham | 421 | 41,074 | ||||
| Middlefield | 388 | 61,059 | $18.24 | $18.24 | 5.93% | $ 3,618 |
| Hawley | 354 | 25,763 | $16.35 | $16.35 | 10.04% | $ 2,587 |
| New Ashford | 249 | 34,807 | $5.66 | $5.66 | 3.67% | $ 1,276 |
| Mount Washington | 157 | 74,433 | $6.08 | $6.08 | 6.11% | $ 4,548 |
| Monroe | 115 | 9,930 | $8.99 | $8.99 | 14.01% | $ 1,392 |
| Gosnold | 64 | 14,063 |
The table above is based on data extracted from the Division of Local Services Municipal Data Bank. This spreadsheet shows the extracted values and computations.
Boston tax rate comparisons to Fiscal 2024
A frequently asked question is: How much did Boston FY 25 tax bills change in general from FY24? There are many different quantitative approaches to this question. Here are five of them:
- The median residential tax bill change (the level such that half of bills went up more and half went up less) was 9.3% (10.5% for owner-occupied single family homes).
- The unweighted average residential tax bill change (the average of the percentage changes for each of the individual tax bills) was 11.6%.
- The weighted average change, that is, the change in the total of the tax bills of all the residential properties was 9.7%.
- The total change in the residential tax levy from the city’s tax recap sheets which was 9.2% (excluding the portion of the levy attributable to new growth in valuation — see levy change tab in this spreadsheet).
- The tax bill for an owner-occupied single family home of average value in FY25 was 9.5% higher than the tax bill for an owner-occupied single family home of average value in FY24.
The five answers involve different comparison sets: For the first three approaches, the comparison set used is the 151,710 “class 1” residential properties that were present in both years, did not change land use, and had non-zero assessed value in both years. This set excludes 2,026 or 1.3% of the “class 1” properties that were on the list in FY2025; it also excludes 2,952 multiple use properties. For the fourth approach, the set is all properties. For the fifth approach the set in each year is all owner-occupied single family homes.
Patterns of change
Commercial property value declines
Before focusing attention on the residential bill variability driven by revaluation, we document the commercial value decline that has been heavily discussed elsewhere: The majority of commercial properties declined in value city wide, but especially in the downtown zip codes (02108 through 02118 and 02215). However, many commercial properties did show increases. The chart below includes all zip codes with commercial properties. (The number of properties in each zip code is shown next to each zip code.)
Percentages of commercial properties experiencing valuation percentage changes with defined ranges, FY24 to FY25 by zip code
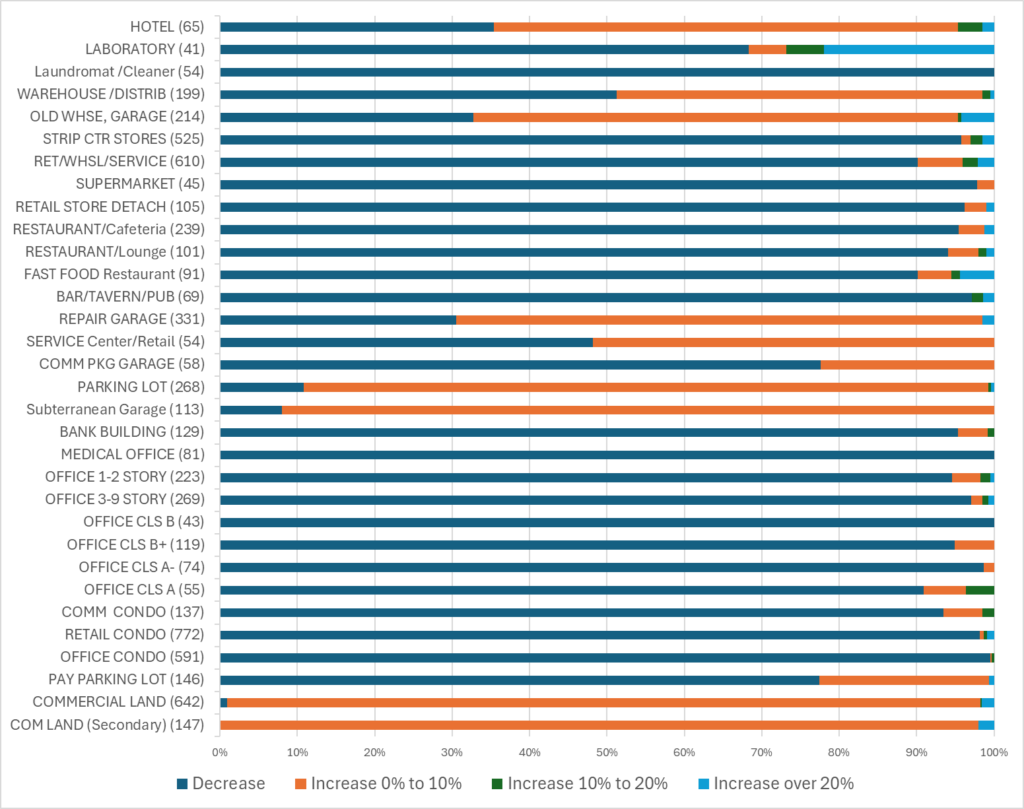
The decline in commercial property values covered most categories of property including all grades of office space. The only categories in which the majority of properties saw increases were hotels, garages, parking lots, and vacant land.
Percentages of commercial properties experiencing valuation percentage changes with defined ranges, FY24 to FY25 by property type (with property counts by type).
Large residential valuation shifts
2025 is a certification or “revaluation” year for Boston and residential values have, in fact, shifted more, both up and down, than in a typical year. By statute and pursuant to department of revenue regulations and DLS guidelines every community in Massachusetts is required to adjust valuations every year based on market trends, but every five years, communities must seek certification from the Division of Local Services that they are assessing properties at full and fair valuation. This certification requires a deeper review and valuations may change more as a result.
The five-year certification review is conducted by BLA staff to ensure the proposed values were derived utilizing a methodology based on generally accepted mass appraisal practices, are supported with current market evidence, and are uniformly and equitably applied to all property. The data quality, all cost and depreciation tables, and land schedules will be reviewed for all real property. In addition, income producing property will be reviewed for income and expense analysis, development of the economic rent schedules, capitalization rates and correlation of the values derived from two appraisal approaches.
Certification Standards, Bureau of Local Assessment Informational Guideline Release 24-13
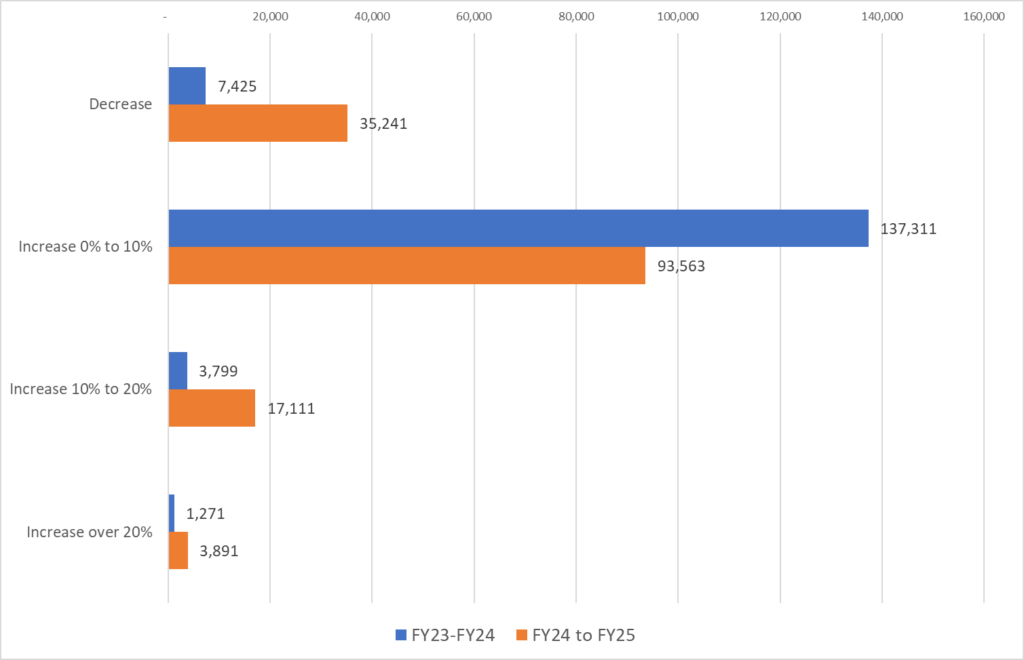
The 2025 Boston revaluation did result in shifts. The chart below compares the number of residential properties experiencing large value changes in FY24 and FY25. In both years, most residential properties experienced valuation changes of 0% to 10%, but in FY25 there were many more properties with changes outside that range: 35,627 (24%) saw their valuations go down and 21,002 (14%) saw their valuations go up by over 10%.
Count of residential properties by percentage change in valuation, FY23-FY24 and FY24-FY25
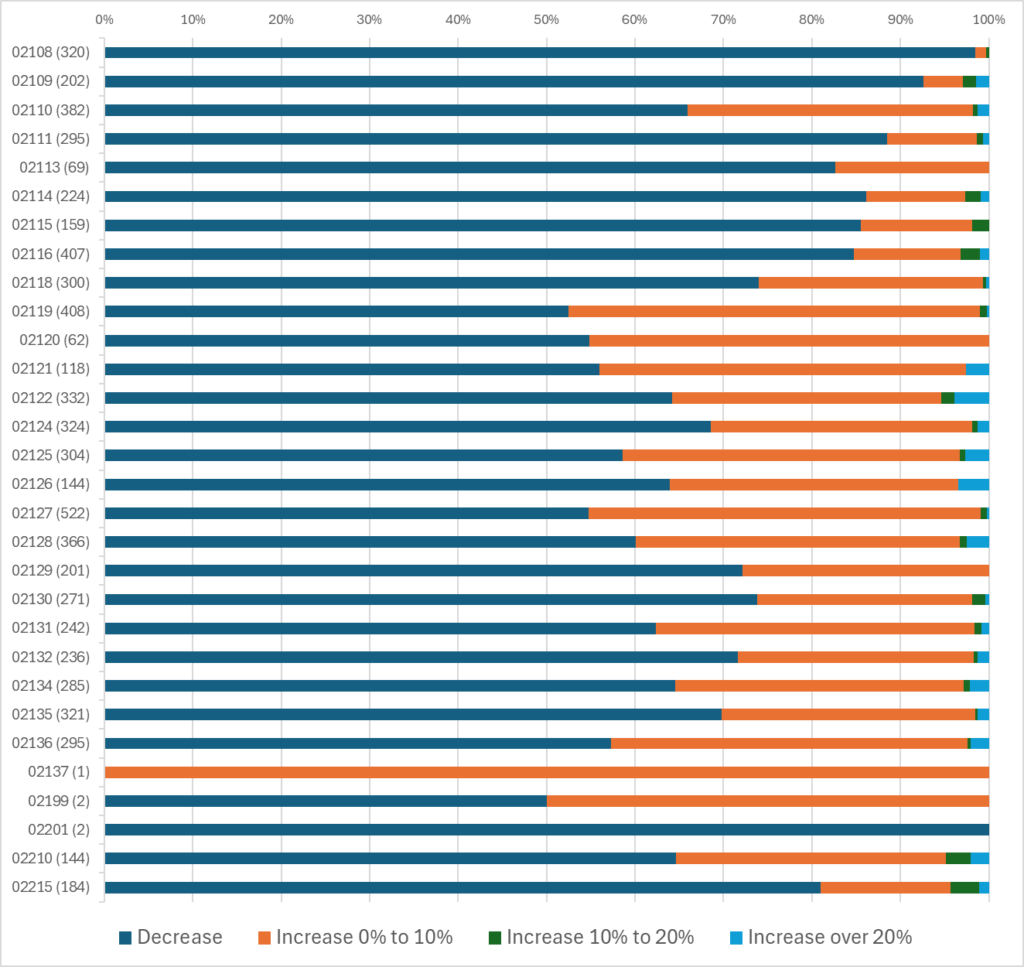
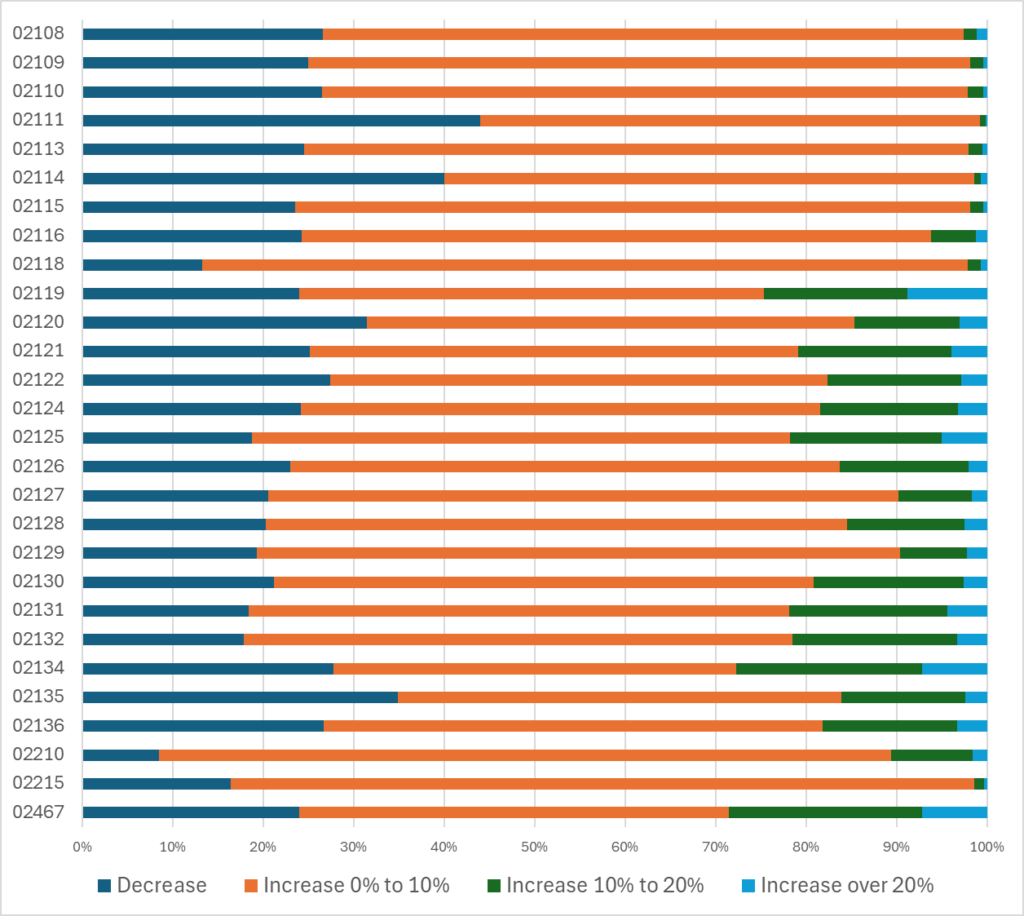
Within every zip code there was substantial variation in residential property valuations. In every zip code, there was a substantial group of properties that saw valuation decreases and in most zip codes, there was a substantial group of properties with valuation increases over 10% and many properties with increases over 20%.
Percentages of residential properties experiencing valuation percentage changes with defined ranges, FY24 to FY25 by zip code
Value changes by neighborhood and property type
This section looks in more depth at patterns of residential valuation change by neighborhood and property type. The most discernible trend in valuations is softness in the downtown condominium market, but what is ultimately most striking is the high variability even within single neighborhoods and property types.
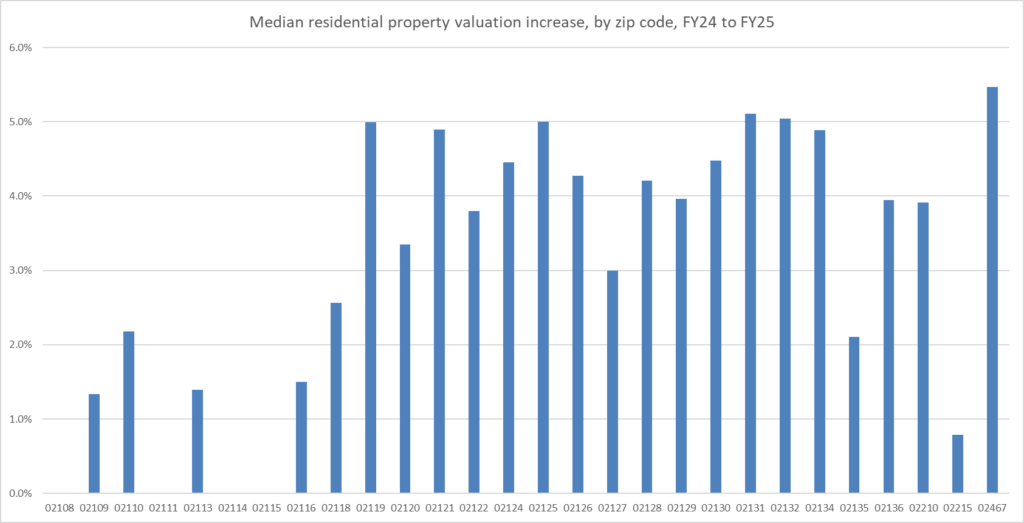
The chart below shows the median increase in residential property values within zip code. The central Boston zip codes, 02108 through 02118 and 02215, show median valuation changes mostly under 2%, while the outer neighborhoods experience median valuation growth of 3 to 5%. 02210, the seaport, had healthy value growth, more like the other neighborhoods. The City of Boston publishes a zip code map here.
Median change in assessed value for residential properties, FY24 to FY25, by zip code
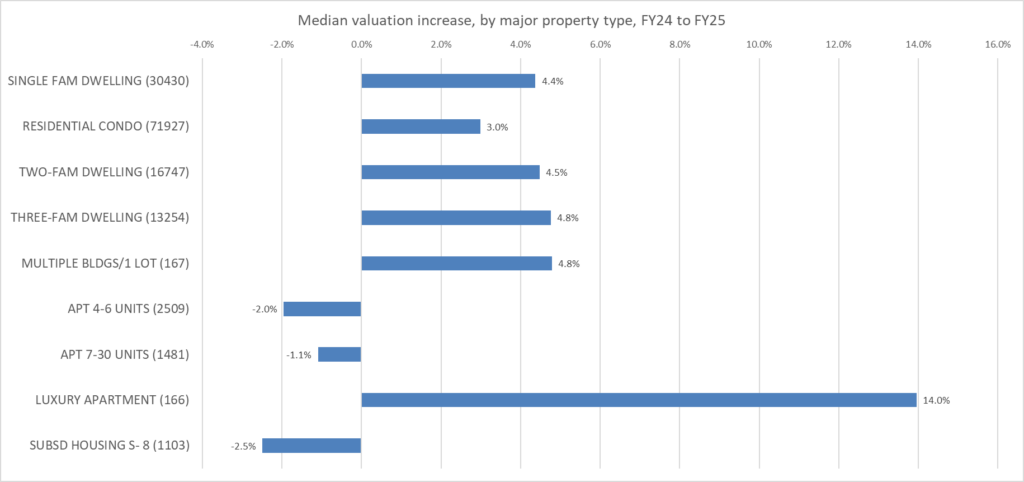
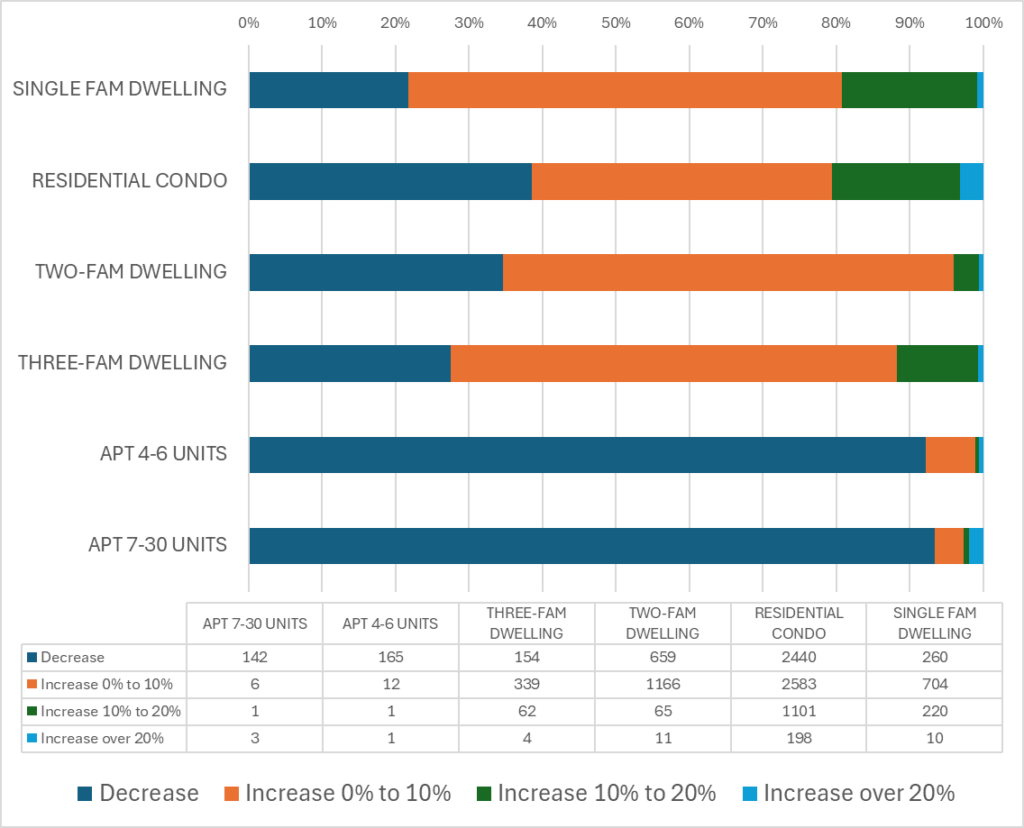
There also variations by property type. Condominiums, which constitute almost half (47%) of the residential properties in city, showed less assessed value growth than the other other major categories — single, two, and three family homes. Larger apartment buildings are generally down. Note that in the chart below, the first four property types add up to 87% of the individual properties in the city. The other categories are each only 1 or 2% of the individual properties. Additional, less numerous property categories are excluded from the chart.
Median change in assessed value for residential properties, FY24 to FY25, by major property type
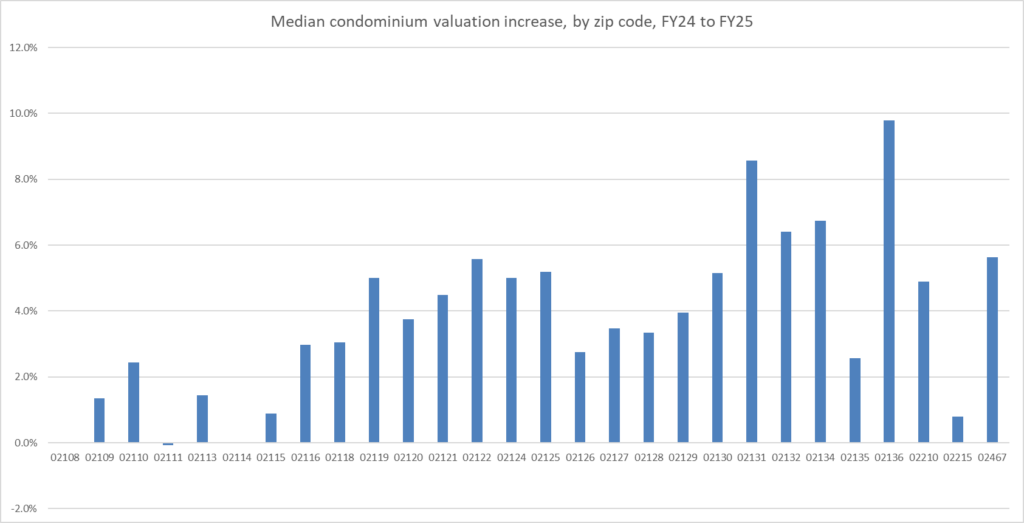
Softness in the downtown condominium market (discussed in the real estate trade press) apparently drove much of the neighborhood variation. As the chart below shows, condo valuation growth was weakest in the central Boston zip codes (02108 through 02118 and 02215). In these zip codes, condominiums constitute 89% of the individual properties and dominate the valuation changes. (In all other zip codes together, condos only constitute 37% of the properties.)
Median change in assessed value for condo residence properties, FY24 to FY25, by zip code
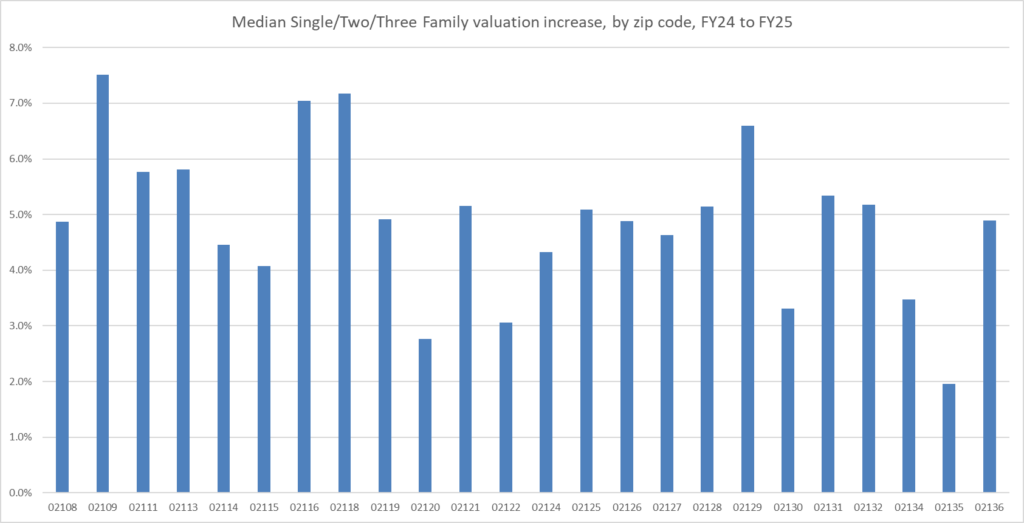
Excluding condominiums, the variation in valuation growth was more modest and less patterned across neighborhoods, as shown in the chart below which combines single family with two and three family residences. (The patterns are similar for single vs. two/three family; for separated analysis, see this SF spreadsheet and this 2F/3F spreadsheet.)
Median change in assessed value for single/2F/3F family properties, FY24 to FY25, by zip code
The analysis above shows neighborhood and property type variations in valuation, but what is more striking is that even analyzing property classes in a single neighborhood, there is substantial variation. Focusing on just a single neighborhood, Brighton (02135), within most classes of property, many properties had decreases and many had substantial increases.
Brighton 02135: Percentages of residential properties experiencing valuation percentage changes with defined ranges, FY24 to FY25 by property type
Wide variation in residential tax bill increases
As changes in residential valuations vary, so changes in tax bills vary. However, the variation in change for residential tax bills is greater than the variation in change in assessed value because of the residential exemption. The residential exemption was $331,241 in FY24 and is $344,060 in FY25. If a taxpayer had a property with a value $50,000 over the exemption in FY2024 ($381,241), but their value increased to $100,000 over the exemption in FY2025 ($444,060), their taxes would double, even though their valuation only went up by 16%. They could similarly experience a dramatic decrease. The exemption leverages change most for the lowest value properties.
The next two illustration pairs array residential properties according to their percentage tax bill increase from FY24 to 25 — first for all residential then for owner-occupied.
Boston residential properties arrayed by FY24-FY25 tax bill increase
(vertical axis is % increase; horizontal access is percentile among properties)
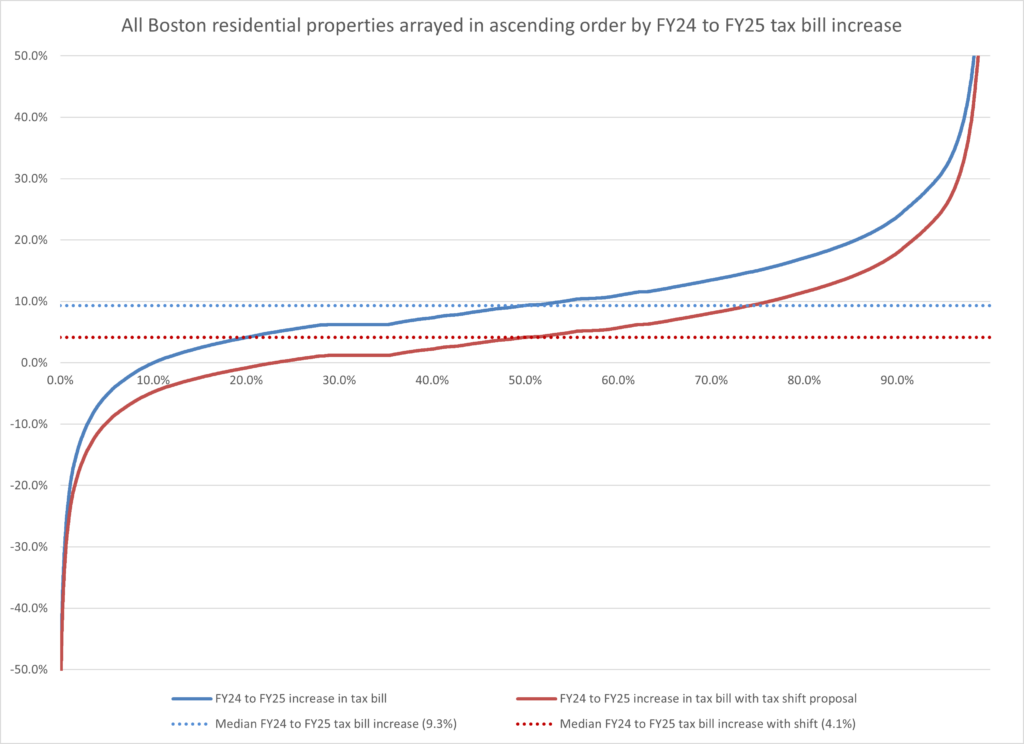
The next chart analyzes the properties arrayed in the graphic above into groups according to the effect of the tax shift proposal on their tax bill rates and tax bill change.
Residential properties classified by effect of the tax shift proposal
| Effect of tax shift proposal on bill increase | Count | Share | Average FY25 Bill | Average* FY25 Bill Increase | Average* FY25 Bill Increase with shift |
|---|---|---|---|---|---|
| Deeper cut | 15,173 | 10% | $5,372.42 | -8.6% | -13.0% |
| Increase becomes a cut | 19,776 | 13% | $10,335.17 | 2.9% | -2.0% |
| Lowered from below 10% to further below | 47,121 | 31% | $9,488.83 | 7.4% | 2.3% |
| Lowered from above to below 10% | 33,562 | 22% | $8,965.59 | 12.3% | 7.0% |
| Remain above 10% | 36,078 | 24% | $6,824.26 | 29.6% | 23.4% |
| Grand Total | 151,710 | 100% | $8,438.05 | 11.6% | 6.3% |
Owner-occupied residential properties arrayed by FY24-FY25 tax bill increase
(vertical axis is % increase; horizontal access is percentile among owner-occupied properties)

Owner-occupied residential properties classified by effect of the tax shift proposal
| Effect of tax shift proposal on bill increase | Count | Share | Average FY25 Bill | Average* FY25 Bill Increase | Average* FY25 Bill Increase with shift |
|---|---|---|---|---|---|
| Deeper cut | 11,621 | 15% | $4,214.40 | -9.6% | -13.9% |
| Increase becomes a cut | 9,628 | 13% | $6,755.24 | 2.8% | -2.1% |
| Lowered from below 10% to further below | 15,253 | 20% | $8,361.17 | 7.7% | 2.6% |
| Lowered from above to below 10% | 16,213 | 21% | $7,083.47 | 12.4% | 7.1% |
| Remain above 10% | 23,551 | 31% | $5,277.72 | 32.1% | 25.8% |
| Grand Total | 76,266 | 100% | $6,302.78 | 13.0% | 7.6% |
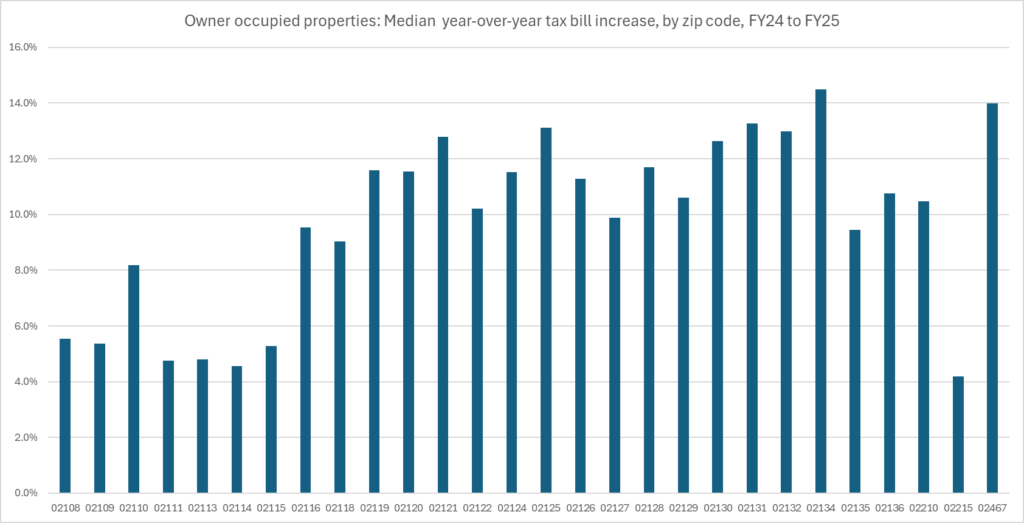
Where are tax bill shifts greatest?
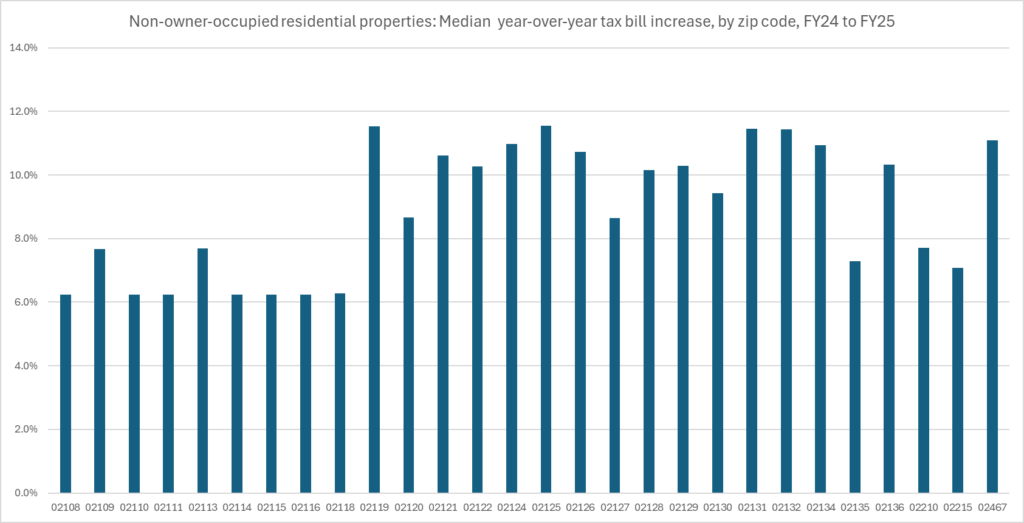
The only strong neighborhood pattern that emerges is that noted already for valuations — downtown neighborhoods saw lesser increases. The two charts below show the median tax bill change by zip code for non-owner-occupied properties (no exemption) and owner-occupied properties (with exemption). Inspecting the first chart, one sees that most of the downtown zip codes have median tax bill changes of 6.2%. This reflects the 6.2% increase in the tax rate from FY24 to FY25 applied to a median group of non-owner-occupied residential properties that have no change in assessed value. In some cases, this reflects condo parking spaces which are classified as residential and saw no change in valuation. In the rest of the city, the tax bills go up by 7 to 12% — so the overall range of median tax bill increases by zip code is from 6 to 12%, similar in span to the valuation changes by zip code shown further above which range from 0 to 5%. In the second chart, owner-occupied increases vary more widely from 4 to over 14% due to the leverage of the residential exemption.
Non-owner-occupied residential properties — median change in tax bill, FY24 to FY25, by zip code
Owner-occupied properties — median change in tax bill, FY24 to FY25, by zip code
The bills with the largest percentage increases tend to draw the most concern. These are likely to occur for owner-occupied properties that are of low value — these are the properties that have the largest leverage of change due to the residential exemption. The chart below shows the counts and average values of different property types in FY25 in Boston. The chart highlights the dominance of four property types and shows that the average values for each of those types are not as different as one might expect.
FY25 Class 1 Residential Properties by type and Owner-Occupancy
| Property type | Not O-O Count | O-O Count | Not O-O Average value | O-O Average value |
|---|---|---|---|---|
| 101–SINGLE FAM DWELLING | 5,245 | 25,189 | $1,044,030 | $834,278 |
| 102–RESIDENTIAL CONDO | 37,168 | 36,212 | $881,302 | $872,809 |
| 104–TWO-FAM DWELLING | 6,758 | 9,990 | $963,246 | $909,445 |
| 105–THREE-FAM DWELLING | 8,369 | 4,886 | $1,191,420 | $1,127,704 |
| 111–APT 4-6 UNITS | 2,131 | 379 | $1,343,126 | $1,234,150 |
| Larger Multifamily | 2,964 | 52 | $4,362,921 | $3,279,157 |
| Other — land, condo parking, etc. | 14,325 | 67 | $71,967 | $1,256,252 |
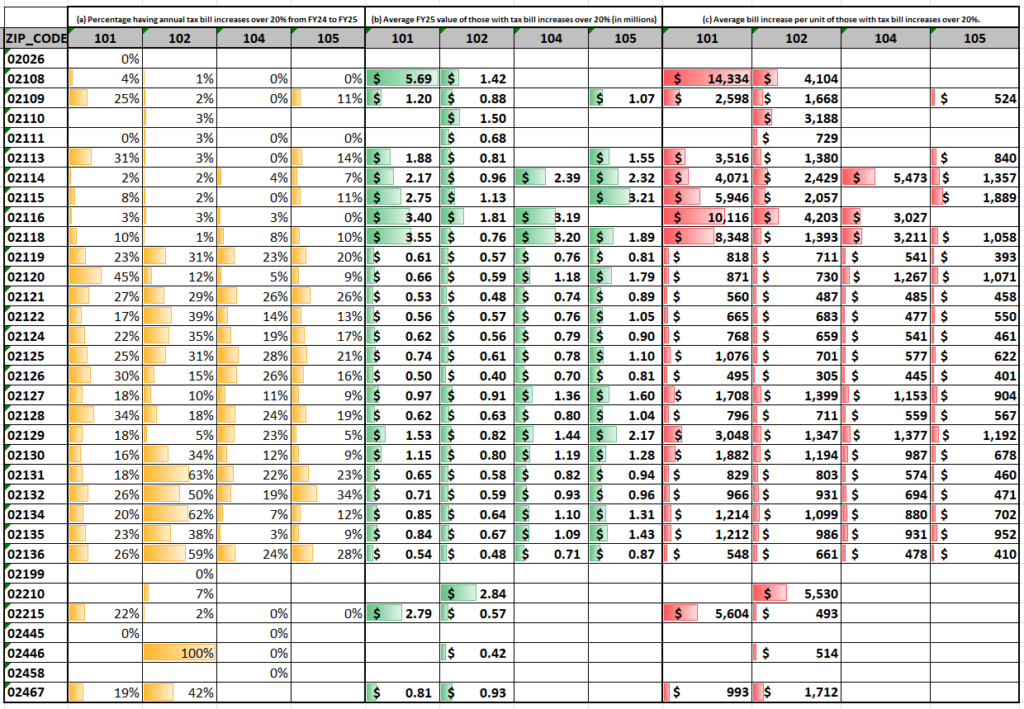
Focusing on the four major property types identified above, the following graphic highlights the zip code and property type combinations with the highest share of 20%+ tax bill increases. Large percentage tax bill increases are most common among condos in the outlying zip codes, but the high value downtown properties have the largest absolute bill increases. The City of Boston publishes a zip code map here. All the increases shown in the chart are annual tax bill increases as opposed to quarterly bill increases.
Owner-occupied residential properties by major property type* and zip code:
(a) Percentage having annual tax bill increases over 20% from FY24 to FY25,
(b) Average FY25 value of those with FY24 to FY25 tax bill increases over 20% (in millions)
(c) Average bill increase per unit of those with FY24 to FY25 tax bill increases over 20%.
Are the changes more than should be expected?
In a revaluation year, relative change is to be expected and the spread of relative change in this revaluation is less than in the last revaluation. The first chart below is a histogram of the percentage changes in assessed value for single family, two family, three family, and condominium residences. Of the 132,175 such properties that are present in both years, the chart excludes 0.6% or 836 outlier properties that differ by more than 30% from the unweighted mean change, which was 3.9%. Almost half of those excluded that are single, two, and three family properties do match by property ID to recent building permits, suggesting either substantial improvement or in a few cases decline due to a fire. However, it is hard to rely on building permit match alone as a mechanism of exclusion because the building permit database does not appear to consistently match to property id for condominium units, the most numerous property class (either that or there are only a handful of building permits pulled for condominium units). We exclude all 30%+ outliers (only 0.6% of the total) assuming that there is some special story about each of them. Computations for this section are here.
Distribution of properties by change in assessed value, FY24 to FY25, major residential property types
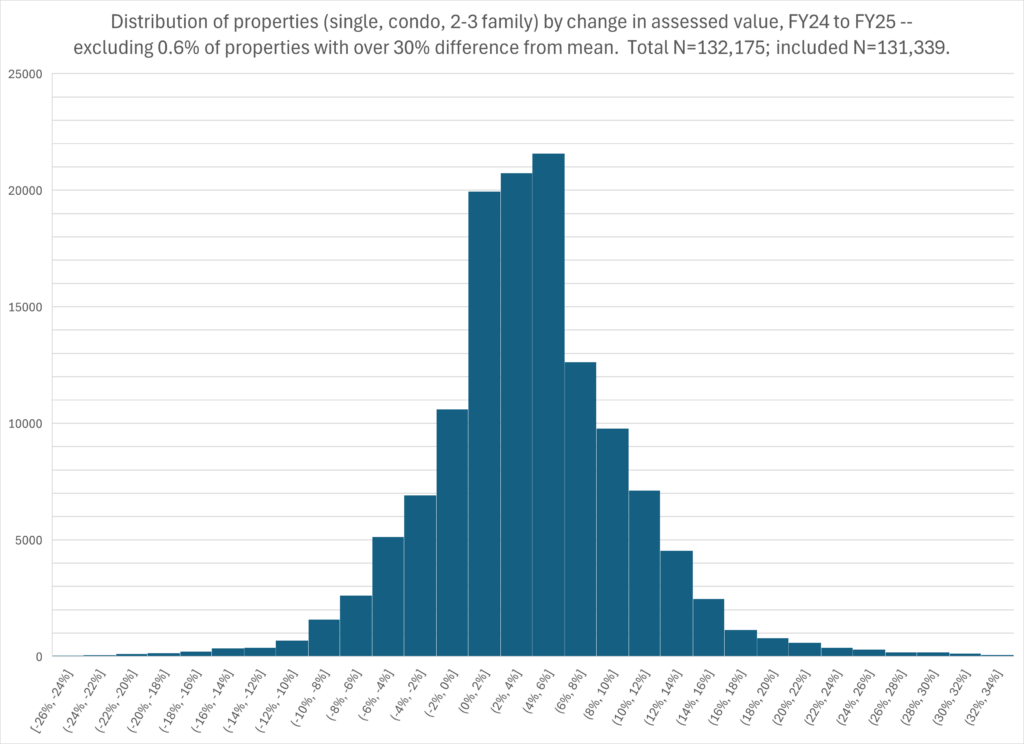
Total FY24-25 N=132,175; included N=131,339 (outliers over 30% different from mean excluded, 0.6% of total).
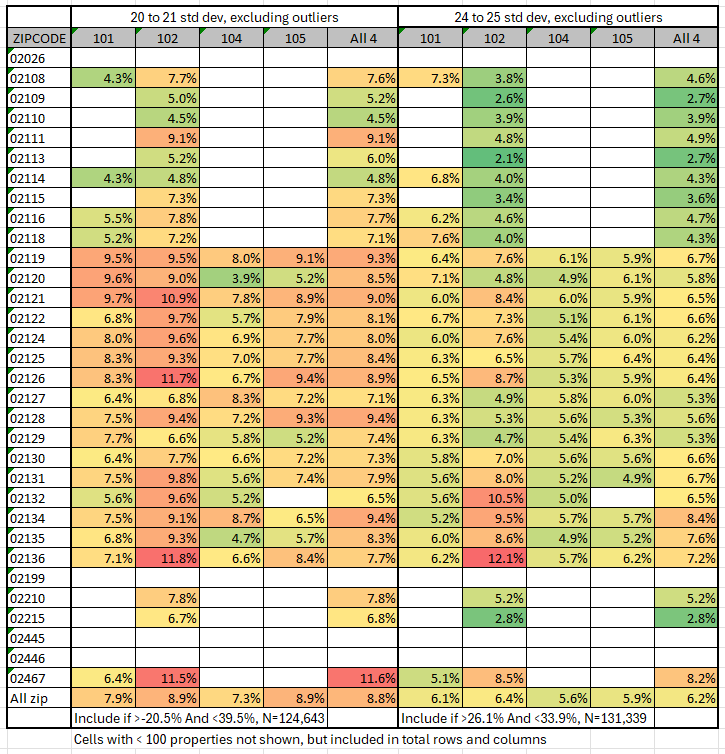
This distribution of change appears to have been wider in the last revaluation which occurred from FY20 to FY21. The FY21 revaluation was as of January 1, 2020, so it is based on pre-COVID sales data, although the actual property valuation process occurred through the early COVID months. As a way of comparing the dispersion in the current valuation to the prior valuation, the table below shows the standard deviation in valuation change by property type and zip code. The same 30% rule is used to exclude outliers from the FY20 to FY21 change comparison, but the rule does exclude more properties — the last valuation had more large outliers (1.4%). As the table shows, it also had higher standard deviations in every zip code and property type and in most combinations of zip code and property type. The standard deviations were generally greater (redder in the color scheme) in FY21 than in the current FY25 year.
Standard Deviations of Assessed Value Percentage by Change Zip Code and Property Type
— prior (FY20-21) compared to current valuation (FY24-25). Type 101, single family; type 102, condominiums; type 104, two family; type 105, three family.
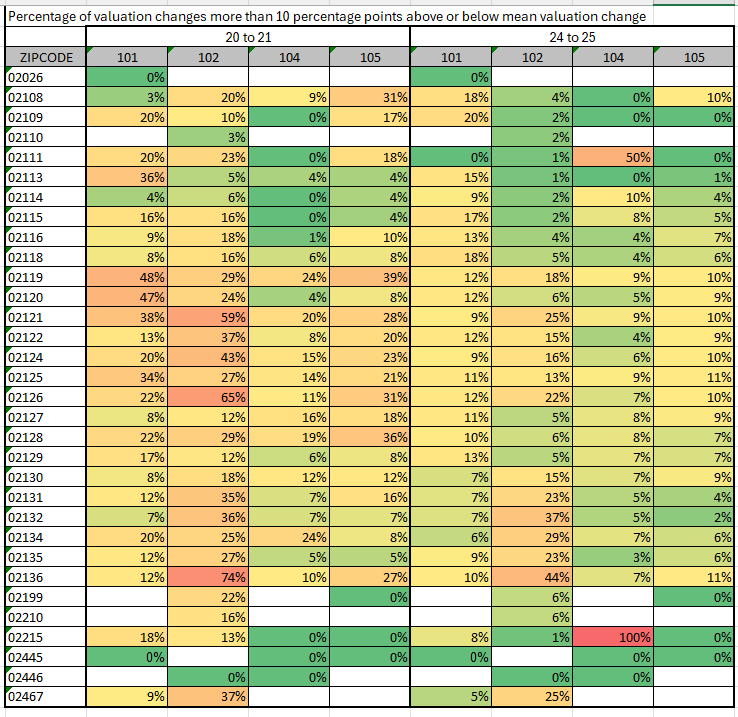
As another metric of deviation which points to the same conclusion — FY25 may not be an unusual valuation year — the chart below shows the percentage of assessed value changes deviating more than 10 percentage points from the mean for each zip code and property type.
Share of Assessed Value Percentage Changes > 10 percentage points from mean
by Zip Code and Property Type — current vs prior revaluation year. Type 101, single family; type 102, condominiums; type 104, two family; type 105, three family.
It should be noted that property values for the 4 property types in the charts were generally rising faster through the last revaluation, with an unweighted average valuation increase of 9.5% versus 3.9% this year. This does appear to contribute to wider variation in that revaluation period, as the zip/type cells with the largest variation in FY21 tend to be the ones with highest mean valuation change. This is shown on the stddev tab in the computations spreadsheet. It’s not obvious whether or how to normalize for this difference in change rate. Because we are working with percentage changes, already scaled, it does not make sense to scale the standard deviation by the mean, computing a so-called “coefficient of variation.” Since our goal is to understand how wide the variation in taxpayer experience of change was, it probably does make most sense to view the standard deviations as we have presented them, without further normalization.