
This post collects some basic geographic and weather facts as background for understanding flood risks in the Greater Boston area.
Current and Historical Conditions
Downtown Boston and many of the inner suburbs lie in fairly low areas — much of them below the green 20 foot contour line in the map below, some below even the red 10 foot contour. You can click the map to enlarge it.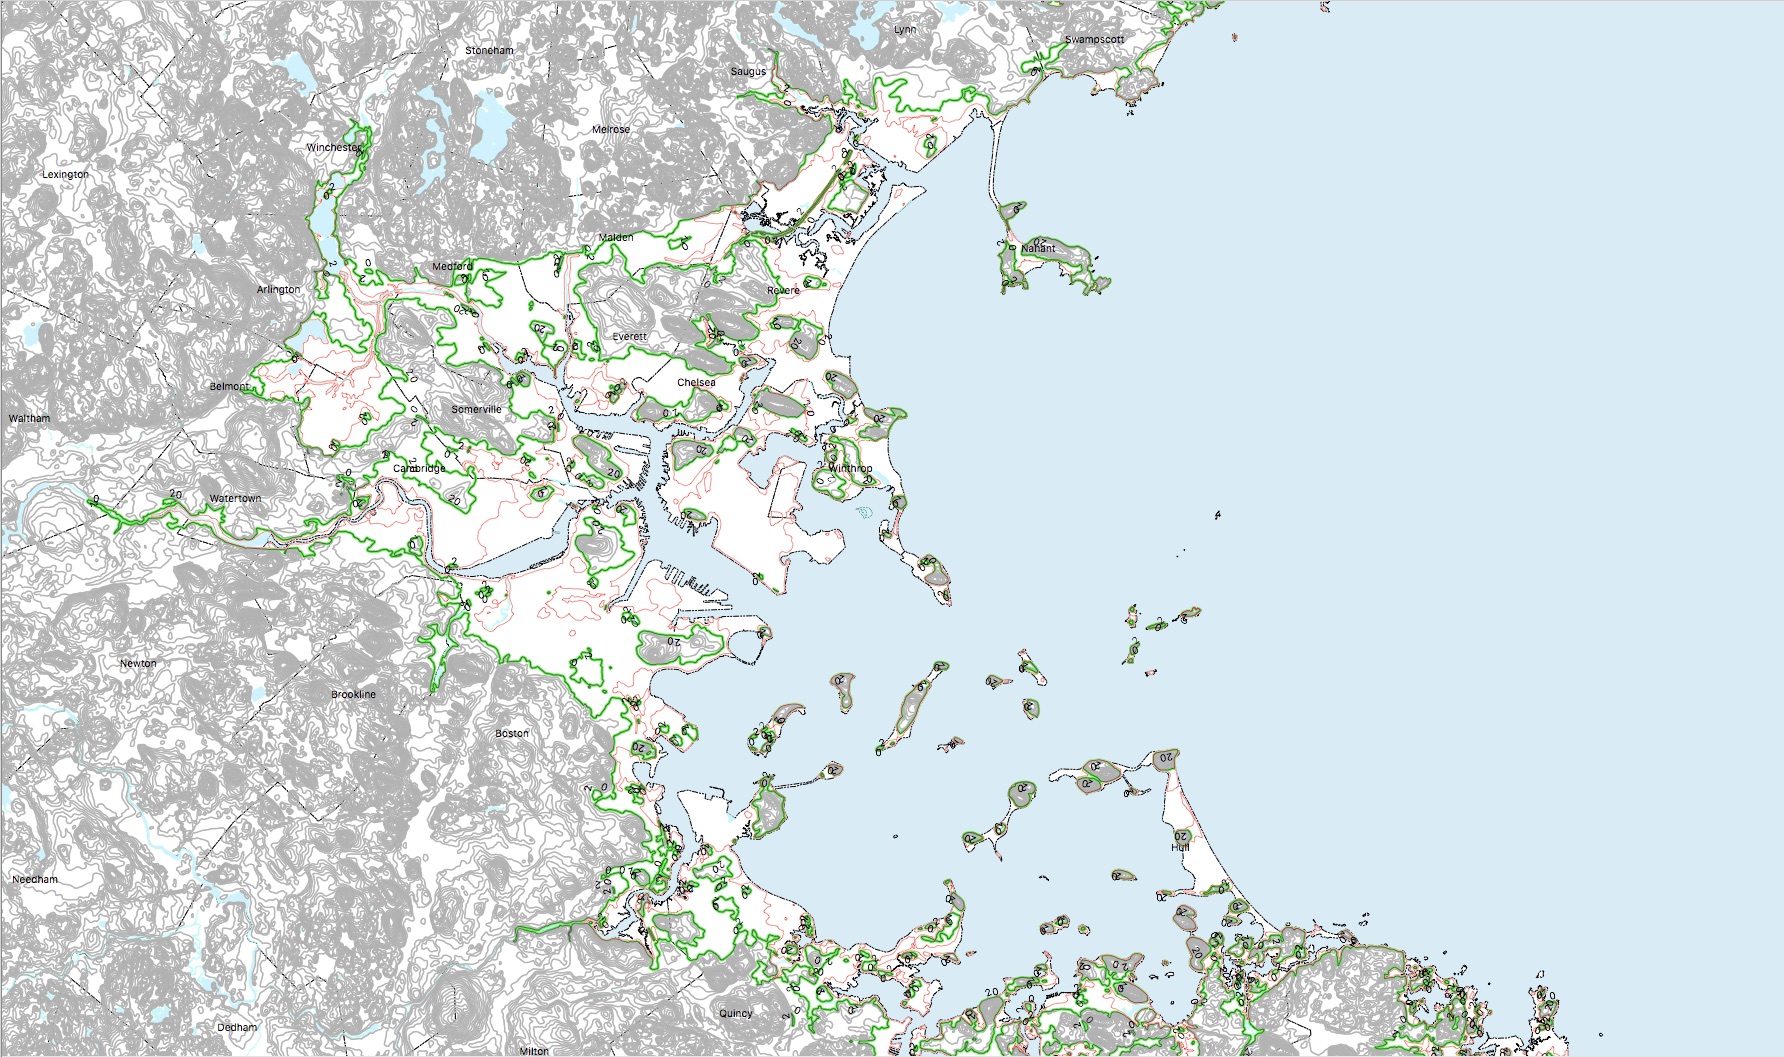
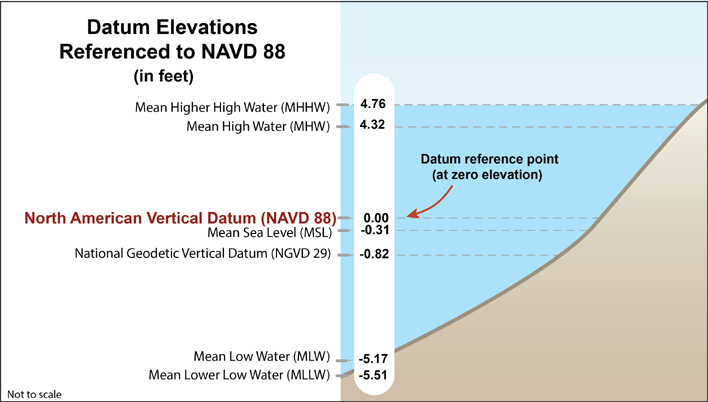
The elevation contours in this map are measured from a level referred to as the North American Vertical Datum of 1988, which is very close to the mid-point between high and low tides in Boston Harbor.
Click for source.
The most extreme confirmed high water observation in Boston Harbor occurred in the Blizzard of 1978 — the storm tide (astronomical tide plus storm surge) on that date has not been exceeded in almost 100 years of observations (although our January 2018 blizzard may be confirmed to have gone slightly beyond it). The NOAA graphic below shows departures above Mean Higher High Water. The stand out departure to 4.82 feet (roughly 1.5 meters) occurred on February 7, 1978 in the blizzard. As the graphic above shows, MHHW is 4.76 above the datum, so the total maximum elevation of water we know that Boston Harbor has experienced was 9.58 feet above NAVD. (For more history of tide fluctuations, see this fascinating study which suggests that there is an 18 year cycle in tide levels.)
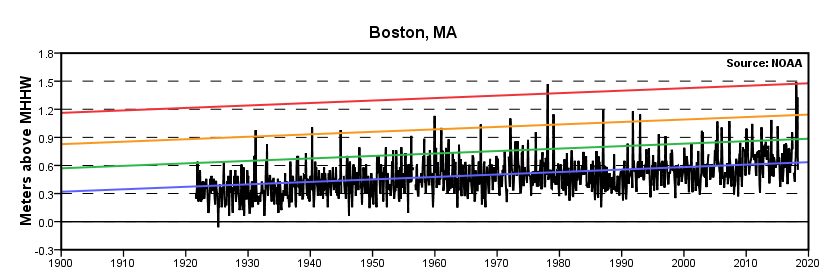
Click for source.
So, very roughly, one could think of the 10 foot contour as defining the areas at risk from sea inundation in storms at our current global sea level. There are three important qualifications to that concept:
First, in areas directly exposed to driving waves, water levels can exceed 10 feet. After the blizzard of 1978, the USGS surveyed highwater lines and documented some coastal locations that got water well above the 10 foot level.
Second, there are many areas that are below the 10 foot level that are relatively safe from inundation because they are protected by a seawall. The Charles River and Mystic River basins, shown below, are protected by sea walls at their mouths. Flow through these seawalls is regulated by gates so that the water within those basins stays close to the zero (mid-tide) level. These seawalls have huge pumps built-in so that they can keep the river from rising much even when extreme rain-driven flow coincides with the gates being closed to a high tide. 
Third, just because higher levels have not happened does not mean they could not happen. Storm tide can vary widely depending on very specific storm conditions and their interaction with local topography, and of course, the timing of the storm with respect to high tides. The National Hurricane Center conducts a modeling exercise where thousands of storms are simulated to identify worst-case “perfect storm” hurricane impacts. These models suggest the possibility of flooding in extreme storms well beyond the levels observed to date — out to the 20 foot contour — even at current sea levels.
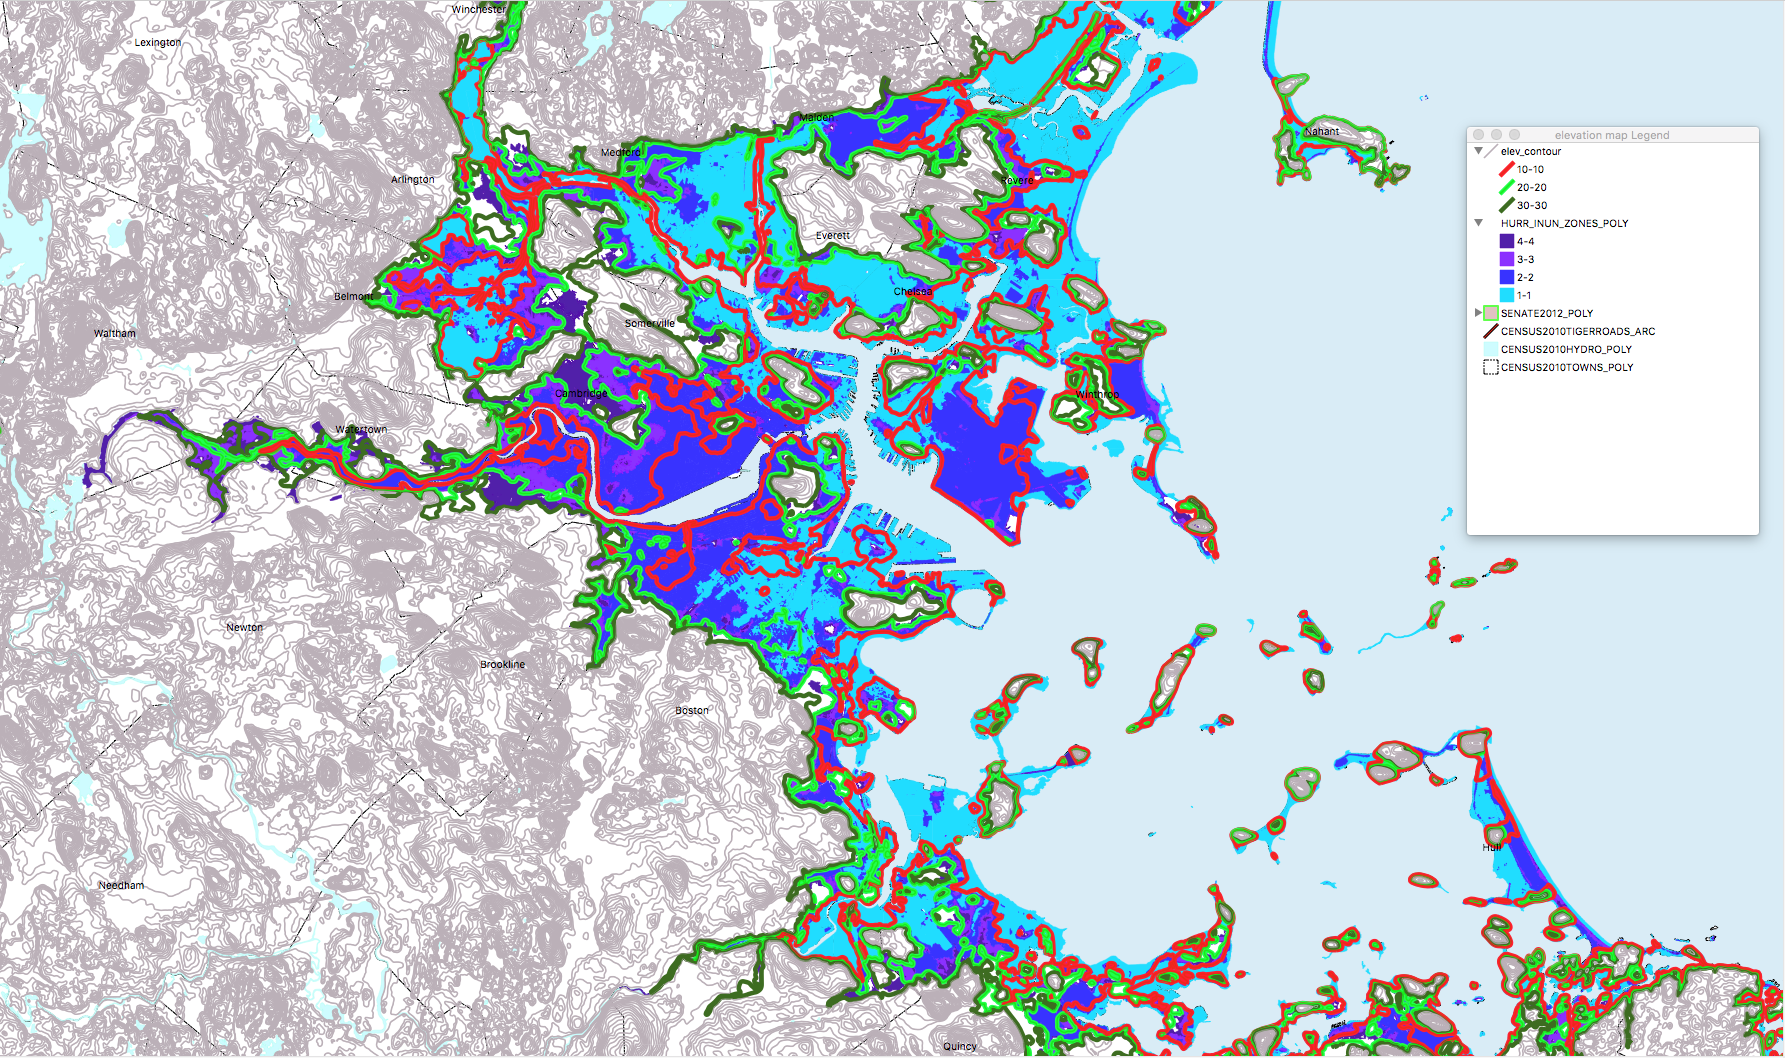
The map below, based on NHC worst case data via MassGIS, shows the composite of all areas reached by different simulated Category 4 Hurricanes (the blue and purple coloring) against the green 20 foot contour and the darker green 30 foot contour (which lies very close to the 20 foot contour throughout the region). These models should not be considered to mean that the practical risk extends that far — there is no probability attached to these simulations. This not the 100-year or 500-year storm. This is the composite of possible impacts of many maybe-someday-maybe-never storms.
The Federal Emergency Management Agency conducts a risk analysis and classifies areas according to the probability that they will be subject to some amount of overland flooding (could be inches of still water or feet of running water). The map below superposes the FEMA maps via MassGIS against the contour lines. The dark blue is area subject to a 1% (“100 year”) annual chance of flooding; the bright blue is subject to a 0.2% (“500 year”) annual chance of flooding. 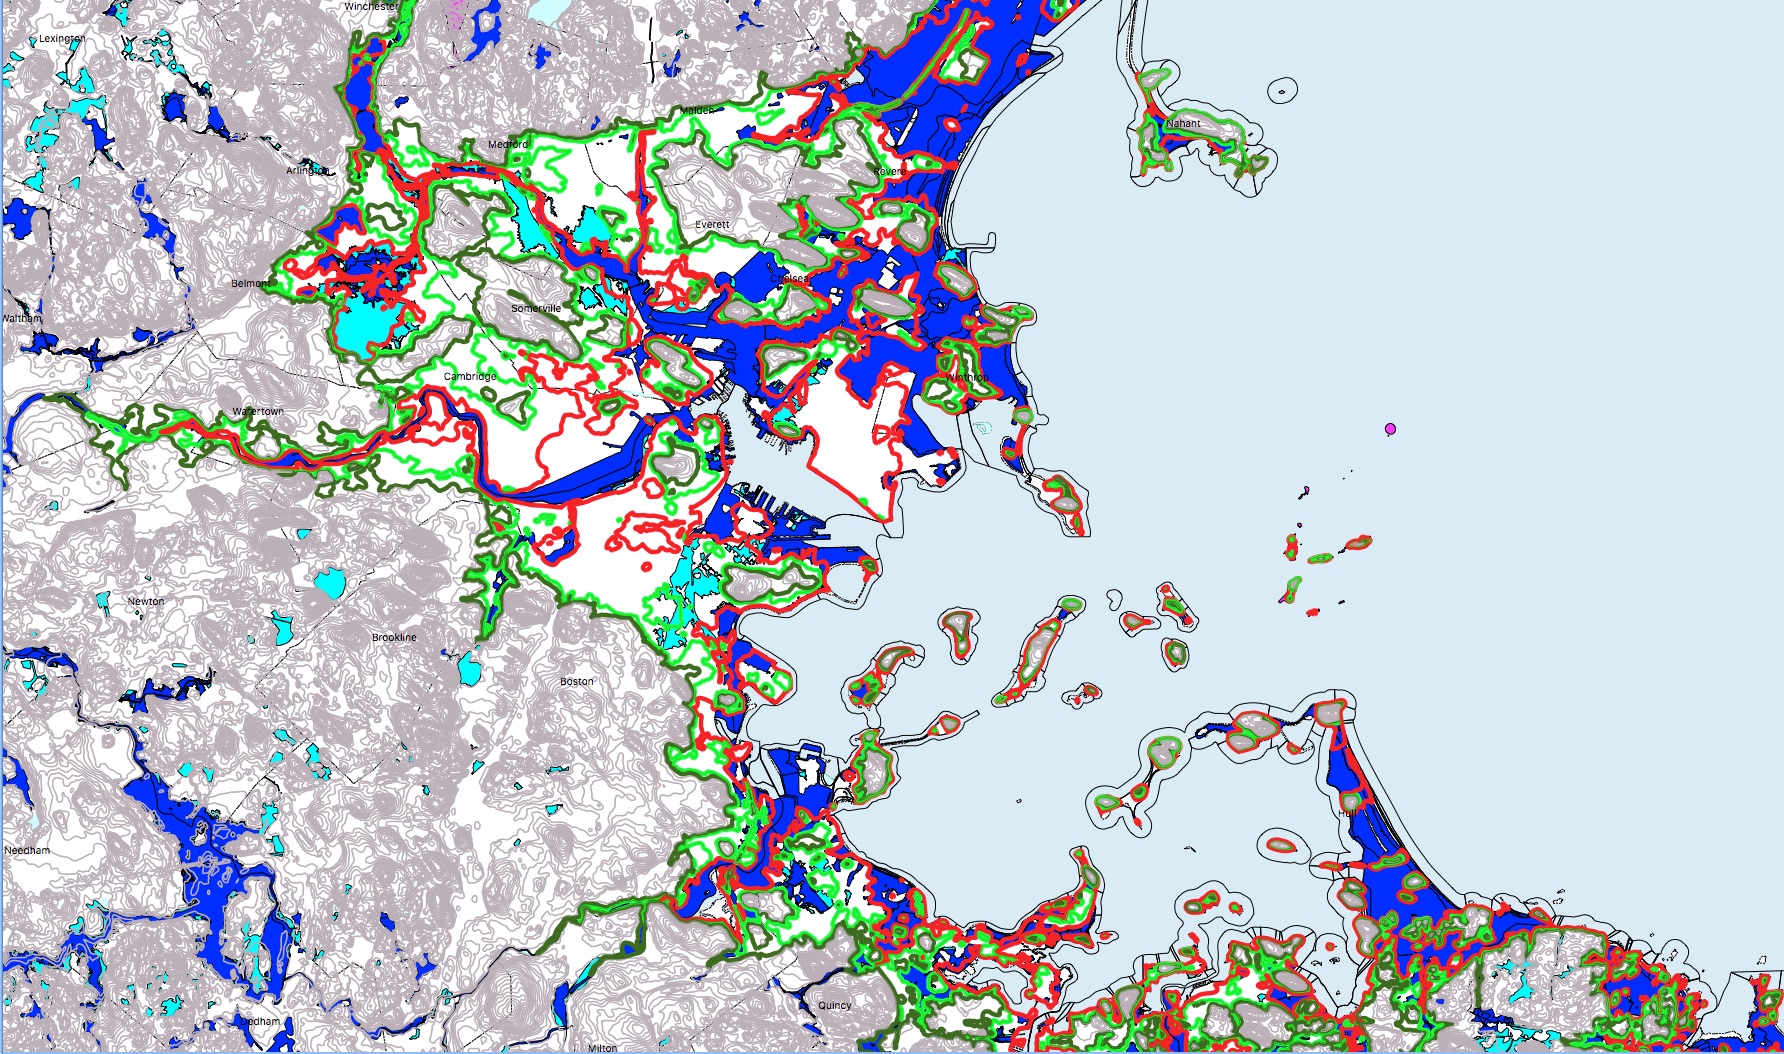
To summarize, based on history and the FEMA analysis, the meaningfully at-risk areas lie mostly within the 10 foot contour and some of the lower areas are not at meaningful risk due to our sea walls; theoretically possible flooding extends further to the 20 foot contour. It should be noted that areas next to rivers at higher elevations are also subject to flooding.
The Coming Century.
The FEMA risk maps do not account for sea-level rise or increased rain fall due to climate change. By 2100, it is expected that sea levels will rise, perhaps by as much as two meters, a little over six feet. Storm surge risks may increase as storms grow larger and more frequent. One analysis conducted for the City of Boston pegged the 1% storm in 2100 (in the higher global carbon emissions scenario) as being 8.2 feet higher than today’s 1% storm. After 2100, sea level may continue to rise.
So, if the 10 foot contour very roughly defines the area at meaningful risk of inundation today, and the 20 foot contour very roughly defines the area that may be at theoretical risk of inundation today, then adding 10 feet to those two levels is a good rough way of defining the areas at some risk 100 years from now. The uncertainties are huge, but since it so happens that in our region the 20 foot and 30 foot contour lines lie close together, the area that we should be studying to more precisely assess risk as the climate changes is pretty well bounded by the 20 foot contour line.
The regional conversations about sea level rise risks break into several parts:
- The coastal areas that are directly exposed to surf have to think about improved resiliency over the fairly short term.
- The Boston waterfront, although sheltered from surf, has to consider inundation risks over the next few decades.
- Low areas in the basins protected by sea walls — Back Bay, Fenway, North Allston, Cambridge along the Charles, Alewife — need to evaluate how long their sea walls will provide protection and whether they provide adequate protection for the worst possible storms today.
- Owners of critical infrastructure components — the T, the airport, the sewers, the tunnels — need to precisely identify their exposures and address them.
- There is a long-shot conversation about a larger regional seawall solution — if one squints at the contour maps above, one can imagine connecting the areas over 20 feet across the Boston Harbor Islands to enclose all of downtown Boston.
The good news is that all of these conversations are happening — many agencies are conducting very sophisticated modeling to assess the risks as precisely and realistically as possible. Given the district that I represent, I’m particularly concerned about the third and fourth conversations — the protections for the Charles and Mystic basins and the critical infrastructure.
The Long View
In the unthinkable scenario — well beyond any meaningful planning horizon — that global warming were to continue unabated for many centuries, and the major ice masses of Antarctica and Greenland were to melt entirely, global sea levels might rise by over 250 feet.
As any cyclist can tell you, the land generally rises as one moves west out of Boston. It reaches the 300 foot level around Route 495. If one wanted to identify mainland that is more or less guaranteed to stay dry 1000 years from now, that’s about as far west as one would need to go.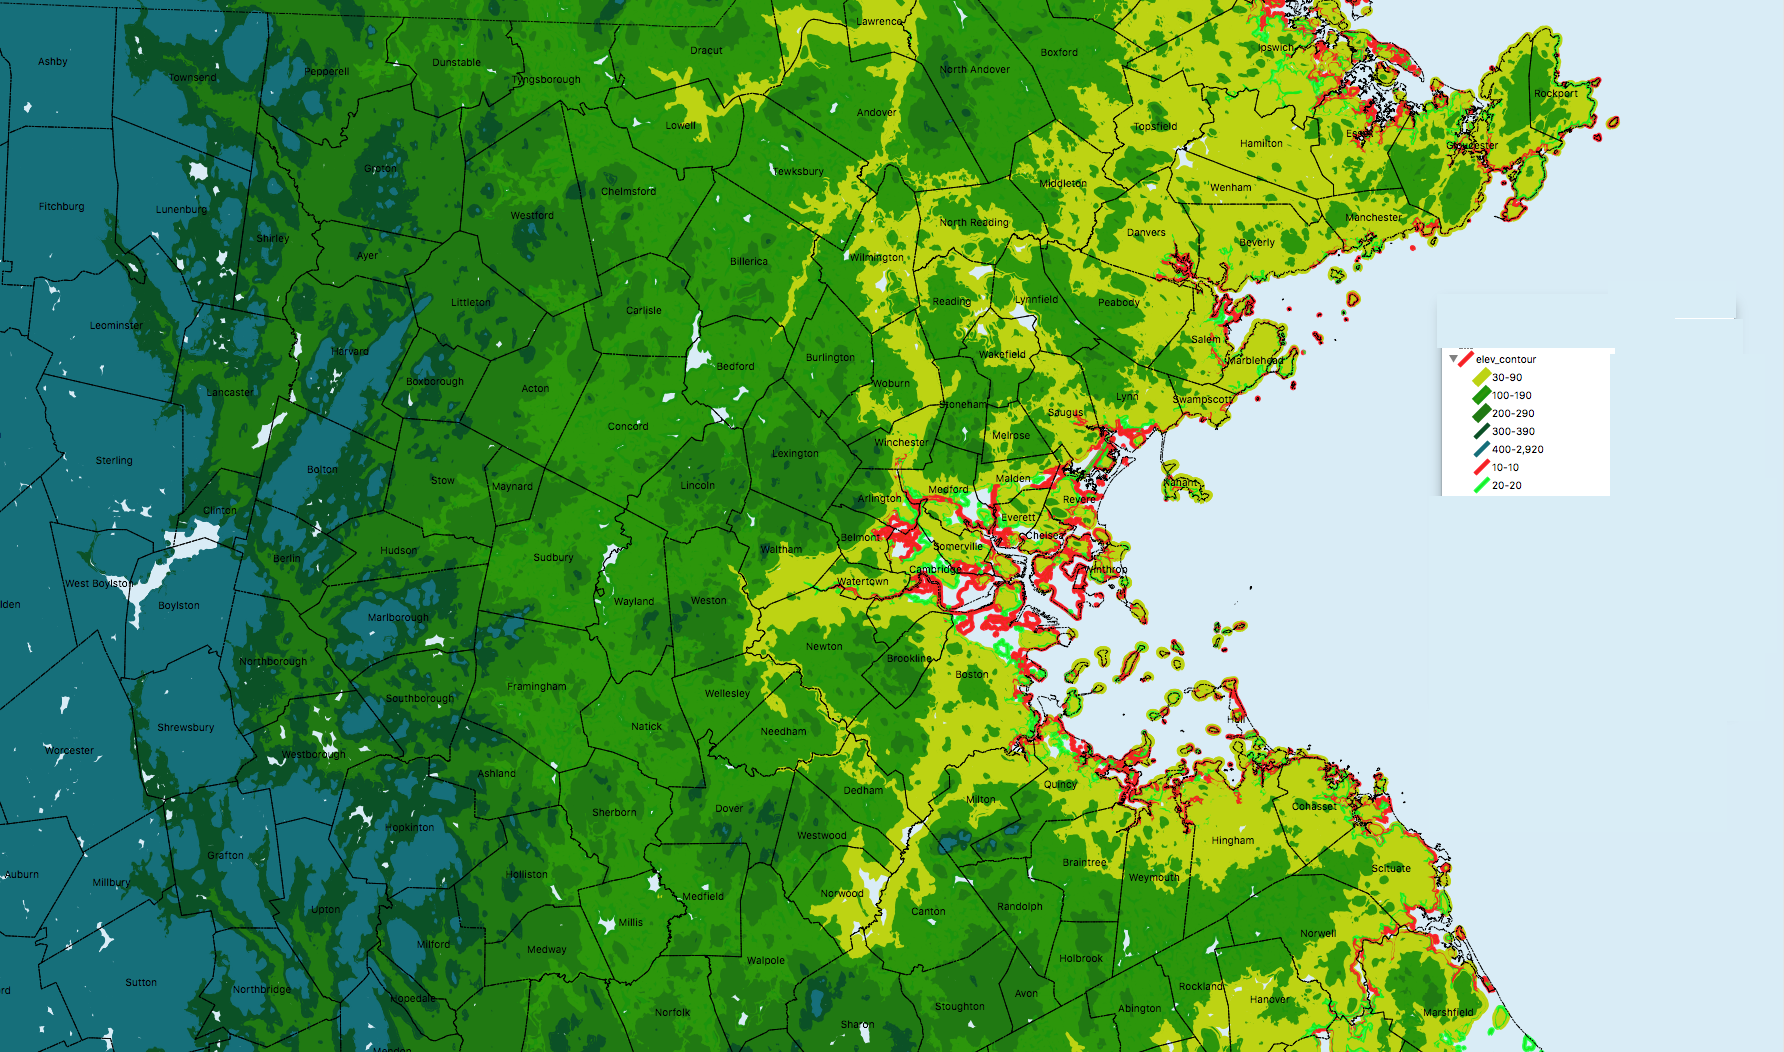
Source note:
Note, maps in this post were created using Cartographica combining municipal boundaries from the U.S. Census via MassGIS and other data layers from MassGIS (identified above) with elevation contours from the U.S.G.S. — The U.S.G.S. contours are derived from the National Elevation Dataset .
Historic note:
It’s worth acknowledging that much of the area that we need to plan to protect was beach or marshland in 1600. Much of the land around Boston is filled marshland. The other development strategy that we pursued was to create drainage structures and sea walls to convert marshland into terra firma. The seminal planning study by the famed MIT engineer, John Freeman, that led the drainage of the Alewife swamp in the early 20th century is available online:
Below appears an image from that study showing what is now the heavily developed “quadrangle” area in Cambridge:
Thanks so much for this incredibly interesting and helpful presentation. As one who is concerned about our future in relation to Climate change, it’s helpful to understand how it may impact our family today- and years from now, thereby informing some of our present and future planning.
Very interesting. Begets the question of the rate of sea-level rise, Infrastructure protection seawalls.Cost of mitigation, revenue production of protected area and ability to pay for mitigation costs. Let me translate there is some value short term for seawalls, don’t spend too much here but at some point in time resources are better spent on outer 495 relocation than shoveling money against the tide. Let current infrastructure wear out while relocating elsewhere. Move Logan to Wooster. Bye bye Boston etc.
Logan and all airports could be vastly different in design than they are now.
I foresee where there will be wide tubes in the sky that fan out like forks on a rake. Plane enter these tubes and as they go down the tube it slows and the wings retract so it becomes a pencil like cylinder going down this tube high in the air which can be over water or land. Thus current location or relocations are feasible.
I’d like to see an analysis (which as noted doesn’t appear to exist yet) of the combined effect of higher sea levels and extreme storm events on both water coming in from the sea and water going out to it, and meeting, say, in West Cambridge . . .
On it! Exactly this is forthcoming within weeks as a result of a study which we funded from Ellen Douglas, hydrologist at UMass.
The short answer, already somewhat evident from other work, is that when storm tide and precipitation both actually affect an area, the flood levels are mostly defined by the storm tide. “The ocean always wins”.
Thank you for this level of detailed information about sea level rise. To see the potential impact on the town and neighborhood level is eye-opening. The previous poster’s suggestion to move our main airport to Worcester makes a lot of sense. I wonder to what extent we can benefit from the technological solutions already in place in the Netherlands.
It may make sense at some point to retreat in the distant future, but it will only make sense in a worst case scenario which we should not assume is going to occur. If in 100 years, we haven’t kicked our fossil habit we’ll have to consider retreating from the coast, but we’ll also a whole lot of other problems.
Hopefully, we’ll come to our senses and take better care of our planet before then.
There is “built in” sea-level rise and if we completely kick fossil fuels tomorrow morning it will still rise to a new level. A moving target if we don’t
Seems that there has not been any rise in natural water levels in the last 100 years
It is only natural that areas prone to flooding for the last 500 years would get flooded in any in natural state. IE storms. The only sane thing to do is not build in naturally flooding areas.
Yup.
Our predecessors from the 18th to the 20th century made a set of decisions to fill in marshes around Boston and now we have billions of dollars of valuable real property sitting on them. You’ve prompted me to add a couple of historic maps to this post.
For better or worse, that’s what we are sitting on.
Thanks Will for this post. A few years ago I believe you commented that the pumps at the Earhart dam are at capacity during some storms. The pumping capacity during extended tidal surges seems like the weak leak in these analyses. Are there plans to increase capacity of the pumps?
The results from Cambridge’s recently released vulnerability assessment show that the water flow during a storm tide is orders of magnitude greater than the rainfall flows that those pumps are designed for.
It’s not close — those pumps will never be big enough to manage a storm-tide that overtops or flanks those dams.
Beautifully clear presentation!
In addition to maintaining and increasing the height of the seawalls, we also need some barriers to protect the subway from flooding, else we’ll be facing the problems NYC is having now with needing to take subway tunnels out of service to replace all the corroded wiring.
Yes. Very important. More here
Not to minimize the problem, but the more likely scenario in your reference is 47 feet (Greenland and West Antarctic sheets); 250 feet involves melting a more stable area — and if it actually melted, enough of the world would be toast that we wouldn’t worry about where to live in MA, but how to live at all.
But even a 47-foot rise would completely hose the region. Logan would be toast (wing-folding airplanes are too complex and too heavy for passenger traffic), and there’s no large flat area in the state big enough for an airport and a noise buffer. (When I was a private pilot I flew into Worcester; the main runway is a third shorter than the average at Logan, and there’s no room to lengthen it or add a serious second runway because the airport is on a hilltop, 500 feet above the city.) Without a major airport, business packs what it can and runs — to the Midwest, or possibly to the Canadian plains if the temperature rises too far.
I agree. Either way, it’s big trouble and either way we are talking so far into the future that a lot of other things we cannot foresee will have happened.
Thank you for this terrific analysis & presentation.
This very thorough and in many ways unsettling study urges our low-lying communities of the Metro Boston estuary to think about protection as well as resilience.
A small group of us has been building on a concept originally formulated by Antonio DiMambro in his 1988 BSA award-winning design for a barrier to protect Boston Harbor. We propose that a rigorous feasibility analysis be carried out of a 14-mile long structure between the shoulder areas of the Metro Boston estuary at Swampscott and Cohasset. We call it the Metro Boston DikeLANDS concept. It would not only protect all the low-lying communities of the estuary, but could – with a 200-wide top – create 68 new acres of waterfront land, which could be sold at between $3 and $5 million per acre. Thus the assumed cost of the Metro Boston DikeLANDS of $30 to $50 billion could yield a net profit of some $150 to $300 billion.
We’ve collected over 400 signatures recommending that a rigorous feasibility study be carried out of the Metro Boston DikeLANDS concept.
Anybody interested in this concept can call me @ 617 267-6598 or email me @ papesch@mac.com, and/or can request that we present a slide show to your community explaining the Metro Boston DikeLANDS concept.