
Summary
The 2015 Paris Agreement defines the current international framework for addressing climate change. This post reviews scientific background helpful to understanding the Paris climate goals and explores the latest global results of the implementation of the agreement.
The scientific evidence considered in this post suggests that collective global actions so far are not consistent with the Paris goal of limiting warming to 1.5º, or even 2º. The Paris agreement leaves great flexibility to developed and developing nations. Developed nations are not making the necessary deep cuts, but ultimately more troubling, developing nations are growing emissions so fast that even if developed nations could completely cease emissions in this decade, the 1.5º goal appears well out of reach. The science highlights the importance of strengthening climate resilience.
Physical science of global warming
This section is based entirely on publications from the Intergovernmental Panel on Climate Change. The IPCC is a scientific advisory organization as opposed to a goal setting organization. The IPCC periodically produces assessment reports speaking to the physical science of climate change, adaptation to climate change, and climate change mitigation (reducing emissions and removing greenhouse gases from the atmosphere).
Here are a few key definitions from the technical summary of the physical science component of the most recent (sixth) IPCC assessment report.
Technical Summary, Box TS.1
- Global warming: Global warming refers to the change of global surface temperature relative to a baseline depending upon the application. Specific global warming levels, such as 1.5°C, 2°C, 3°C or 4°C, are defined as changes in global surface temperature relative to the years 1850–1900 as the baseline (the earliest period of reliable observations with sufficient geographic coverage).
- Cumulative carbon dioxide (CO2) emissions: The total net amount of CO2 emitted into the atmosphere as a result of human activities.
- Net zero CO2 emissions: A condition that occurs when the amount of CO2 emitted into the atmosphere by human activities equals the amount of CO2 removed from the atmosphere by human activities over a specified period of time.
The technical summary reports the following basic relationship between these three basic concepts:
Global warming is roughly proportionate to cumulative CO2 emissions, so stabilizing global warming at any level requires us to reach net zero CO2 emissions.
Technical Summary, §3.3.1 (paraphrased)
The report makes the following fundamental estimates:
- The ratio of global warming to cumulative CO2 emissions is 0.45°C per 1000 GtCO2 (Gigatons of CO2), with a likely range of 0.27°C–0.63°C). Technical Summary, §3.3.1.
- During the period 1850–2019, a total of 2390 ± 240 GtCO2 of anthropogenic CO2 was emitted. The ± 240 GtCO2 uncertainty range is a likely range. Full Technical Working Group Report, §D.1.2.
- For the decade 2011–2020, the increase in global surface temperature since 1850–1900 is assessed to be 1.09°C, with a very likely range of 0.95°C to 1.20°C. Technical Summary, p. 41.
These three estimates fit nicely together: Emissions of 2390 GtCO2 multiplied by the 0.45 per 1000 ratio yields 1.08°C of global warming. As tidy as this relationship appears, it hides enormous complexity.
- First, there is material quantitative uncertainty. In the IPCC context, “likely” means “66-100% probability” and “very likely” means “90-100% probability.” See Guidance Note on Treatment of Uncertainties.
- Second, the idea of a “ratio” is a conceptual simplification, although it appears to be a robust simplification. In reality, the relationship between emissions and warming is only approximately linear; warming is a function of many climate processes. For a discussion of the complex relationship between emissions and warming and the limits of the ratio construct, see Full Technical Working Group Report, §5.5.1.
- Third, the simple variables listed above are not descriptively complete. On the one hand, there are greenhouse gases other than CO2 that can force climate change — methane, nitrous oxide, and the fluorinated gases used as refrigerants. Additionally, surface temperature is an incomplete metric of climate change — most importantly, ocean temperature change (which heavily drives ice melt and sea level rise) moves on a different time scale from atmospheric temperature change. Finally, of course, regional impacts vary. Technical Summary, §1.3.2.
Applying physical science to set emissions budgets
The Paris Agreement sets a compromise goal of limiting global warming to 2ºC while “pursuing efforts” to limit warming to 1.5ºC. The concepts above can be used to estimate approximate budgets for cumulative additional emissions that are consistent with this goal. Applying adjustments for non-CO2 warming (methane, etc.) and earth system feedbacks, the IPCC offers the estimates for allowable additional CO2 emissions below. The IPCC assigns only “medium confidence” to these estimates given the multiple uncertainties; the uncertainties cannot be mechanistically combined to produce a defined uncertainty range. However, the uncertainties attributable to the ratio alone generate a “likely” range that is hundreds of GtCO2 wide.
Table 1: Remaining CO2 emission budgets as of January 1, 2020 for alternative global warming limits
| Global Warming Limit | Central Estimate | Ratio uncertainty* alone |
|---|---|---|
| 1.5ºC (no overshoot**) | 500 GtCO2 | 400 to 650 GtCO2 |
| 2ºC | 1350 GtCO2 | 1150 to 1700 GtCO2 |
** Overshoot refers to the idea that we blow the budget and exceed 1.5º in warming, but then use still-to-be-developed-at-scale carbon removal technologies to bring atmospheric carbon back down to a level that will stabilize temperatures at 1.5º of warming.
Allocating emissions budgets
Given the warming limits chosen by the Paris Agreement, setting emissions reductions goals for the world is a conversation about how to distribute the remaining carbon budget over time and among countries.
Allocating emission budgets across time
Focusing first on the issue of timing, global CO2 emissions were running at 38 GtCO2 annually in 2019 (AR6, Working Group 3 Figure SPM.1) so the remaining budgets in Table 1 will be exhausted within a few decades. To preserve the possibility of living within the 1.5ºC limit, rapid reduction of emissions during the 2020s is necessary. The 2ºC limit leaves a little more room. The chart shows the reductions computed as necessary based on IPCC’s illustrative pathways that keep cumulative emissions within budget.
Table 2: Percentage reductions in global GHG emissions* from 2019 level needed to stay within budgets
| Global Warming Limit | Likelihood target** | 2030 Reduction*** | 2040 Reduction*** |
|---|---|---|---|
| 1.5ºC (no overshoot) | >50% (as likely as not) | 47% | 69% |
| 2ºC | >67% (likely) | 32% | 49% |
**Likelihood targets refer to probability that the schedule will yield the desired limited warming. They are set to reflect the language of the Paris Agreement — “Holding the increase . . . below 2°C . . . and pursuing efforts to limit the temperature increase to 1.5°C . . .”
*** Computed from figures extracted from the graph in Figure SPM.4 AR6, Working Group 3 Full Report. Note that this figure uses modeled emissions levels starting from 2015 for all of its modeled pathways. The figure shows that estimated actual emissions (estimated at 59 GtCO2e) were already drifting above modelled emissions in 2019 (roughly 55 GtCO2e) and the actual is the level used as the base to cut from in this Table. As a result, the figures shown here differ slightly from those shown in Table 3.1 of the AR6 Synthesis Report which compares to the modeled 2019 level (in 2030, 43% for 1.5º and 21% for 2.0º).
The IPCC modeling of emissions pathways is vastly sophisticated, but the need for the 2030 and 2040 reductions shown in Table 2 does check to a much simpler model. Declining emissions are necessarily visualized as a line or curve sloping downwards — barring global disasters like the COVID pandemic, as the world economy rolls forward, one does not expect huge discontinuities in emissions rates. Worldwide annual CO2 emissions are running at roughly 8% of the cumulative budget for the 1.5ºC limit, so on any pathway, the early years chew up the budget fast. As an exercise in understanding the necessity of early cuts, the attached spreadsheet creates a simple schedule of emissions reductions with only the constraints that (a) emissions have a steady percentage decline and (b) cumulative emissions remain in total below the budgeted amounts. This yields 2030 and 2040 reductions similar to the IPCC modelling reflected in Table 2.
Two points that emerge from inspection of the simpler model:
- If global emissions remain roughly constant, the 1.5ºC budget will be exhausted by approximately 2033 and the 2ºC budget by approximately 2050. To the same effect, see AR6, Synthesis Report, IPCC, Climate Change 2023, Summary for Policymakers, §B.5.3, which further estimates that existing fossil infrastructure if operated as today for its lifetime will exhaust the 2ºC budget.
- If we were to achieve deep early cuts globally, the cumulative total of much lower emissions in later decades would be below the statistical noise level. For example, in the simplified 1.5ºC pathway, emissions after 2040 account for under 20% of the budget, an amount not statistically distinct from zero, given the uncertainty about the budget. So, the real challenge is (or was) to achieve deep early emission cuts as opposed to reaching precisely net zero.
Note on Massachusetts Climate Goals: Massachusetts goal setting documents reference the deep cuts identified by the IPCC as necessary to stay within the 1.5º limit for global warming. Executive Order No. 594 (2021), Clause 2; Clean Energy and Climate Plan for 2025 and 2030 (2022), page 4; Recommendations of the Climate Chief (2023), page 4. However, The Massachusetts’ emissions reduction target for 2030, a 50% cut from 1990 levels, equates to only a 34% cut from 2019 levels since Massachusetts emissions in 2019 were already 24% below 1990 levels. Table 2 above shows that global emissions need to drop further than that from 2019 levels by 2030. Moreover, Table 2 does not reflect any consideration of the necessary allocation of that global emissions cut across developed and developing nations. As further discussed below, even deeper emissions cuts (in fact, negative emissions) would be necessary among developed nations to limit warming to 1.5º, given emissions growth among developing nations.
Allocating emission budgets among developed and developing nations
International climate conversations have consistently recognized the large share of the cumulative carbon budget historically spent by the most prosperous developed countries as well as the need for less developed countries to raise their standard of living. While leaving actual commitments up to each country, the Paris agreement generally defines asymmetric obligations:
Developed country Parties should continue taking the lead by undertaking economy-wide absolute emission reduction targets. Developing country Parties should continue enhancing their mitigation efforts, and are encouraged to move over time towards economy-wide emission reduction or limitation targets in the light of different national circumstances.
Paris Agreement, Preamble Article 4, ¶4 (emphasis added)
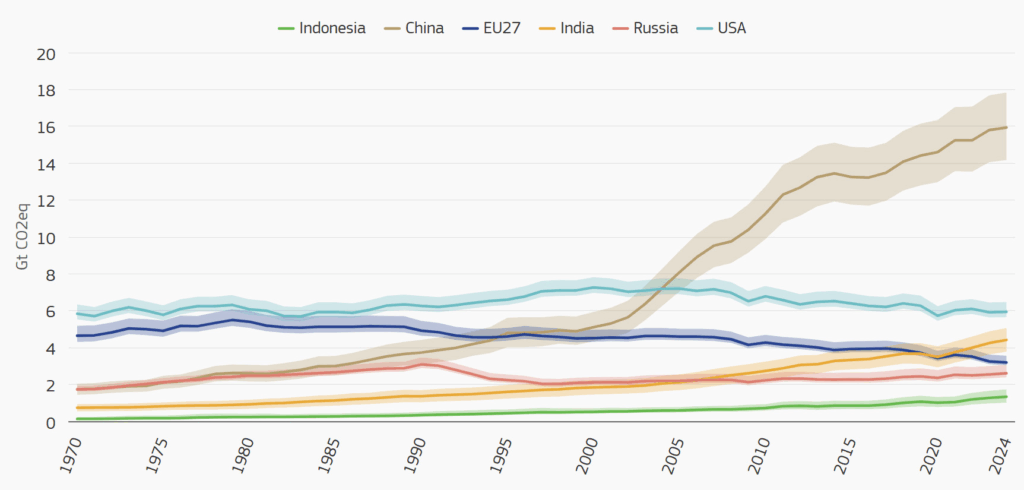
It is historically understandable to place burden of emissions reductions on developed nations, but developing nations now comprise the lion’s share of emissions, as shown in the graph from EDGAR, the Emissions Database for Global Atmospheric Research, the climate data agency of the European Commission.
GHG emissions in top emitting economies and estimated uncertainty (coloured bands), 1970-2024 (in Gt CO2eq)
Emissions budget outlook — stormy
The Paris Agreement does not impose specific emission reduction obligations on countries, leaving it up each country to decide what they can do. The results of this arrangement appear in EDGAR’s 2025 emissions report. See also the calculations in this supporting spreadsheet based on EDGAR data. Highlights include:
- In 2024, the United States and the EU27 accounted for only 17% of global GHG emissions, while China, India, and Indonesia together account for 40%. China alone accounts for 29%.
- Across the five years from 2019 to 2024, the countries identified as “developed” under the UNFCCC treaty, the countries listed in Annex I to the treaty, cut emissions by an average of 6%, while “developing”, non-Annex I countries, grew emissions by an average of 10%.
- The total emissions of the developing countries in 2024 (37.7 GtCO2e) were 62% above the entire world’s emissions in 1990 (23.2 GtCO2e). So even if developed nations were to cease emissions immediately, emissions would be 62% above 1990 levels world-wide.
- As of 2019, developed countries accounted for 33% of global GHG emissions. This suggests a thought experiment: Suppose that developed nations had begun deep emission cuts in 2020 and were to go so far as to achieve net zero by 2030, and suppose that developing nations had levelled their emissions growth as of 2020 instead of growing:
- in 2030, total emissions would be down 33% from 2020 (because all of the developed countries, which were 33% of the 2019 emissions total, would be down to zero, but developing country emissions would be unchanged)
- but this would not be a deep enough reduction to stay within the carbon budget for 1.5º of warming (see Table 2 above);
- we would be arguably on budget for 2º of warming, but developing countries would need to bear the entire burden of deep cuts starting in 2030.
- In reality, given the continued steady growth of emissions in developing countries and the modest declines in developed countries, world emissions rose 5% from 2019 to 2024. Given the early cuts required in Table 2, this increase means:
- The budget for 1.5º of warming will likely be exhausted by 2033 — even if we could turn the global curve downwards in 2026 or 2027, the high early decade emissions have already chewed up much of the budget. Compare this discussion from the World Resources Institute. See also Emissions Gap Report 2024: No more hot air … please! from the UN Environmental Program.
- The budget for 2º of warming is still theoretically viable, but the global cuts for both developed and developing nations in the 2030s and 2040s will need to be steep.
- The equities underlying the dominant narrative of developed vs. developing countries have somewhat shifted:
- China now has higher per capita emissions than 34 of the 43 “developed” countries;
- Six Persian Gulf oil-producing countries have per capita higher emissions than all of the “developed” countries.
- It nonetheless remains true that many countries may feel justified in further developing and increasing GHG emissions:
- Per capita emissions in China are still 38% below U.S. per capita emissions;
- Over 100 countries still have per capita emissions that are 75% below U.S. per capita emissions.
It is the final observation that gives me the greatest pause. It seems inevitable that the developing countries will continue to grow emissions. While we can hope for green technologies that offer non-fossil pathways to development, that doesn’t seem to be happening at scale yet, given the 10% emissions growth over the past 5 years among developing countries. The most recent year of growth 2023-24 is just slightly slower, 1.8% equating to a 9% 5-year rate. While setting records for clean energy deployment, China continued to rapidly expand coal capacity in 2024 — “instead of replacing coal, clean energy is being layered on top of an entrenched reliance on fossil fuels.” Similarly, India proposed a record number of new coal plants in 2024.
Emission standards are a pointless, pennywise drops in the bucket. If you want to do something meaningful stop upgrading your phone unnecessarily and stop ordering off Amazon. Maybe demand Amazon have a made in the USA setting.