
Summary
- This post offers updated estimates and analysis of trends for CO2 emissions from buildings for Massachusetts and other northeastern states. The post does not estimate emissions from the other two major emissions sectors — transportation and electric power generation.
- Overall emissions from the building sector have been close to flat in Massachusetts and in the Northeast as a whole since 2010 when efforts to cut emissions ramped up. Warming winters and efforts to cut emissions have been offset by other factors.
- CO2 emissions from buildings can be driven downward by warming winters, but can be driven upwards by population growth, economic growth, and increases in square footage of housing per person. Increases in housing square footage per person can occur due to falling household size and/or rising size of built housing units.
- Among Northeast states, only Maine shows a statistically significant overall down trend between 2010 and 2023, but this trend was driven entirely by a drop in industrial emissions — Maine’s commercial and residential emissions rose through the period.
- While the overall trend since 2010 is not encouraging, it is too soon to evaluate the impact of Massachusetts’ increased investment in electrification which began in calendar 2022.
Note on sources
The Energy Information Administration is the primary source for data on fossil fuel consumption at the state level. They have just released data for calendar 2023. Over the coming months, this data will be incorporated by the federal EPA into its State Inventory and Projection Tool and ultimately incorporated into Massachusetts’ official greenhouse gas inventory. See Methodology Appendix A to Statewide Greenhouse Gas Emissions Level: 1990 Baseline Update, May 2021.
In this post, we use the EIA primary data directly to get a quick update on trends. Except as noted, all data in this post is extracted from EIA’s comprehensive series update as of March 28, 2025 and all computations, including computations of statistical significance) are detailed in the attached spreadsheet.
Residential Emissions Trends
Chart R1 below compares CO2 emissions from residences in Massachusetts to heating degree days by year from 1990 to 2023. Several observations can be made from Chart R1:
- Over the past 33 years, Massachusetts has been getting warmer. The orange dotted line shows the trend (on average, 20 fewer heating degree days per year). In 2023, Massachusetts had its lowest heating degree days since 1990 (in fact, since 1960). The year-to-year fluctuations are still dramatic and annual progression only explains 16% of the variance in HDD, but the annual downtrend is significant with p<.005.
- As one would expect, emissions (the blue line) are highly correlated with heating degree days — heating is the primary use of fossil fuels in homes in our cool climate. Heating degree days explained 54% of the annual variance in Massachusetts residential emissions (p<.000001).
- Although 2023 was our warmest year, residential emissions were actually lowest in 2016 at 11.4 MMTCO2.
- Since our emissions reductions efforts got underway in 2010, the trend in emissions has been slightly downward. Linear regression indicates .055 MMTCO2 decrease per year, a pace sufficient to reduce emissions by 2.2 MMTCO2 or a little more than 16% by 2050. However, the trend is not statistically significant and with adjustment for declining heating degree days, the trend has actually been slightly upward since 2010: Growing population, declining household size, increasing per unit square footage have all tended to offset our investments in energy efficiency and electrification. See How much is the efficiency of the existing housing stock improving?
- Residential emissions did decline, even accounting for weather, from 1990 to 2009. Emissions declined during the decades prior to our Massachusetts emissions reductions efforts due to several long term trends including appliance efficiency improvements and fuel switching. See Energy Savings before Mass Save, 1972-2009.
- Emissions in 2023 were slightly below the the level predicted by degree days, but not by a significant amount (prediction not shown in graph, but included in attached spreadsheet). In fact, 2023 emissions were above 2016 emissions even though 2016 was a colder year. We cannot draw any inference about the impact of the increased investment electrification which began in calendar 2022.
Chart R1: MA Residential CO2 Emissions (MMTCO2) from Fossil Fuel Combustion
vs Heating Degree Days: 1990-2023
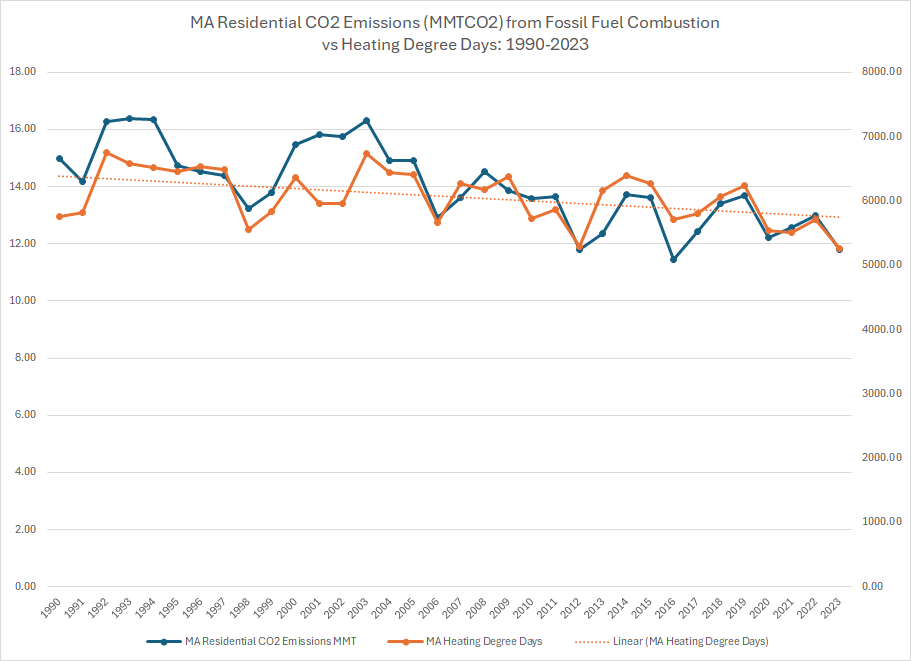
Chart Technical Notes:
1) MMTCO2 is million metric tons of carbon dioxide.
2) The emissions series here is based on applying EIA emissions factors to SEDS fossil fuel consumption in the residential sector. Due primarily to slightly different conversion factors from consumption to emissions, the computation here differs slightly from the state’s official greenhouse gas inventory. The average of the absolute value of the difference across all years is 0.1MMtCO2 and the maximum absolute value in any year is 0.2MMtCO2.
3) This series includes only CO2 emissions excludes CH4 and N2O emissions, which have amounted to 0.1MMTCO2e in recent years.
4) The EIA SEDS data includes heating degree data for reference. The ultimate source of SEDS state level HDD data is NOAA.
Chart R2 below focuses on the period of more intense policy intervention beginning in 2010 and compares emissions in Massachusetts to emissions in other Northeast states. Each state’s emissions series is indexed to its a percentage of its 2010 level to put the series on the same scale. Several observations can be made from Chart R2:
- Emissions in all of the Northeast states fluctuate according to weather as do emissions in Massachusetts.
- There is no dramatic down trend in emissions in any of the Northeast states and several states increased emissions.
- Massachusetts achieved the greatest decline (although very modest) from 2010 to 2023.
Chart R2: Residential CO2 emissions in Northeast States — MMTCO2 indexed to 2010 level (MA shown as bars, other states as lines)
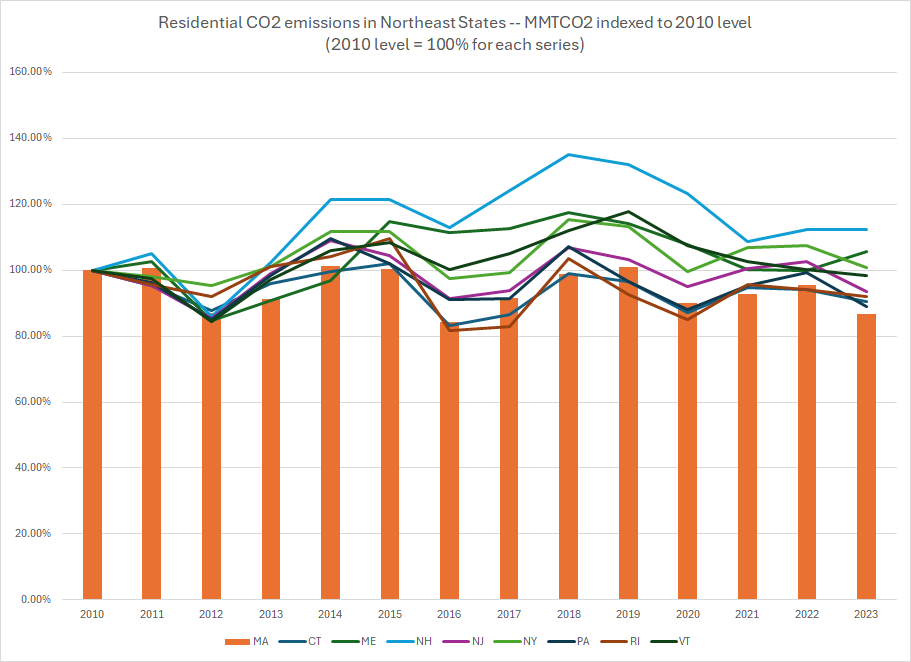
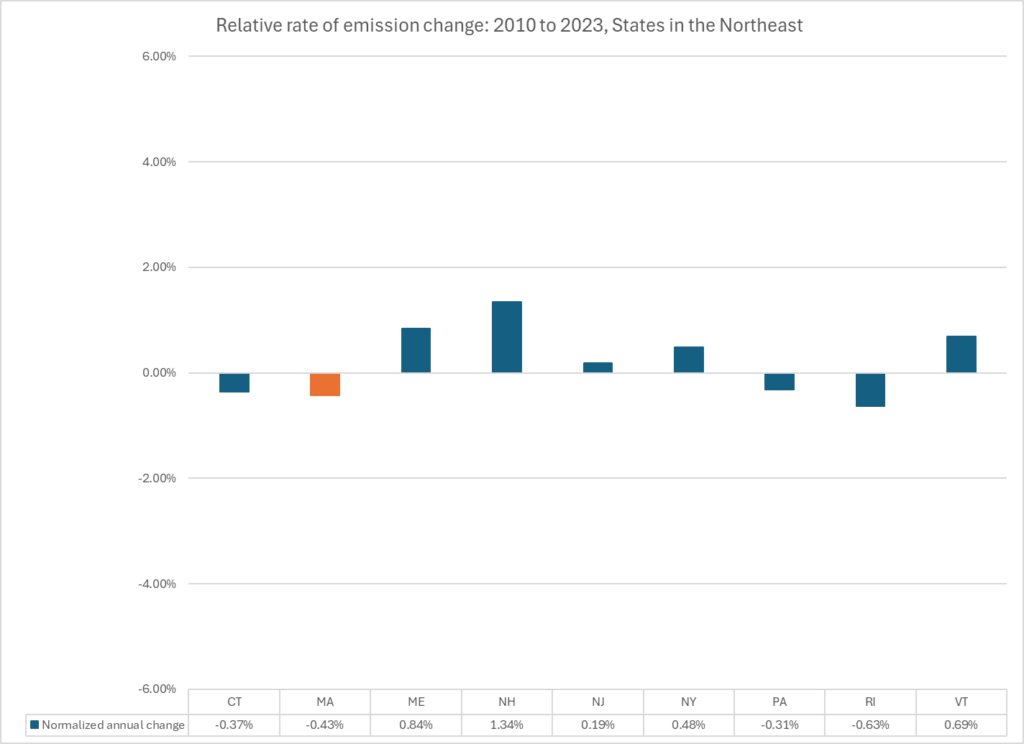
Chart R3 puts a finer point on the comparison in Chart R2, comparing the slopes of the trend lines for residential CO2 emissions, normalized to the mean for the period. Massachusetts shows the second greatest relative decrease behind Rhode Island (based on regression analysis as opposed to the first and last comparison in Chart R2). However, none of the trends are statistically different from flat — more precisely, none of the regression line slopes are different from zero at the 0.05 significance level.
Chart R3: Residential CO2 emissions in Northeast States — MMTCO2 trends from 2010 to 2023 normalized to the mean for each state (none statistically significant at p<.05 level)
Commercial Emissions Trends
Charts C1 through C3 apply to emissions from the commercial sector, which includes nonprofit and government buildings. The charts reproduce the same computations as in charts R1 through R3 above. These charts suggest the following observations:
- Emissions in the commercial sector are driven by heating needs to a lesser extent than in the residential sector: Weather only explains 6.5% of the variance between 1990 and 2023 and the association is not statistically significant.
- Commercial emissions have trended slightly upward since 2010 in Massachusetts and 5 other Northeast states (CT, MA, ME, NH, PA, VT). The up trend is statistically significant except in Maine which is close to flat. The only northeast state with a statistically significant decrease is New Jersey.
Chart C1: MA Commercial CO2 Emissions (MMTCO2) from Fossil Fuel Combustion
vs Heating Degree Days: 1990-2023
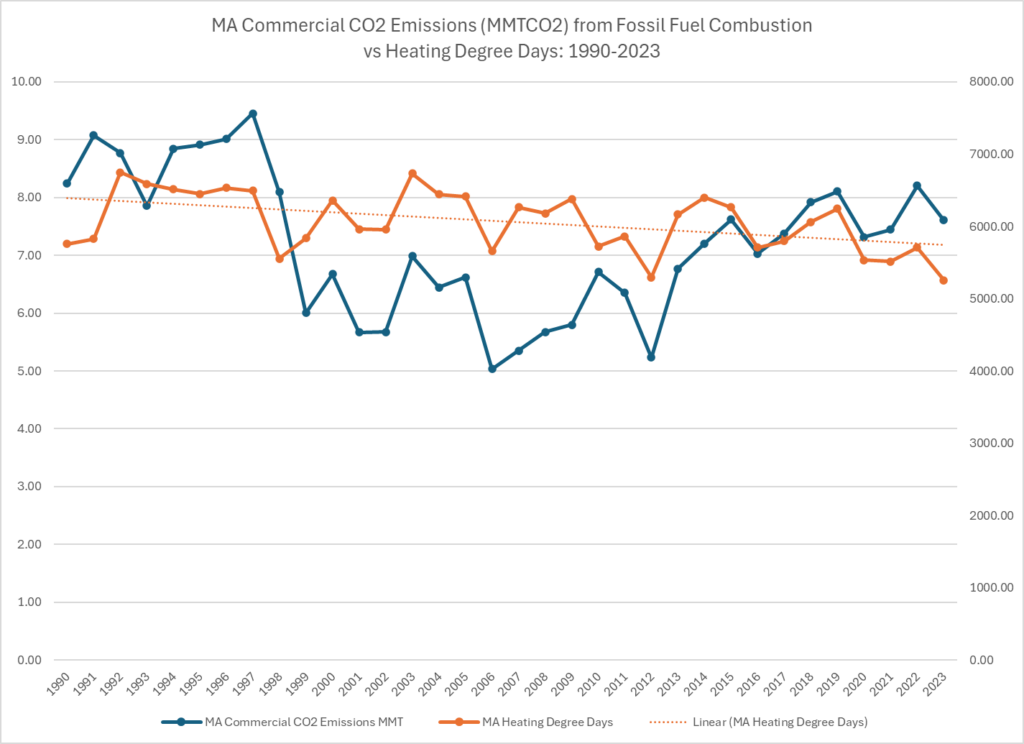
Chart C1 Technical Note: See Chart R1 notes.
As for the comparison between this chart and DEP’s GHG inventory, the average of the absolute value of the difference across all years is 0.1MMtCO2 and the maximum absolute value in any year is 0.2MMtCO2. (Same values as in chart R1).
Chart C2: Commercial CO2 emissions in Northeast States — MMTCO2 indexed to 2010 level (MA shown as bars, other states as lines)
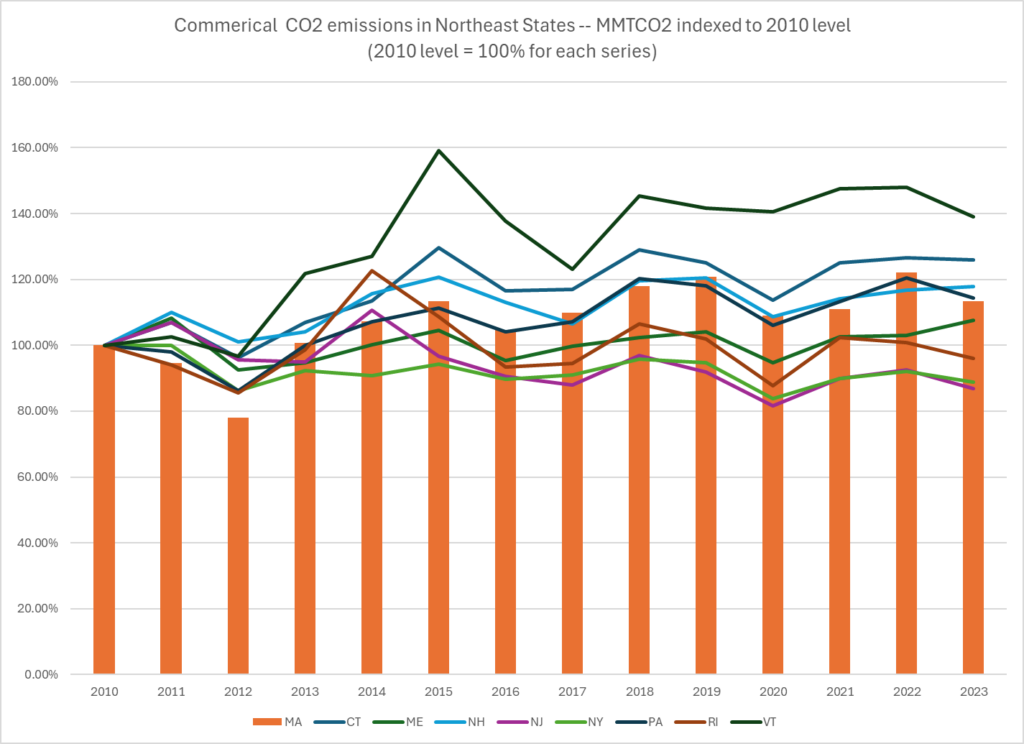
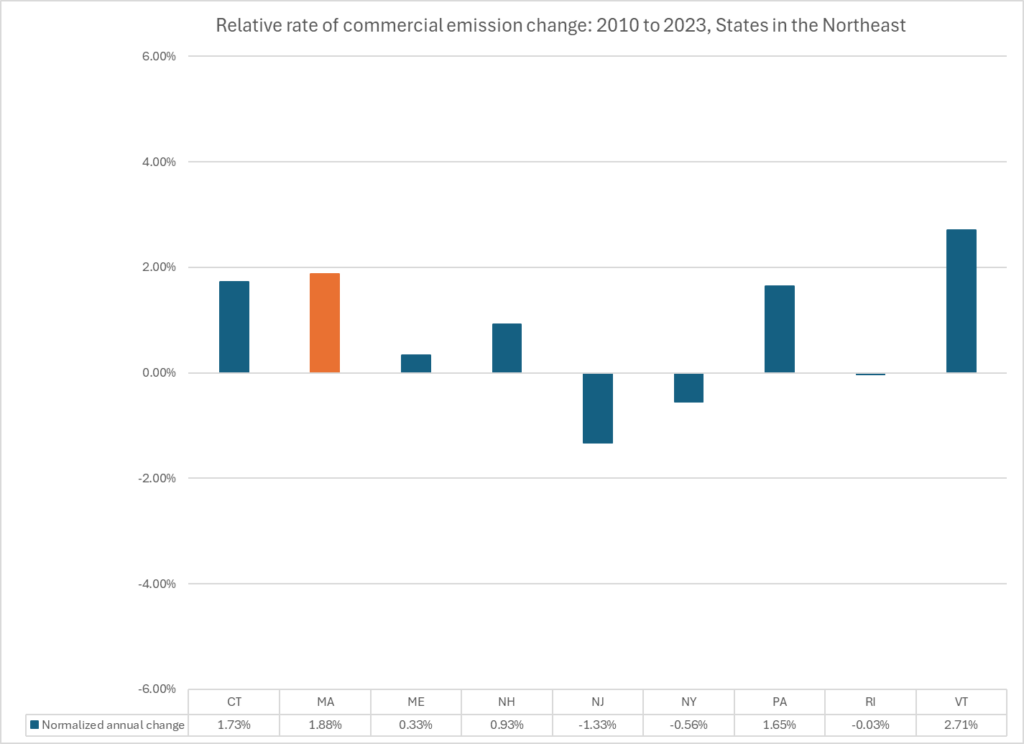
Chart C3: Commercial CO2 emissions in Northeast States — MMTCO2 annual change rates from 2010 to 2023 normalized to the mean for each state (only New Jersey had statistically significant decline)
Industrial Emissions Trends — data more rough
Charts I1 through I3 present emissions from the industrial sector including heating and cooling emissions (fossil fuel combustion), but not process emissions.
- Emissions in the industrial sector are driven by winter weather to a lesser extent than in the residential sector, but surprisingly, at least in the period analyzed here to a slightly greater extent in than the commercial sectors : Weather explains 13% of the variance between 1990 and 2023 and the association is statistically significant at the p<.05 level.
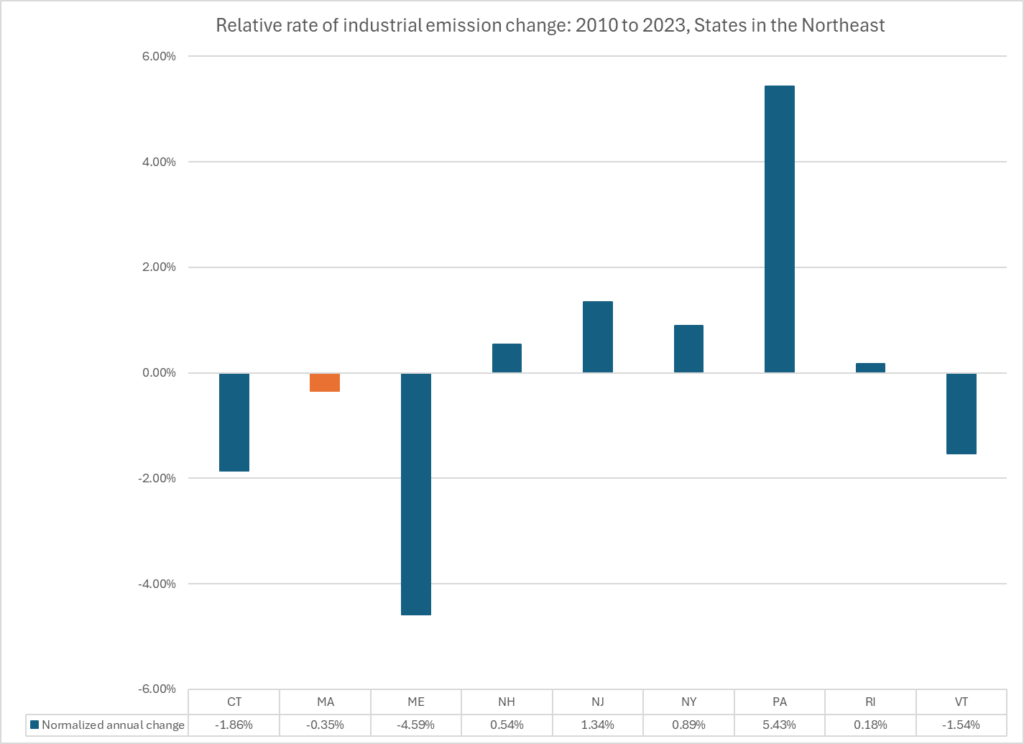
- Industrial emissions trends have diverged in Northeast states between 2010 and 2023, with three states rising significantly (NY, NJ, PA), three states falling significantly (CT, ME, VT) and the other states not changing significantly (MA, NH, RI).
Disclaimer: Industrial sector emissions computations are complicated and may work differently in different states. The data presented here reconciles to Massachusetts, but not to all other states. The charts in this section are based on straightforward application of EIA emissions factors to the following SEDS physical consumption time series for the industrial sector: Coal, Distillate Fuel, Hydrocarbon Gas Liquids (propane, etc.), Kerosene, Natural Gas, Motor Gas, Residual Fuel. Emissions so computed based on this set of time series compare closely to MA DEP’s GHG Inventory (Appendix C, Tab CO2_FFC): The average of the absolute value of the difference across all years is 0.1MMtCO2 and the maximum absolute value in any year is 0.3MMtCO2. However, it does not reconcile well to industrial emissions inventories in other states. For example, Maine reports roughly 25% lower industrial emissions (although with the same downtrend) than would be explained by this set of time consumption series. Conversely, Pennsylvania reports emissions that as much as 50% higher for combustion of fossil fuels only, but with a more modest uptrend. Inclusion of consumption time series for additional petroleum products (many of which are typically used for non-fuel purposes) generates results that are further from ME and MA’s reports while closer to PA’s report.
Chart I1: MA Industrial CO2 Emissions (MMTCO2) from Fossil Fuel Combustion
vs Heating Degree Days: 1990-2023
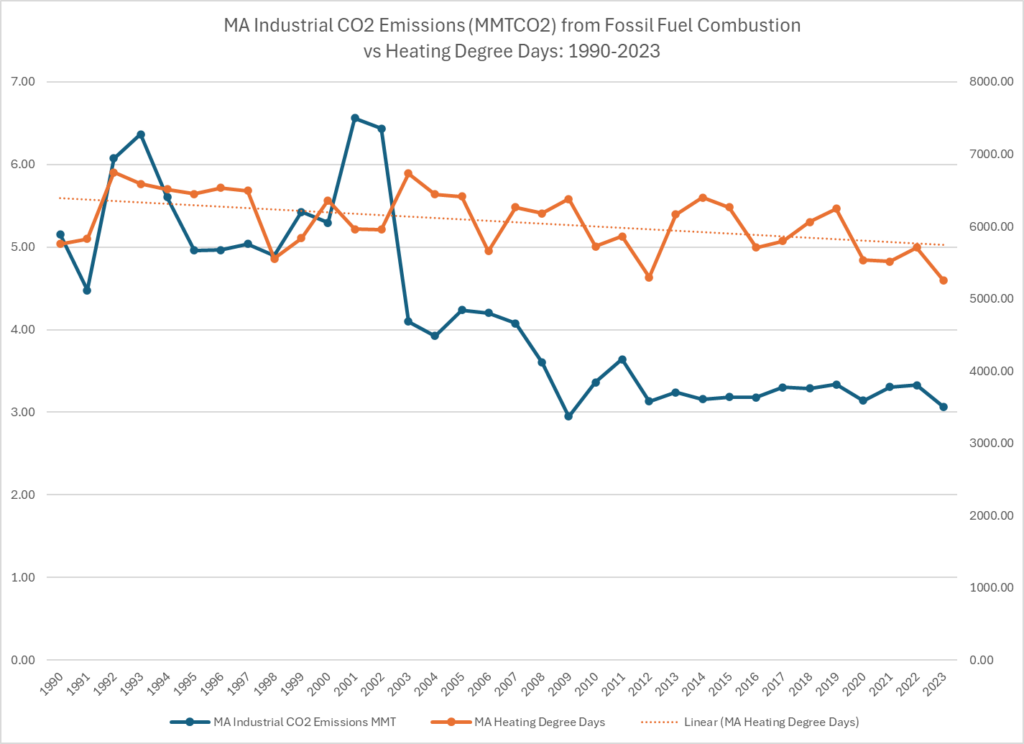
Chart I1 Technical Note: See Chart R1 notes.
Chart I2: Industrial CO2 emissions in Northeast States — MMTCO2 indexed to 2010 level (MA shown as bars, other states as lines)
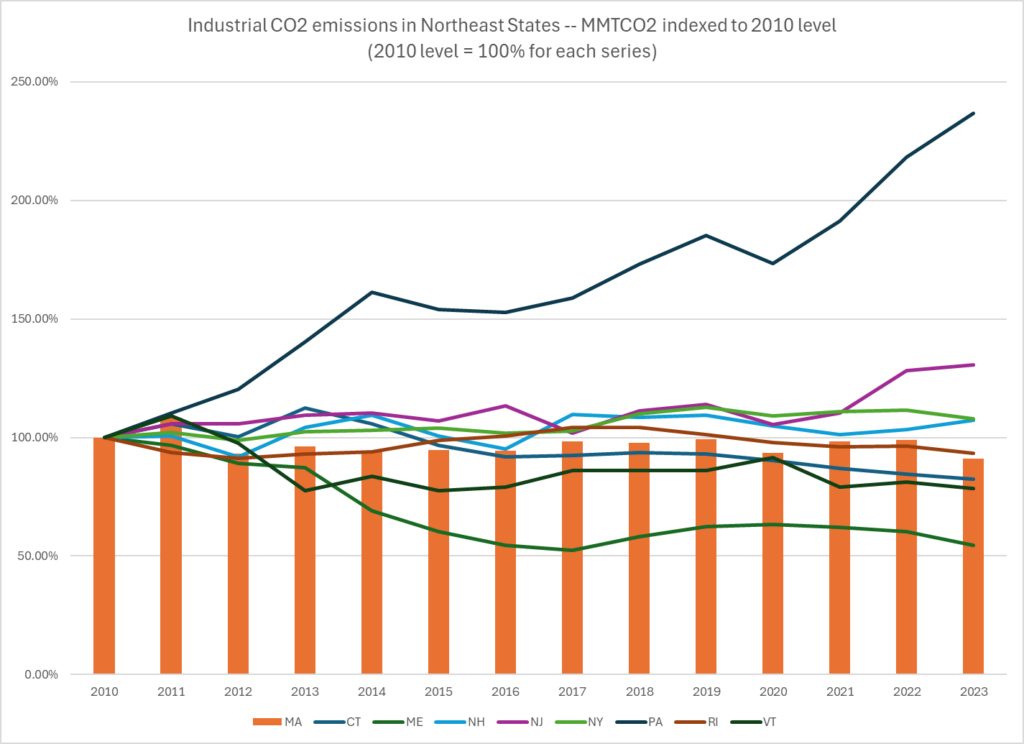
Chart I3: Industrial CO2 emissions in Northeast States — MMTCO2 annual change rates from 2010 to 2023 normalized to the mean for each state (only CT, VT, ME, had statistically significant declines)
Overall Trends — includes rough industrial emissions (see previous section)
Chart RCI1 shows the overall trend in building energy consumption in Massachusetts: The overall trend was down from 1990 to 2010. The overall trend from 2010 to 2023 was slightly upward, but not statistically different from flat. (The green line is from the official Greenhouse gas inventory and the stacked bars combine the sectors analyzed above. The green line is usually slightly higher because it includes methane and other green house gases, while the analysis developed here only covers CO2 emissions per se. Additional variations come from choice of factors from converting energy use to emissions. However, the trends are close to the same — the average difference is .4MMTCO2.)
Chart RCI1: MA CO2 Emissions (MMTCO2) from Fossil Fuel Combustion in Buildings — Residential, Commercial, Industrial
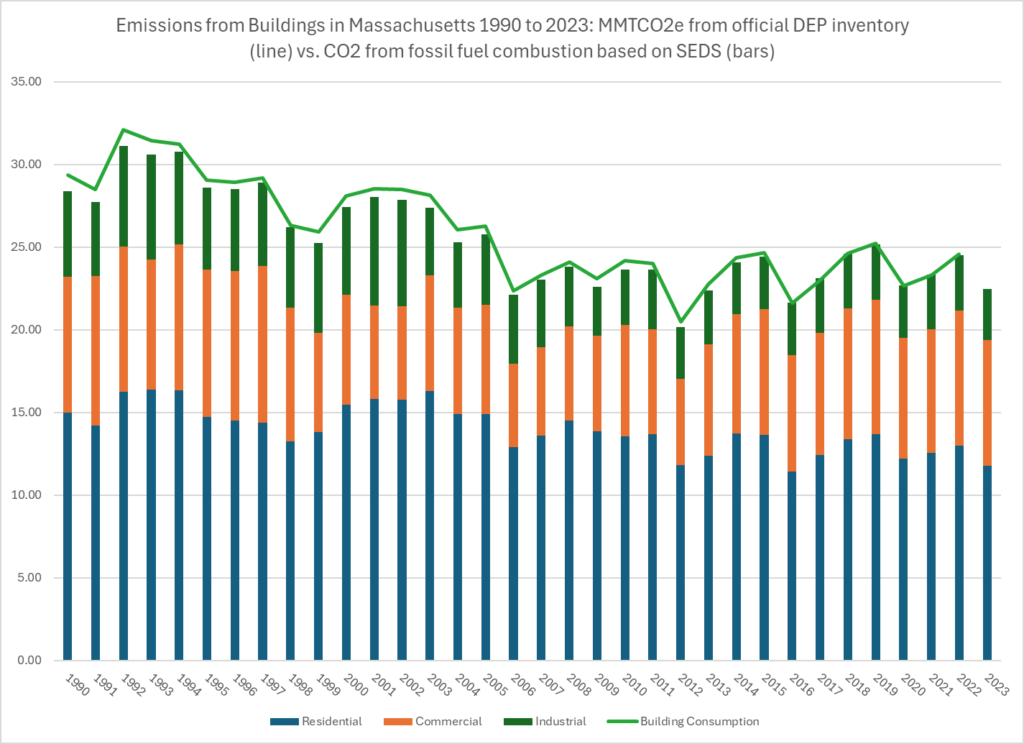
Chart RCI2 shows the slight overall uptrend in emissions in Northeast States from 2010 to 2023. The uptrend is statistically significant at the p<.05 level.
Chart RCI2 CO2 Emissions (MMTCO2) from Fossil Fuel Combustion in Buildings — Northeast States, 2010 to 2023
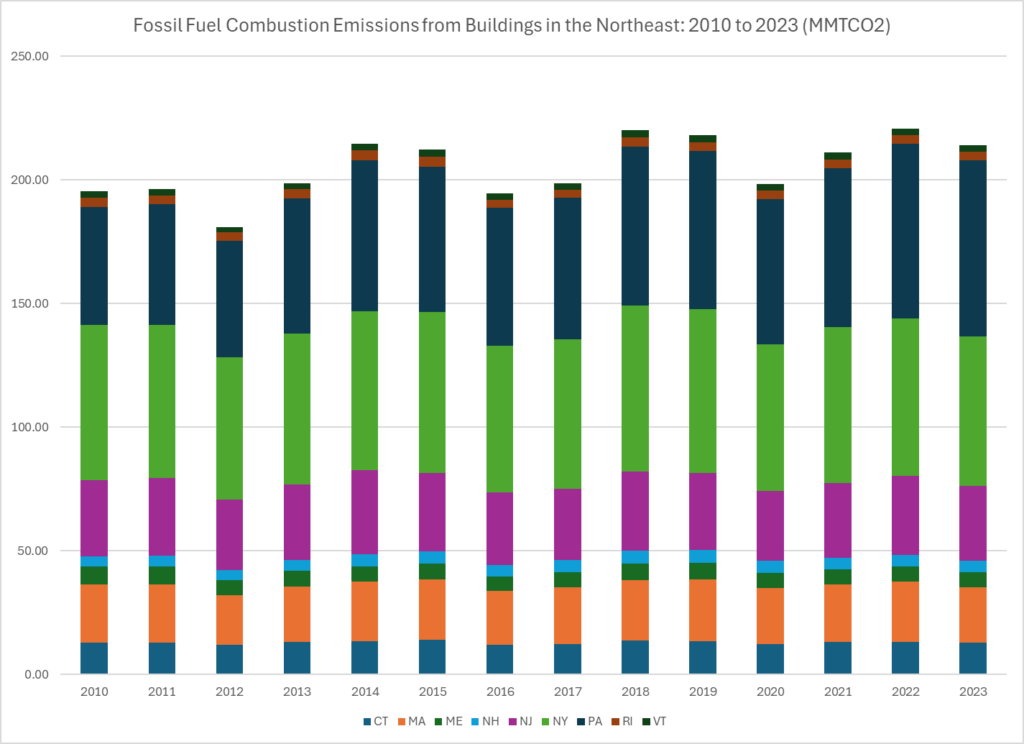
Chart RCI3: CO2 emissions from Buildings in Northeast States — MMTCO2 annual change rates from 2010 to 2023 normalized to the mean for each state (only Maine has statistically significant decline)

Resources
- Energy Information Administration, State Energy Data System, 2023 Updates (primary source for all data in this post; computations in this post were implemented consistently for all 9 states — as noted below, individual states make various adjustments to this primary source data)
- Energy Information Administration, Emissions Factors
- Spreadsheet of computations and statistical tests
- MS Access Database of SEDS Series as of March 28, 2025
- Official State Greenhouse Gas Inventories (these documents are not sources for this post — all data is directly from SEDS; Massachusetts’ inventory was carefully compared; the other state official reports were only spot checked for general consistency; as to industrial emission they do differ materially)
- Connecticut
- Massachusetts
- Maine
- New Hampshire (emissions inventory not located)
- New Jersey (appears to use more inclusive accounting for industrial emissions)
- New York (reports higher numbers generally than here; uses 20 year global warming potential which raises impact of methane)
- Pennsylvania (appears to use more inclusive accounting for industrial emissions)
- Rhode Island
- Vermont Green House Gas Inventory