
This post simply describes the bus service changes that have occurred in my senate district over the past three years. A follow-on post puts the changes in the context of the MBTA’s larger service planning challenges. Sources for all statistics are provided in this spreadsheet.
Of the 28 bus routes serving my senate district, the five routes below experienced cuts of over 20% in total trip volume. Service changes for each of these routes are detailed in the Detail for District Routes that Lost Service section. All other routes experienced modest cuts or modest increases as detailed in the Additional District Data section.
| Route | Name | October Trips 2019 | October Trips 2022 | October Trip Cut 2019 to 2022 |
|---|---|---|---|---|
| 55 | Jersey Street & Queensberry Street – Copley Station* | 1740 | 532 | -69% |
| 71 | Watertown Square – Harvard Station | 5548 | 4381 | -21% |
| 73 | Waverley Square – Harvard Station | 6251 | 4221 | -32% |
| 504/502 | Watertown Yard – Federal Street & Franklin Street | 2857 | 1791 | -37% |
| 501/503 | Brighton Center – Federal Street & Franklin Street | 1951 | 1367 | -30% |
| 554 | Waverley Square – Newton Corner | 560 | 240 | -57% |
* 55 Bus ran to Park Street before COVID service cuts
Detail for District Routes that Lost Service
55: Jersey Street & Queensberry Street – Copley or Tremont Street
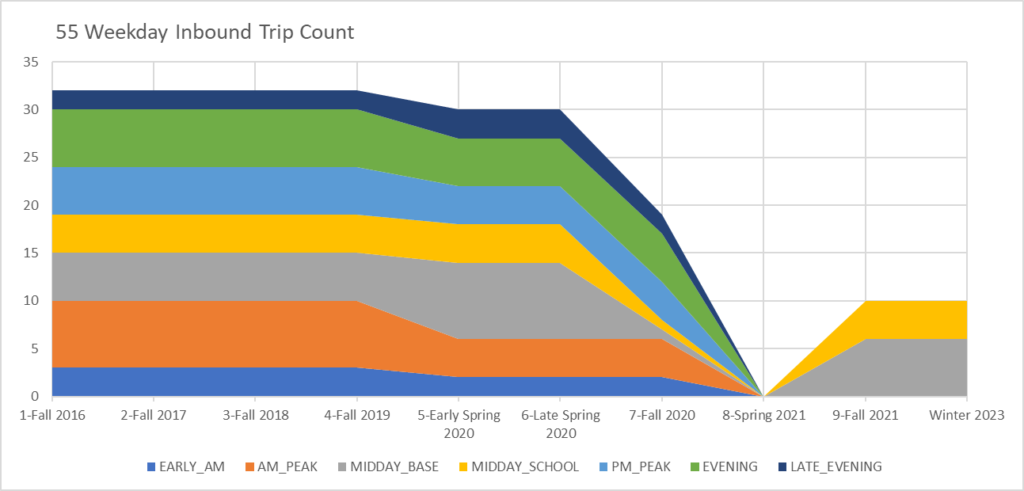
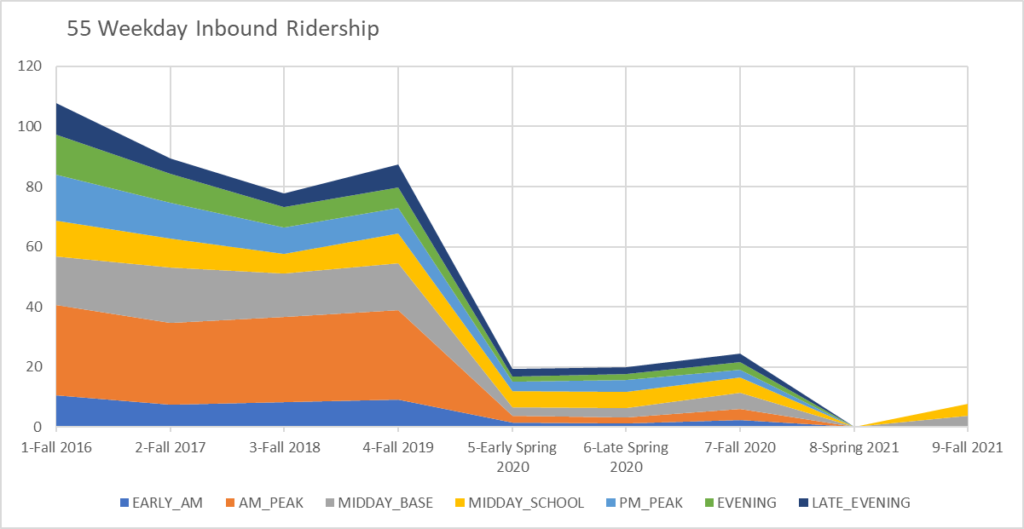
The 55 bus has two route variants: Fenway to Copley Square and Fenway to downtown (Tremont St). Pre-COVID, the longer downtown route ran all day and into the early evening, while the shorter Copley route ran in the late evening and on weekends. Early in the pandemic, in the Spring of 2020, the longer downtown variant was eliminated, while preserving the combined total trip count by shifting day and evening service to the shorter Copley route. The Copley route connects to the Green Line for those heading further downtown. While connecting downtown service was preserved in the Spring of 2020, ridership nonetheless collapsed and stayed low into the Fall of 2020. The 55 route was eliminated during a period covering Spring 2021. After considerable outcry, midday and weekend runs were restored at roughly pre-COVID levels on the Copley Route in the Fall of 2021. The charts below group both route variants together.
| Route Variant | Before 3/2020 | Spring 2020 to Fall 2020 | Spring 2021 | Fall 2021 Onward |
|---|---|---|---|---|
| Fenway (Queensberry Street) to Copley | Evening, Late Evening, Weekends | Early AM to Late Evening, Weekends | None | Mid Day, Weekends |
| Fenway (Queensberry Street) to Downtown (Tremont Street) | Early AM to Evening | None | None | None |
55 Bus Weekday Inbound Trip Counts by Season and Time Period (Combining Route Variants)
55 Bus Weekday Inbound Ridership by Season and Time Period (combining route variants)
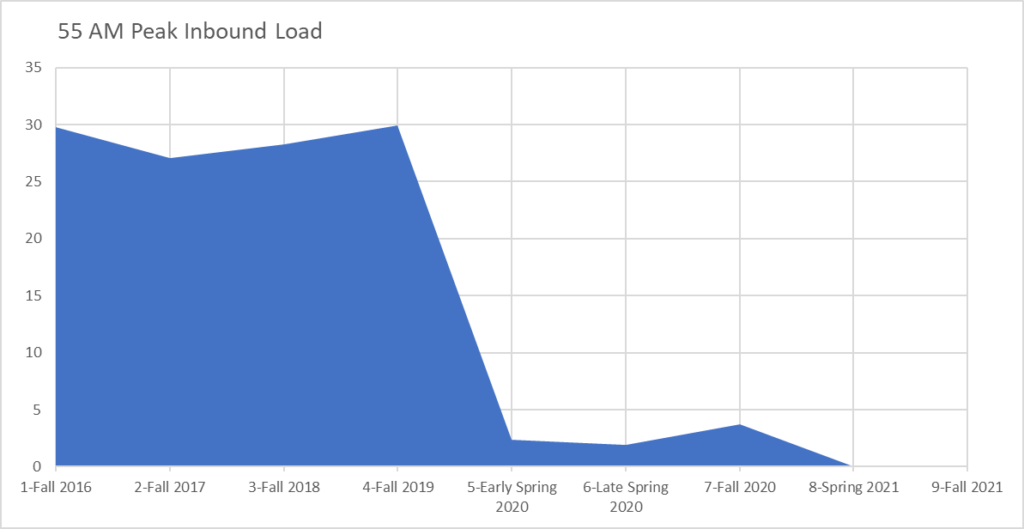
55 Bus Weekday Inbound Maximum Loading by Season and Time Period (Average at most heavily loaded stop for any variant running in time period)
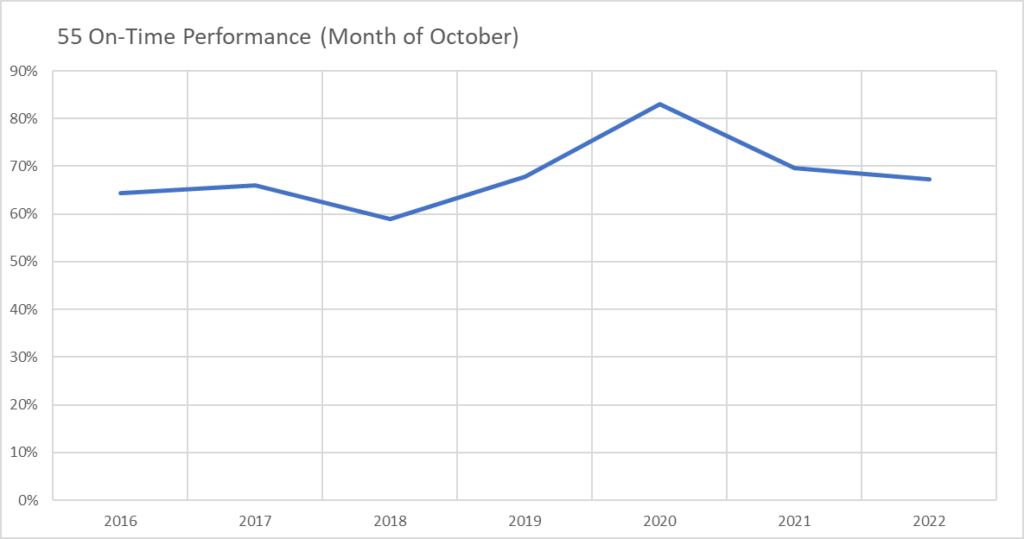
55 Bus On Time Performance Rate — Month of October
71: Watertown Square – Harvard Station
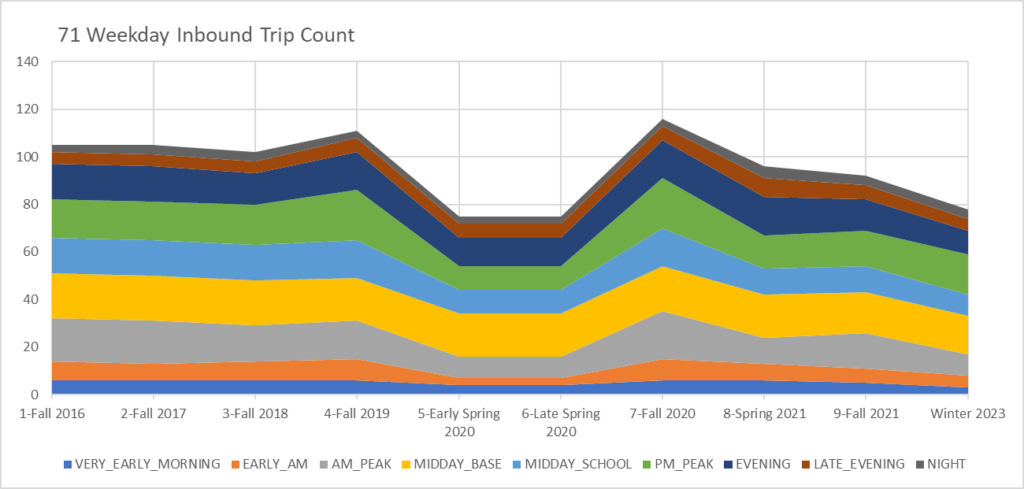
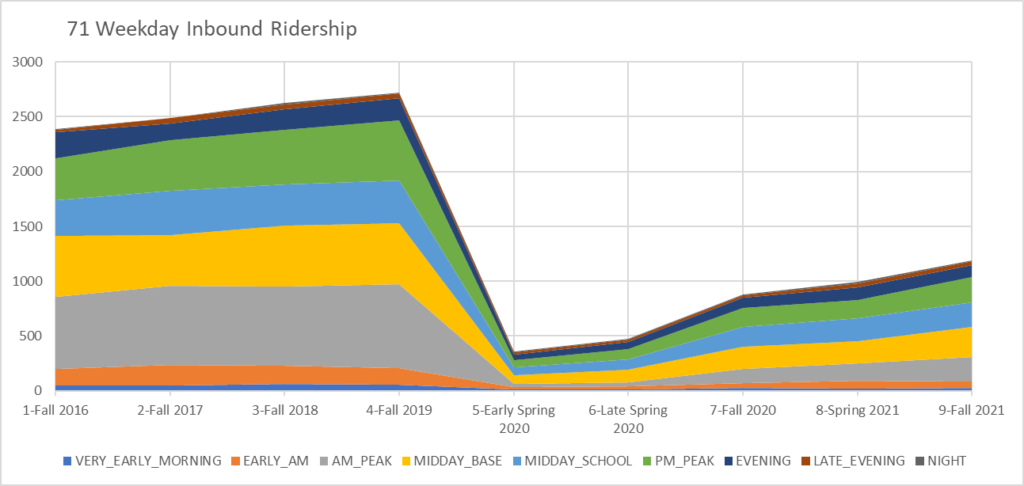
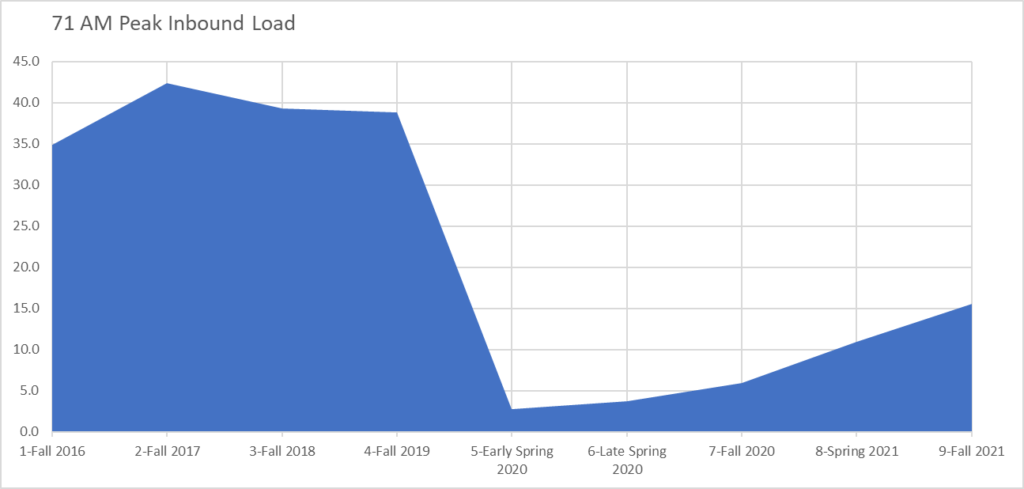
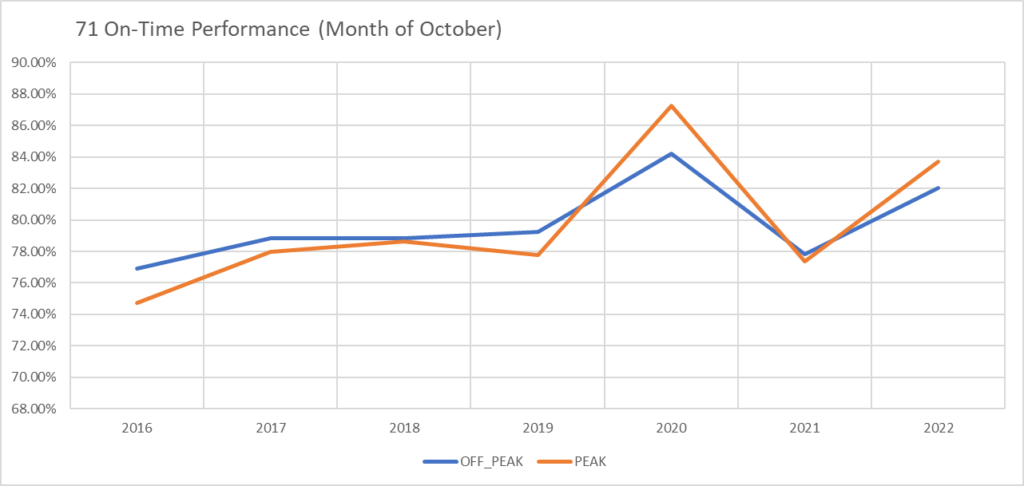
The 71 bus experienced continued service at a reduced level through the pandemic. Ridership nonetheless collapsed and did not swiftly recover. As of the Fall of 2021, AM peak ridership was 29% of pre-COVID AM peak ridership. Additional service reductions were imposed that continued into the Winter of 2023. It will be interesting to see the ridership levels as of Fall 2022 when those become available. Note that the file documentation indicates that some trips (and ridership) may be missing on this route for Spring 2021.
71 Bus Weekday Inbound Trip Counts by Season and Time Period
71 Bus Weekday Inbound Ridership by Season and Time Period
71 Bus Weekday Inbound Maximum Loading by Season and Time Period (Average at most heavily loaded stop)
71 Bus On Time Performance Rate — Month of October
73: Waverley Square – Harvard Station
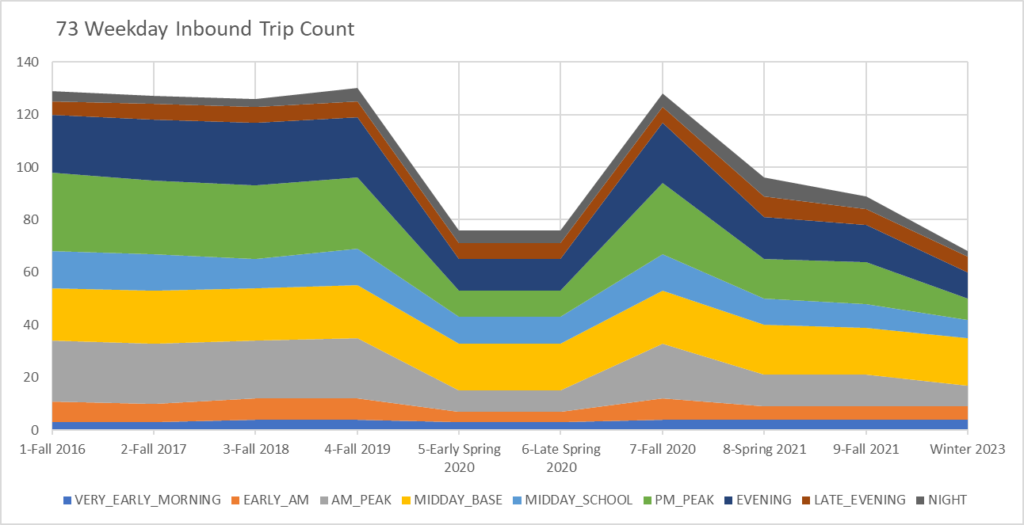
Like the 71 bus, the 73 bus experienced continued service at a reduced level through the pandemic. Ridership nonetheless collapsed and did not swiftly recover. As of the Fall of 2021, AM peak ridership was 33% of pre-COVID AM peak ridership. Additional service reductions were imposed that continued into the Winter of 2023. It will be interesting to see the ridership levels as of Fall 2022 when those become available. Note that the file documentation indicates that some trips (and ridership) may be missing on this route for Spring 2021.
73 Bus Weekday Inbound Trip Counts by Season and Time Period
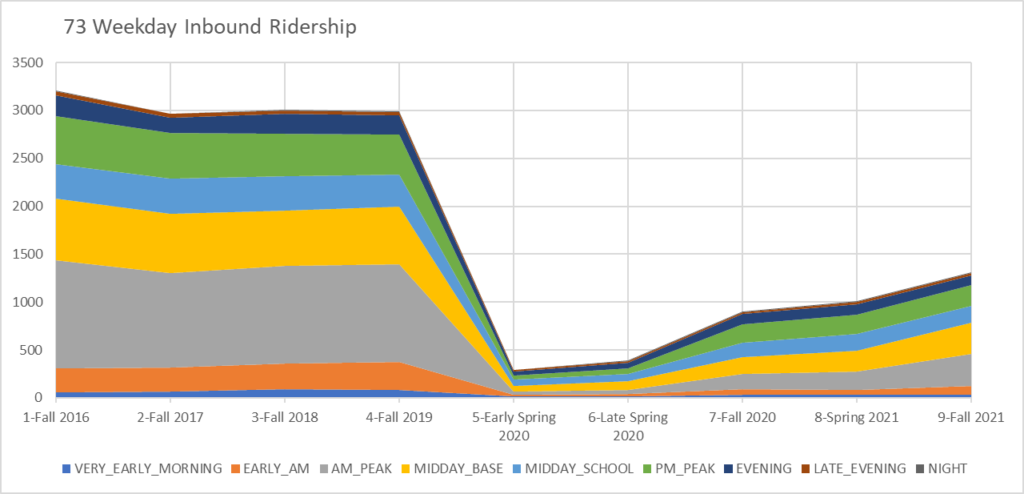
73 Bus Weekday Inbound Ridership by Season and Time Period
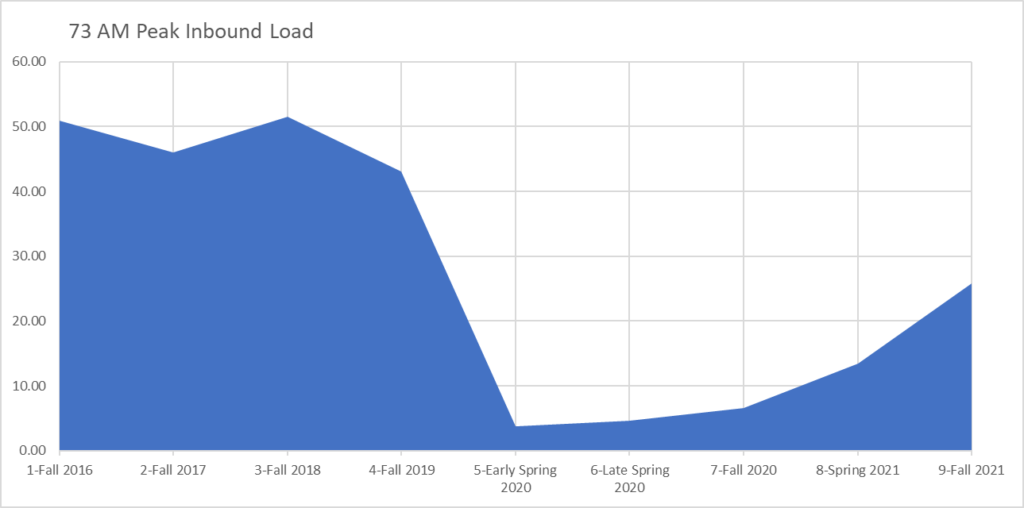
73 Bus Weekday Inbound Maximum Loading by Season and Time Period
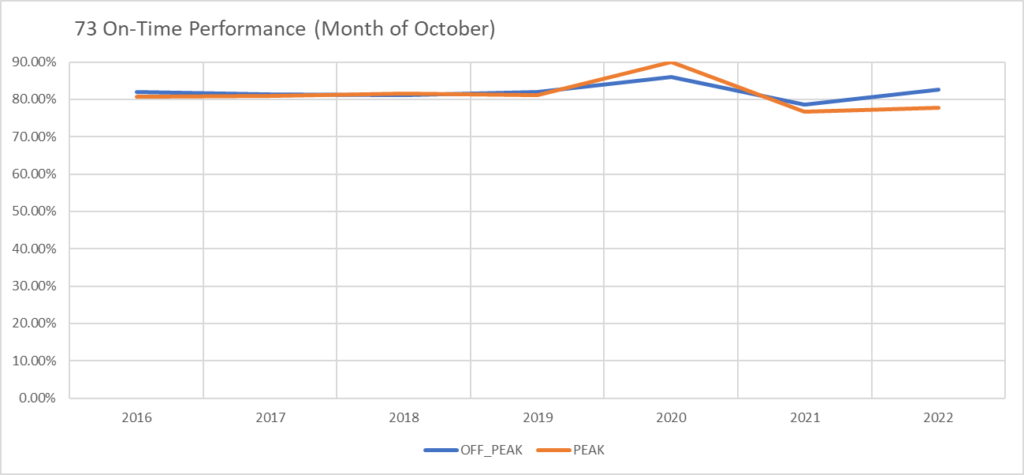
73 Bus On Time Performance Rate — Month of October
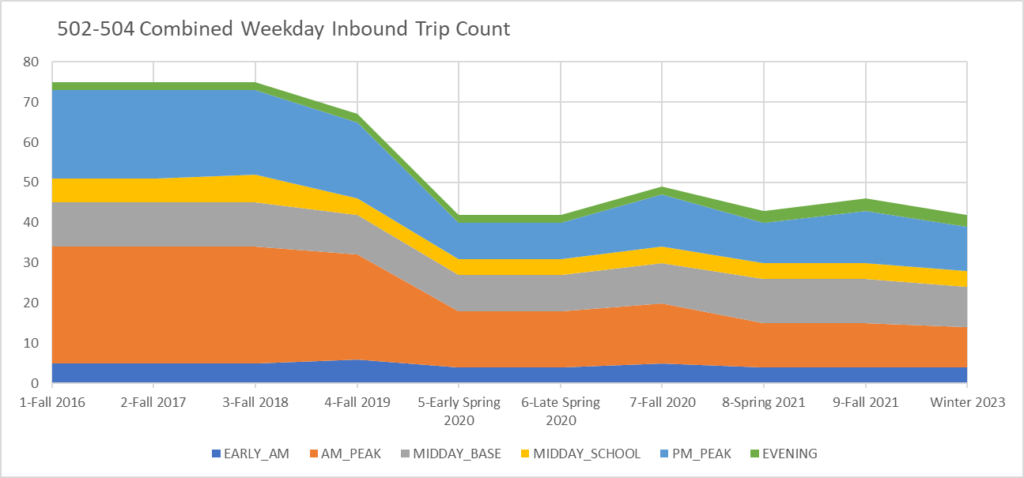
504/502: Watertown Yard – Federal Street & Franklin Street
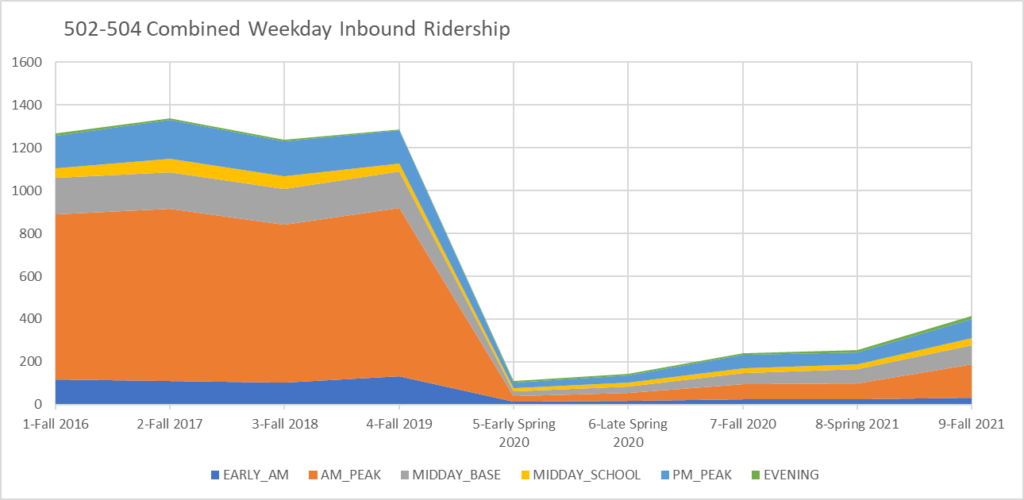
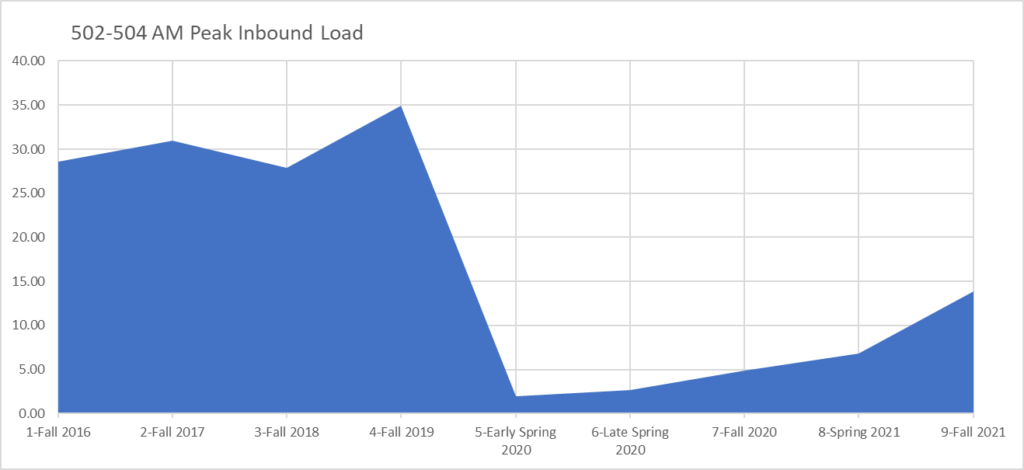
The 504 runs from Watertown Square to downtown via the turnpike. The 502 ran from Watertown Square to Copley via the turnpike. Early in the pandemic, in Spring 2020, the routes were combined — the 504 now gets off the pike at Copley and then continues downtown. The total weekday trip count for two routes had already been trimmed by 11% in Fall 2019, generating an increase in peak load in that season. The total trip count was further trimmed by another 37% when the routes were combined in the Spring of 2020. Morning peak ridership collapsed by 97% during the early spring of 2020 and was still 80% below pre-COVID levels if the Fall of 2021.
504/502 Bus Weekday Inbound Trip Counts by Season and Time Period
504/502 Bus Weekday Inbound Ridership by Season and Time Period
504/502 Bus Weekday Inbound Maximum Loading by Season and Time Period
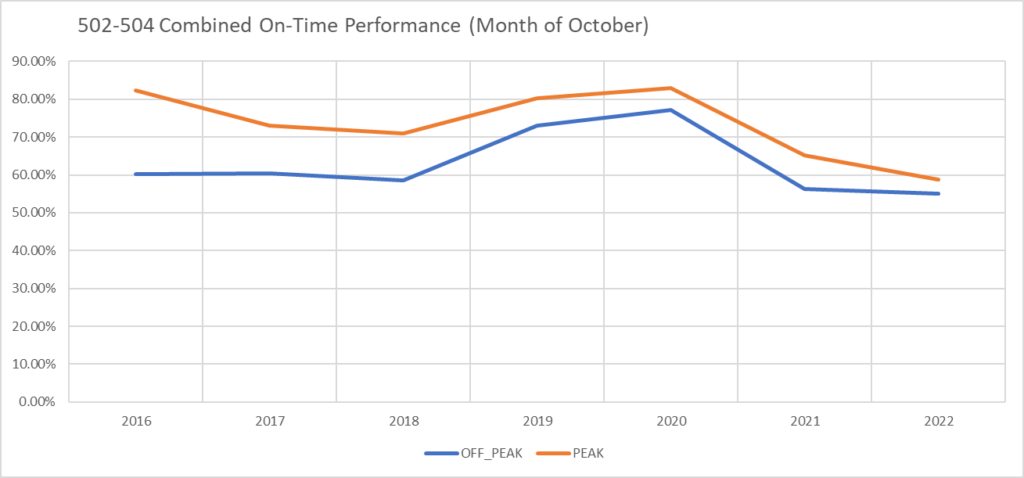
504/502 Bus On Time Performance Rate — Month of October
501/503: Brighton Center – Federal Street & Franklin Street
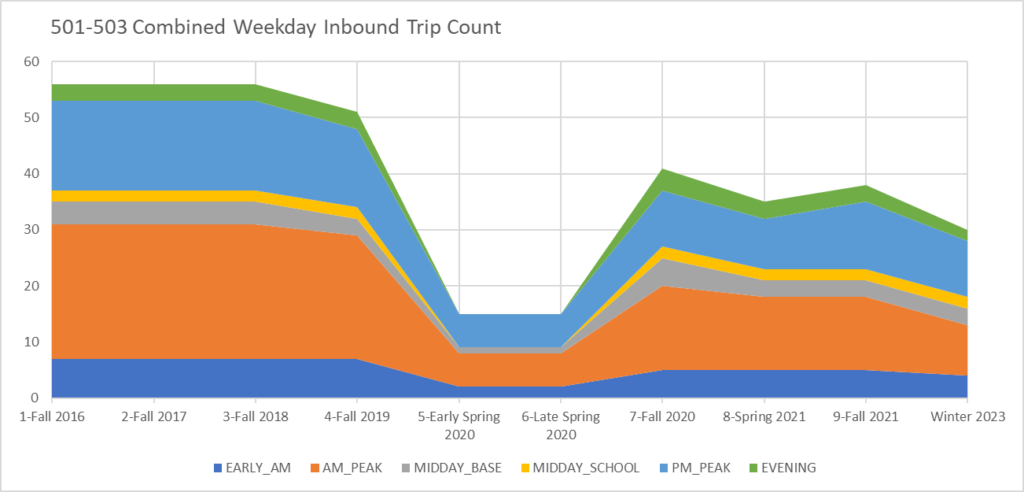
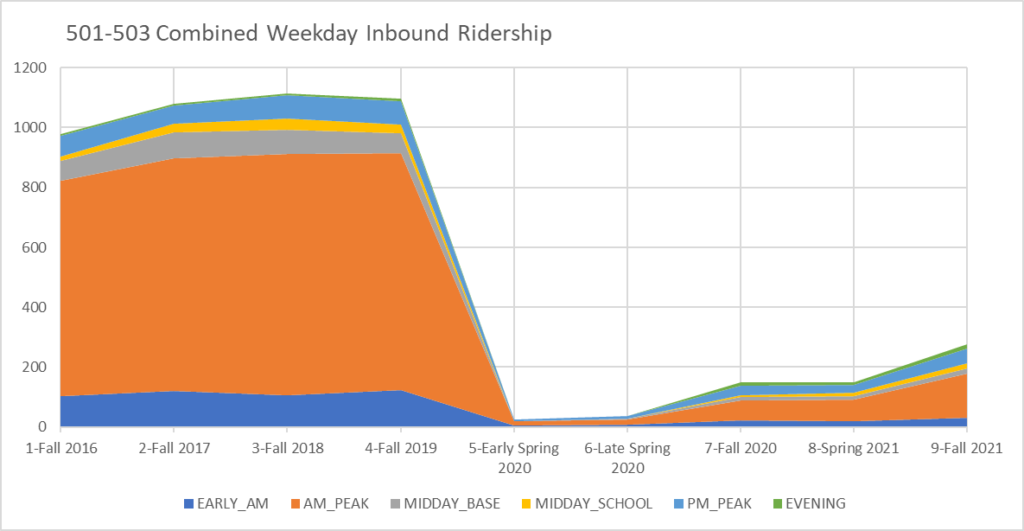
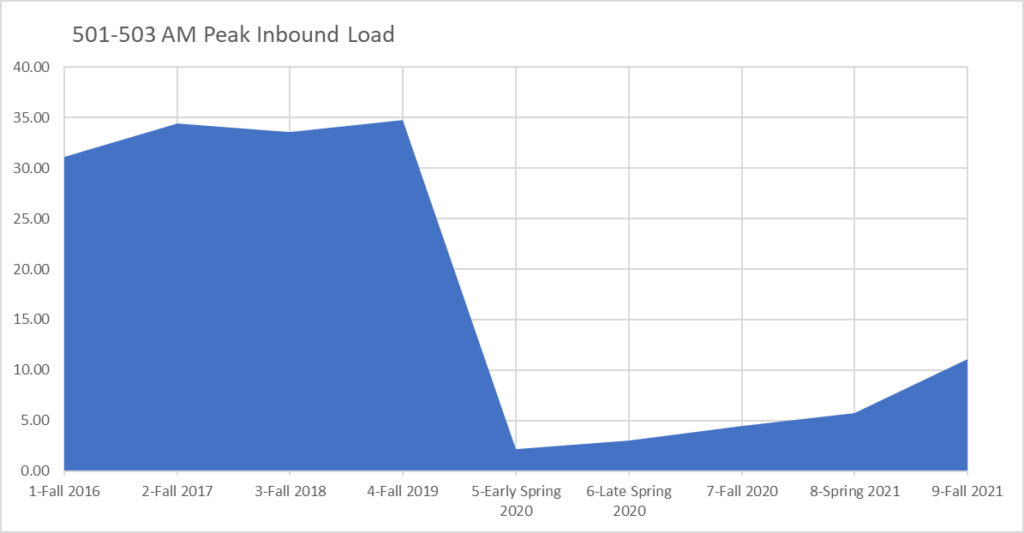
The 501 runs from Brighton to downtown via the turnpike. The 503 ran from Brighton to Copley via the turnpike. Early in the pandemic, in Spring 2020, the routes were combined — the 501 now gets off the pike at Copley and then continues downtown. The total weekday trip count for two routes had already been trimmed by 9% in Fall 2019, generating an increase in peak load in that season. The total trip count was further trimmed by another 71% when the routes were combined in the Spring of 2020. Morning peak ridership collapsed by 98% during the early spring of 2020 and was still 74% below pre-COVID levels if the Fall of 2021.
501/503 Bus Weekday Inbound Trip Counts by Season and Time Period
501/503 Bus Weekday Inbound Ridership by Season and Time Period
501/503 Bus Weekday Inbound Maximum Loading by Season and Time Period
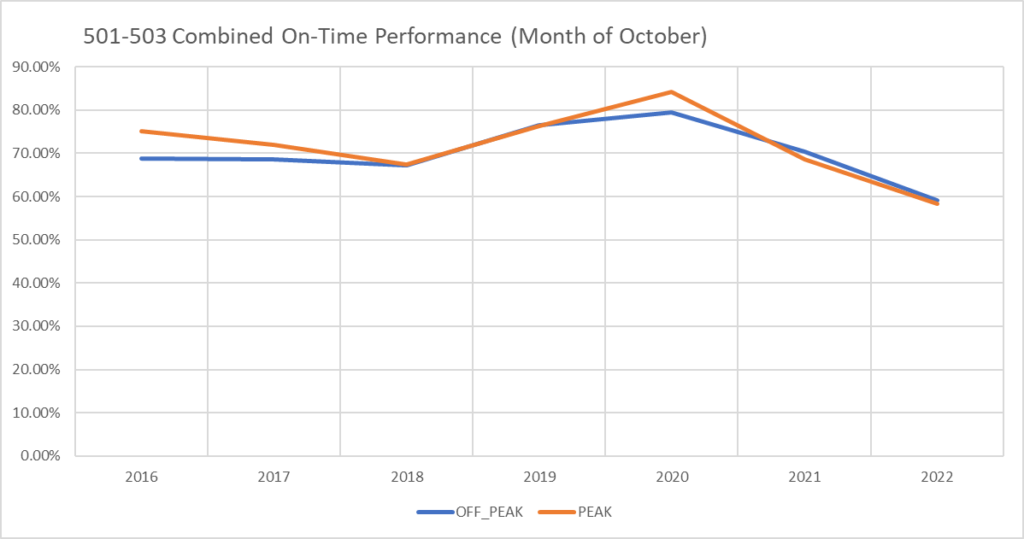
501/503 Bus On Time Performance Rate — Month of October
554: Waverley Square – Newton Corner
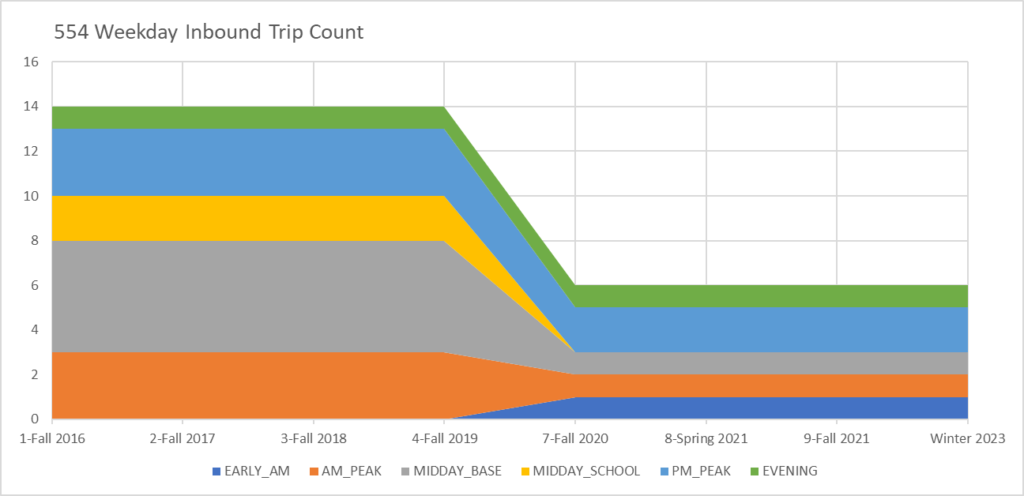
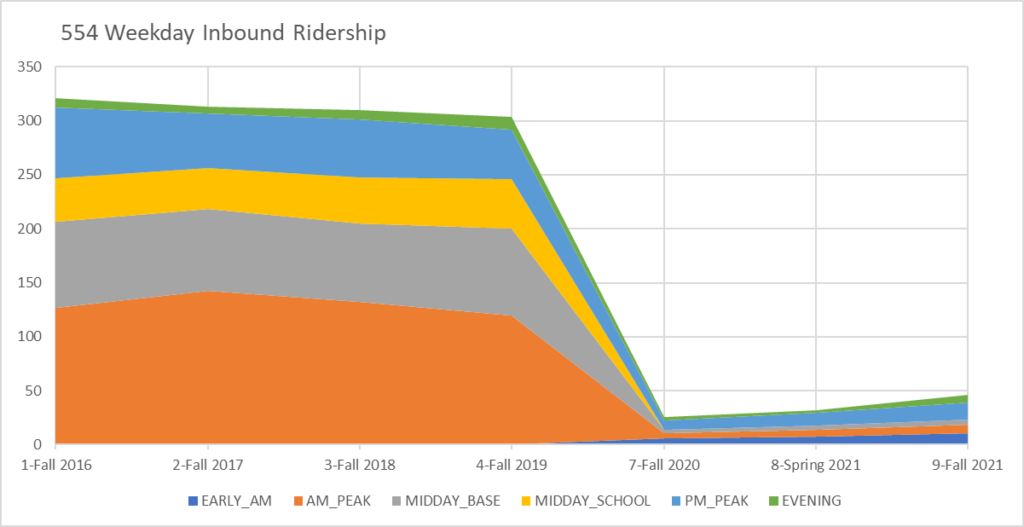
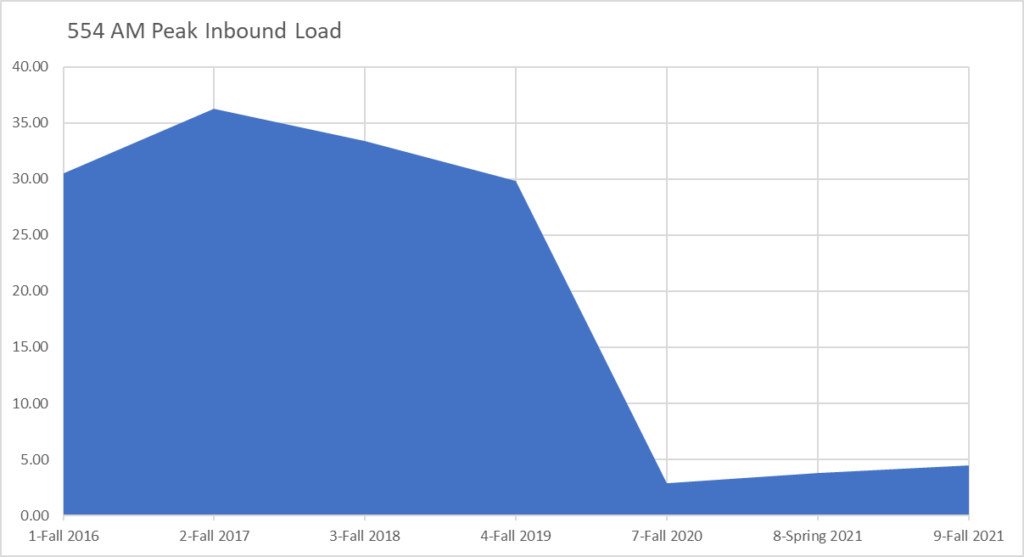
The 554 does a long looping route starting in Waverley Square and running out into Waltham, down into West Newton, and back into Newton Corner. The already sparse service was completely eliminated in the spring of 2020 and restored at less than half its previous level in the Fall of 2020. Ridership remained very low in the Fall of 2021. The Winter 2023 schedule has 554 service combined with 553 service. The trip count shown immediately below for Winter 2023 includes only those runs of the 553/554 which originate in Waverley Square.
554 Bus Weekday Inbound Trip Counts by Season and Time Period (No Service in Spring 2020)
554 Bus Weekday Inbound Ridership by Season and Time Period (No Service in Spring 2020)
554 Bus Weekday Inbound Maximum Loading by Season and Time Period (No Service in Spring 2020)
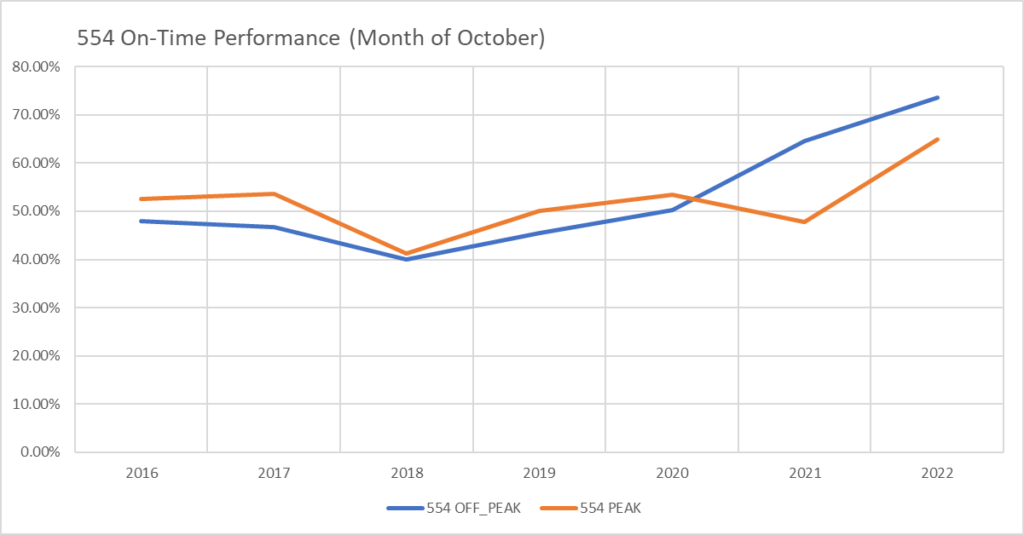
554 Bus On Time Performance Rate — Month of October
Additional District Data
Buses Serving my Senate District
The Suffolk and Middlesex district is served by the 28 buses shown below. The list shows some routes that were consolidated into others post-COVID.
Bus Trip Count Changes in my Senate District
The chart below shows the number of bus trips offered by the MBTA in the first four weeks of October in each of the last four years. Note: This trip count is derived from the bus departures file and runs about four percentage points below a corresponding Fall trip count built up from the ridership file. This file may be more accurate in that the ridership file may include dropped trips. It is also possible that it is low because, according to the trip file documentation “Due to data collection issues, data is not guaranteed to be complete for any stop or date.”
Trips in first four weeks of October (counting a round trip as two trips)
| Route | October 2019 | October 2020 | October 2021 | October 2022 | 2022 change from 2019 |
|---|---|---|---|---|---|
| 01 | 6525 | 6577 | 6735 | 6262 | -4% |
| 08 | 1983 | 1933 | 1943 | 1991 | 0% |
| 19 | 1270 | 1212 | 1284 | 1261 | -1% |
| 39 | 5822 | 6159 | 5724 | 5589 | -4% |
| 47 | 2662 | 2677 | 2654 | 2687 | 1% |
| 55 | 1740 | 1160 | 512 | 532 | -69% |
| 57/57A | 6437 | 7198 | 6454 | 6489 | 1% |
| 59 | 1116 | 921 | 956 | 956 | -14% |
| 60 | 1828 | 1588 | 1688 | 1687 | -8% |
| 64 | 1472 | 1346 | 1391 | 1408 | -4% |
| 65 | 1556 | 1712 | 1847 | 1839 | 18% |
| 66 | 5623 | 6015 | 6118 | 6114 | 9% |
| 70/70A | 3100 | 4036 | 4175 | 3994 | -1% |
| 71 | 5548 | 5558 | 4533 | 4381 | -21% |
| 73 | 6251 | 5841 | 4401 | 4221 | -32% |
| 72/74/75 | 3947 | 3783 | 3788 | 3788 | -4% |
| 78 | 1588 | 1647 | 1700 | 1700 | 7% |
| 86 | 2622 | 2952 | 2756 | 2742 | 5% |
| 501/503 | 1951 | 1552 | 1473 | 1367 | -30% |
| 504/502 | 2857 | 2062 | 1908 | 1791 | -37% |
| 554 | 560 | 230 | 240 | 240 | -57% |
| CT3 | 1180 | 1118 | 1180 | 1140 | -3% |
| CT2 | 1040 | 841 | 857 | 860 | -17% |
| System-Wide | 68678 | 67584 | 64317 | 63039 | -8% |
MBTA Service Time Period Definitions for Reference
These service period definitions are used by the MBTA for scheduling and are incorporated in the trip-count, ridership, and loading charts in the route detail above.
| Day Type | Period_ID | Period Name | Start | End |
|---|---|---|---|---|
| weekday | time_period_01 | VERY_EARLY_MORNING | 3:00:00 | 5:59:59 |
| weekday | time_period_02 | EARLY_AM | 6:00:00 | 6:59:59 |
| weekday | time_period_03 | AM_PEAK | 7:00:00 | 8:59:59 |
| weekday | time_period_04 | MIDDAY_BASE | 9:00:00 | 13:29:59 |
| weekday | time_period_05 | MIDDAY_SCHOOL | 13:30:00 | 15:59:59 |
| weekday | time_period_06 | PM_PEAK | 16:00:00 | 18:29:59 |
| weekday | time_period_07 | EVENING | 18:30:00 | 21:59:59 |
| weekday | time_period_08 | LATE_EVENING | 22:00:00 | 23:59:59 |
| weekday | time_period_09 | NIGHT | 24:00:00 | 2:59:59 |
| saturday | time_period_10 | OFF_PEAK | 3:00:00 | 2:59:59 |
| sunday | time_period_11 | OFF_PEAK | 3:00:00 | 2:59:59 |
MBTA Season Definitions for Reference
These rating period definitions are used by the MBTA for analysis and scheduling and are incorporated in the trip-count, ridership, and loading charts in the route detail above.
| Season | Start | End |
|---|---|---|
| Fall 2016 | 2016/09/03 | 2016/12/30 |
| Fall 2017 | 2017/09/03 | 2017/12/30 |
| Fall 2018 | 2018/09/02 | 2018/12/22 |
| Fall 2019 | 2019/09/01 | 2019/12/21 |
| Early Spring 2020 | 2020/03/21 | 2020/05/03 |
| Late Spring 2020 | 2020/05/04 | 2020/06/20 |
| Fall 2020 | 2020/08/30 | 2020/12/19 |
| Spring 2021 | 2021/03/14 | 2021/06/19 |
| Fall 2021 | 2021/08/29 | 2021/12/18 |