
This post reviews the published results from the model underlying the Commonwealth’s climate plans and finds that the model suggests we should think of the incremental power generated to support incremental heat pumps as coming mostly from natural gas, at least through roughly 2040. The published data from the model do not include hourly generation projections, so the interpretation presented here needs more validation. [January 2024 Update — see box below based on unpublished hourly modeling, roughly consistent with the findings of this post.]
The preceding post, “How green will the power be?” focused on the long-run marginal emissions rates associated with increased electrification. The “long run marginal emission rate” turns on how much of the additional power will come from green generation instead of natural gas as we add heat pumps and the grid evolves in response. The post focused on two major models — the Avoided Energy Supply Cost model and the Cambium model — and concluded that they both suggest that most of the additional power for heat pumps will come from gas generators.
Stepping back and squinting at the last post, one could view the model result as predictable given the methodology. Essentially, in both models, one assumes that all state policies mandating or authorizing renewable builds are already being followed and then one asks: If one added more power demand (by adding heat pumps), how would the network evolve to meet the need? Since it’s cheaper to add new natural gas generation (which may not require any new construction, just the preservation and increased use of existing capacity) and the models assume that all renewable mandates/authorizations have already been met, the models estimate that the additional power will come from gas. One could fairly ask: What if we spend more money and try to stay renewable, couldn’t we achieve lower marginal emissions? The answer is certainly yes, IF one could, in fact, accelerate the renewables build beyond current plans (which are facing challenges anyway) or find legitimate Renewable Energy Credits to purchase.
This post asks the same “How green will the power be?” question and focuses on the modeling output underlying the Massachusetts Clean Energy and Climate Plan for 2025 and 2030. That plan is built on the “Phased” pathway, which is the mid-range among five pathways that the Massachusetts environmental planners considered for reaching net zero emissions in 2050. The pathways do not differ materially as to the electric demand that they assume from transportation and industry. The pathways are intended to explore alternative mixes of electricity and “clean” fuels as sources of power for space and water heating within buildings.
Instead of asking the long-term marginal question — the question of how the evolution of the grid will change in response to a long-term plan to increase load — this post looks at the short-run marginal rate but on a future date, 2040. The “short-run marginal emissions rate” reflects the emissions change that results when one increases (or decreases) electrical load while keeping available generation resources constant. In other words, this post takes as a given the Commonwealth’s success in following the “Phased” pathway and assumes the power demand growth and resulting grid evolution modeled in that pathway and asks: If all the heat pumps were turned off for a winter in 2040, what power generators wouldn’t fire?
The charts and tables below extract model output regarding the Phased pathway from the Massachusetts Workbook of Energy Modeling Results associated with our current climate plan. That pathway contemplates a substantial building out of renewable generating capacity in New England as well as a decline in fossil generating capacity and an even greater decline in the use of that fossil generating capacity.
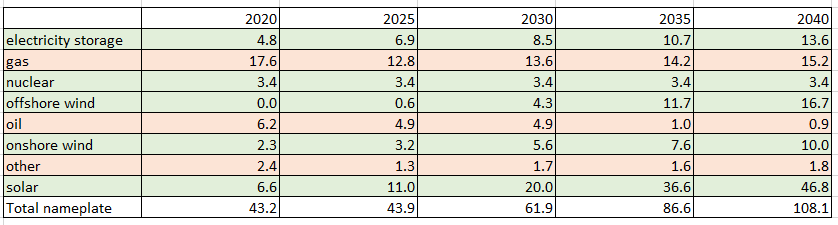
New England Generating Capacity modeled in Massachusetts Clean Energy and Climate Plan 2025 and 2030 — projections of nameplate gigawatts installed
New England Sources and Uses of Electric Power modeled in Massachusetts Clean Energy and Climate Plan 2025 and 2030 — annual results expressed in terawatt-hours of electric energy
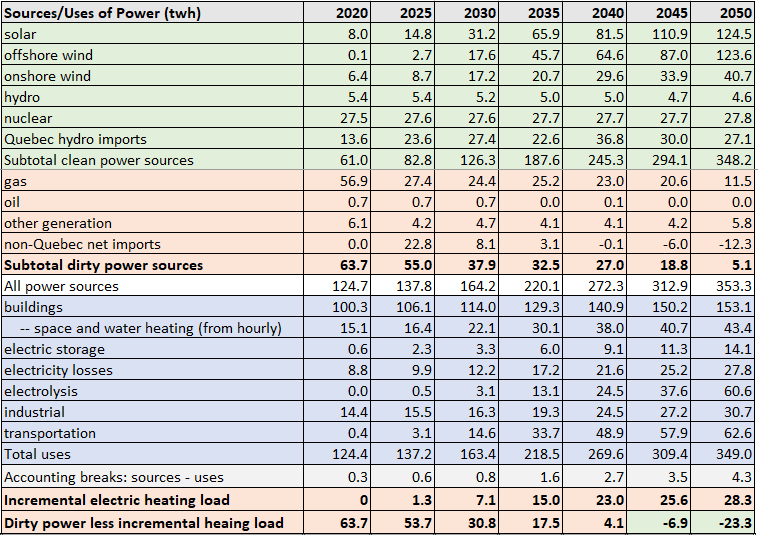
Note that the line for “space and water heating (from hourly)” includes interpolated values for 2035 and 2045.
The key observations to be made from these charts are the following:
- The plan continues to use some dirty power sources through 2050.
- The plan contemplates greatly increased use of electricity in buildings for space and water heating, . . .
- . . . but through 2040, the use of dirty power exceeds the incremental use of electricity in buildings for space and water heating — in other words, if one assumes that one uses green power as much as possible, the dirty power is covering the incremental use of electricity in buildings for space and water heating.
This is a crude analysis because it looks at total annual power amounts. A better analysis would look at the hour-by-hour demand and power supply. The published modeling results do not include hourly generation amounts, but they do include hourly load results (see caveat at end of post). These results show, of course, that the incremental power load from electrification of heating comes during the winter. In winter, solar is down greatly, although wind is up.
New England 2040 space and water heating electrical load modeled in Massachusetts Clean Energy and Climate Plan — results of increment above 2020 by month in gigawatt hours
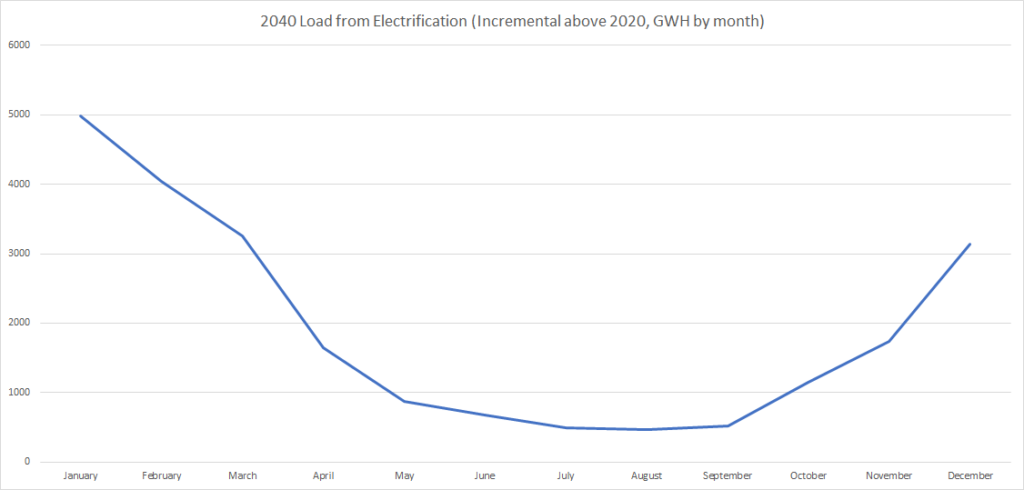
Additionally, by 2040, due to electrification of heat, the peak use of electricity will shift to January and February. As the chart below shows, the hours when gas generators will be needed will occur when heating need is highest.
New England maximum hourly load within month modeled in Massachusetts Clean Energy and Climate Plan — modeled results in gigawatts
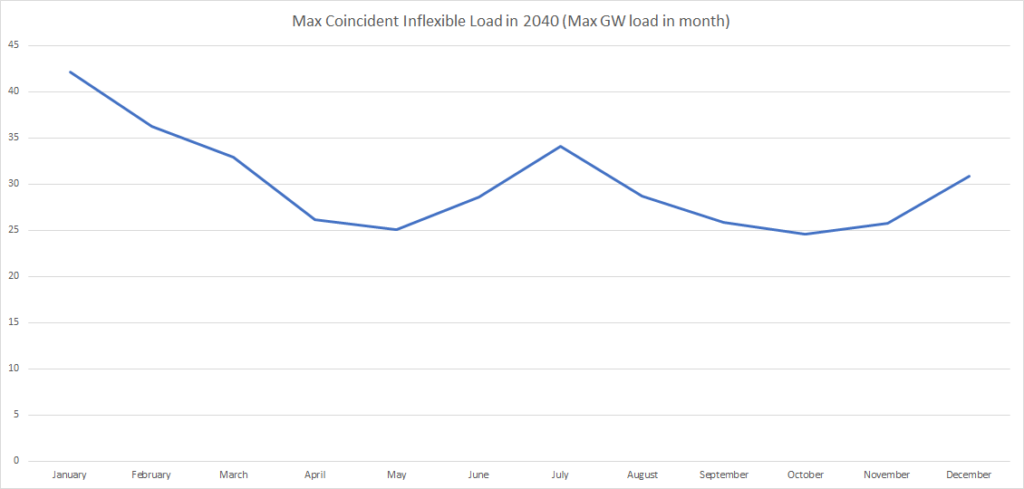
The monthly patterns of electrical use in the two graphs above, combined with the overall annual load numbers in the previous table, are consistent with the proposition that dirty power will support most of the incremental load created by electrification in 2040.
The results above all pertain to the “Phased” or intermediate scenario. However, in all five scenarios considered in the planning exercise, dirty power considerably exceeds incremental electrification loads through 2035. The results become more mixed in 2040; in one of the lower electrification scenarios, as much as 27% of the incremental power could be met with clean generation (still suggesting a high marginal emissions rate).
In summary, for heat pumps placed in service over the next few years which last roughly 17 years, the modeling for the current Massachusetts Clean Energy and Climate Plan is consistent with the proposition that most of their incremental lifetime power use will be served by natural gas. Even if that proposition is physically true, one could, of course require that utilities always purchase Renewable Energy Credits for gas use, but those RECs would be unlikely to based on New England renewable generation.
Notes and Caveats about the Charts
- “Nameplate capacity” is the generation potential at maximum use.
- The hourly load line presented for heating in the charts comes from the workbook tab estimating coincident inflexible load. The three load lines presented there appear to be unadjusted for any shifting. Through 2030, the totals of the load lines are within 1% of the annual reported demand numbers. The totals from the load lines appear lower than the total demand by 5 to 10% in 2040 and 2050.
- Another load line available in the modeling results is the total building energy use (which does appear in the table above). The incremental change in that load line remains below dirty power use through 2035 but begins to exceed it in 2040. The data from the final energy tab suggest that only about half of the residential and commercial final electric energy growth is from heating, so using that load line would overstate heating growth. Another question to check with the modelers.
- An alternative approach to using the available modeling results to assess the use of dirty power to cover increment electrical load for heating would be to guesstimate wind and solar capacity factors in the winter and apply them to the installed capacity. I test that method in the attached spreadsheet and reach the result that a portion of the power use would be renewable in 2040.
- All computations appear in this annotated version of the climate plan modeling workbook.
January 2024 update based on hourly modeling
While the analysis above is somewhat persuasive, hourly generation estimates from the consultant’s models are needed to be sure that we are interpreting the modeled results accurately. DEP recently provided me with the hourly estimates of generation by type within ISO-NE for the “Phased” pathway discussed above. This allows an hour-by-hour comparison of modeled heating load versus generation sources. Overall, these estimates roughly confirm the gist of the preceding analysis.
We don’t know the carbon emissions attributable to imports — the mix of sources of imported power was either not estimated or not provided by the consultant. So we consider two versions of the “Phased pathway” the scenario that imports are all clean — considering any non-fossil source clean — and the scenario that they are all fossil. Any non-imported power that is not fossil is counted also as clean; this lumps in biomass and municipal waste as clean, but these are not large categories.
In the chart below, the “Definitely clean heating” column shows the heating powered by clean sources in the scenario in which all imports are fossil. It is the year round sum of the following quantity computed for each hour of the year: The heating load less fossil generation and less imports. If, in a particular hour, fossil generation and imports exceed the heating load, then the clean heat value for that hour is zero.
The “Possibly clean heating” column is the same computation but excluding imports — in other words, the “Possibly clean heating” column is the year round sum of the following quantity computed for each hour of the year: The heating load less fossil generation, zero if fossil generation exceeds heating load. This shows the amount of heating powered by clean sources to the scenario in which all imports are clean.
Summary of hour-by-hour electric heating vs generation analysis for ISO New England in “Phased” pathway (GWH)
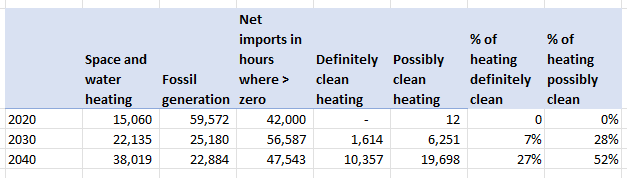
This chart shows that on an hour-by-hour basis, generation sources other than imports and New England fossil fuel are modeled in the “Phased” pathway to account for 7% of heating load in 2030 and 27% in 2040; generation sources other than New England fossil sources cover 28% of the heating load in 2030 and 52% in 2040. To put it another way, in the dirtiest version of the “phased” scenario, the version in which all imports are dirty, heat pumps would be 7% clean-powered in 2030 and 27% clean powered in 2040. In the cleanest version of the “phased” pathway, the version in which imports are all clean, heat pumps would be 28% clean-powered in 2030 and 52% clean powered in 2040.
Transfers of power to and from storage are not accounted for in the above analysis. An hourly excess of load over generation for ISO-NE is assumed to be derived from imports. Conversely, an hourly excess of generation over load is assumed to be exported. In reality, some excess power will be stored instead of exported and some power needs can be met by storage instead of imports. To the extent excess clean generation can be stored instead of exported, it is as if more of the imports are clean — the true clean share of heating will lie closer to the “possibly clean” values in the chart above.
One could argue that the analysis is unfair to heat pumps — that heat pumps should not be considered the cause of the marginal power demand met by fossil and imports. Why shouldn’t lighting be blamed for those marginal emissions? Basically, we have three major policy levers we are pulling to reduce emissions: (1) Electrify heating; (2) electrify transportation; (3) make electric power clean. Until we have enough clean power from renewables to exceed our existing general demand, we must — from a policy analysis standpoint — allocate renewable generation to existing general demand. Even in the optimistic “phased-in” pathway for renewables, renewable generation above general demand does not become significant until well into the 2030s. Additionally, since vehicle charging is somewhat easier than heating to time-shift to take advantage of excess renewable generation, it should probably have the next analytic allocation of renewable power.
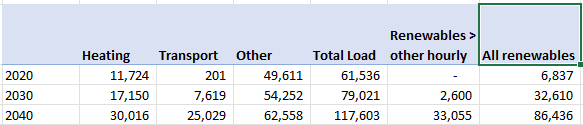
The “Renewables > other hourly column” in the chart below shows the excess of renewable generation over non-heating, non-transportation loads at an hourly level. It is the year-round sum of the following quantity for each hour — solar and wind generation less non-heating, non-transportation load where that quantity is positive, zero otherwise. The excess becomes material at some point well into in the 2030s — fairly late in the life of heat pumps installed currently, even in under the optimistic assumptions of the “phased-in” scenario.
Summary of hour-by-hour load vs renewables generation for ISO New England in “Phased” pathway (GWH)
Overall, my take away from this hourly modeling is a reconfirmation that for heat pumps installed in the next few years we should think of the power supporting them as mostly fossil on average over their 17-year life time, although their last few years may look better than that. The following points reinforce that conclusion:
- As noted above, the modeling assumes 17 gigawatts of offshore wind capacity will be in place by 2040 along with 10 GW of onshore wind and 47GW of solar. These numbers now appear optimistic in light of the setbacks we’ve experienced over the past couple of years. The marginal power used by currently new heat pumps in the first ten years of their life will almost certainly be all fossil.
- Many heat pumps installed over the next couple of years are likely to have lifetimes less than 17 years as their refrigerants become increasingly expensive to replace due to changing EPA regulations. They may be powered by gas-generated electricity for all of their shortened lives.