
In the housing context, the commonly used household income standards are those used in the Section 8 program. This post briefly explores data that shed light on the size of the Massachusetts population at different Section 8 income levels.
Section 8 standards, explored in more depth in a previous post, start from area median household income (“AMI”) as a base. The standards rely on data from the American Community Survey (an annual Census data product) to estimate AMI in different geographic areas. The standards define then eligible household income-levels as a percentage of AMI. They differentiate households of different sizes. For example, the 50% AMI level is lower for a 1-person household than for a 4-person household. However, published census data tabulate medians for households without reference to size — no published tabulation of census data shows the median income for 1-person households as opposed to 4-person households. HUD uses a mathematical formula to compute AMI thresholds for different household sizes, not actual data. It is difficult to know from census data how many people in a given area would meet the HUD income threshold.
Fortunately, a different federal program, the Community Development Block Grant (“CDBG”) program, references the concentration of low and middle income people as a geographic eligibility standard for grants and ties definitions to the Section 8 Program. As a result, HUD works with the Census to produce a special data tabulation of the numbers of Section-8 defined low and moderate income persons every five years. The most recent tabulation, released in June 2024, is based on American Community Survey data collected between 2016 and 2020. Just to keep things confusing, the CDBG program uses the words “low” and “moderate” differently than Section 8:
Income labels comparison CDBG vs. Section 8
| CDBG | Section 8 | |
|---|---|---|
| Up to 30% of AMI | not defined separately | Extremely low income |
| 30% to 50% of AMI | Low income | Very low income |
| 50% to 80% of AMI | Moderate income | Low income |
| 80% to 120% of AMI | Medium income* | not defined separately |
* The term “medium” income is not apparently a CDBG eligibility construct, but it is included in the CDBG data tabulation.
Another distinction between CDBG and Section 8 is that the Section 8 definitions refer to households per se, while the “L/M” rules for CDBG refer to low and moderate income persons based on their household income. Thus the special CDBG tabulation provides person counts, not household counts. The two tables below show the concentration and number of income disadvantaged persons by county in Massachusetts.
Concentration of persons by household income level
2016-2020 5-Year American Community Survey (2020 Dollars)
| County | < 50% of AMI | 50-80% of AMI | All < 80% of AMI | 80-120% of AMI | Household Population* |
|---|---|---|---|---|---|
| Barnstable | 23% | 17% | 40% | 22% | 210,795 |
| Berkshire | 22% | 16% | 39% | 20% | 119,115 |
| Bristol | 25% | 15% | 40% | 19% | 548,225 |
| Dukes | 27% | 19% | 46% | 25% | 17,165 |
| Essex | 29% | 16% | 44% | 19% | 769,075 |
| Franklin | 25% | 17% | 43% | 20% | 69,035 |
| Hampden | 29% | 17% | 46% | 17% | 452,120 |
| Hampshire | 22% | 14% | 35% | 17% | 137,945 |
| Middlesex | 22% | 13% | 36% | 19% | 1,547,940 |
| Nantucket | 21% | 9% | 30% | 32% | 10,935 |
| Norfolk | 21% | 14% | 34% | 20% | 685,420 |
| Plymouth | 21% | 15% | 36% | 21% | 507,145 |
| Suffolk | 41% | 16% | 57% | 18% | 752,780 |
| Worcester | 24% | 16% | 40% | 20% | 796,840 |
| Massachusetts | 26% | 15% | 41% | 19% | 6,624,535 |
* In the summary data, this column is referred to as “Persons with the potential for being deemed Low-, Moderate- and Middle-income”, however it is close to the household population for the 2016-2020 5-year ACS. The household population excludes homeless and people residing in group quarters. The total persons in Massachusetts in the LMI data is 6,624,525; the total household population is 6,617,450 and the total population 6,873,003 — all counts based on the 2020 ACS 5-year data set.
Persons by household income level
2016-2020 5-Year American Community Survey (2020 Dollars)
| < 50% of AMI | 50-80% of AMI | All < 80% of AMI | 80-120% of AMI | Household Population* | |
|---|---|---|---|---|---|
| Barnstable | 48,535 | 36,670 | 85,205 | 45,910 | 210,795 |
| Berkshire | 26,580 | 19,375 | 45,955 | 24,300 | 119,115 |
| Bristol | 136,025 | 80,550 | 216,575 | 104,700 | 548,225 |
| Dukes | 4,659 | 3,201 | 7,860 | 4,245 | 17,165 |
| Essex | 221,854 | 119,921 | 341,775 | 149,050 | 769,075 |
| Franklin | 17,445 | 11,900 | 29,345 | 14,055 | 69,035 |
| Hampden | 131,755 | 75,405 | 207,160 | 77,485 | 452,120 |
| Hampshire | 29,835 | 18,815 | 48,650 | 23,910 | 137,945 |
| Middlesex | 346,762 | 204,843 | 551,605 | 293,315 | 1,547,940 |
| Nantucket | 2,290 | 1,010 | 3,300 | 3,550 | 10,935 |
| Norfolk | 141,695 | 92,630 | 234,325 | 136,160 | 685,420 |
| Plymouth | 104,564 | 77,851 | 182,415 | 106,850 | 507,145 |
| Suffolk | 310,680 | 117,750 | 428,430 | 133,030 | 752,780 |
| Worcester | 193,695 | 123,635 | 317,330 | 156,905 | 796,840 |
| Massachusetts | 1,716,374 | 983,556 | 2,699,930 | 1,273,465 | 6,624,535 |
The CDBG tabulation does not include data for the Extremely Low-Income (30% AMI level). The Census does, however, publish population counts for person in households at different income levels compared to the poverty line. The table below compares the HUD AMI levels for Massachusetts Statewide with the national thresholds for poverty. There are several observations to made about the data in the table:
- HUD AMI levels for 4-person families correspond fairly closely to the stated percentages of statewide median AMI, $104,900. The 4 person limits are respectively 81%, 54%, 32% of statewide AMI. (These computations are not shown in the chart, but are shown in the supporting spreadsheet.)
- The Census poverty thresholds allow more income for larger households as compared to smaller households than the HUD AMI definitions. The HUD AMI definitions are based on simple ratio calculation vs. the 4-person household, as visible in the data below and discussed in this previous post. Effectively, the Census poverty thresholds make a proportionately larger allowance for non-housing costs per person.
- The HUD ELI level for Massachusetts (“30% AMI”) is above 100% of the national poverty threshold for all but the largest households.
- The HUD ELI level for Massachusetts (“30% AMI”) is below 150% of the national poverty threshold for all but the smallest households.
- From the last two observations it follows that the Massachusetts ELI population count is between the 100% poverty population and the 150% poverty population.
2020 HUD Income Levels (Massachusetts, statewide) and Census-defined poverty levels (national)
| 1 Person | 2 Person | 3 Person | 4 Person | 5 Person | 6 Person | 7 Person | 8 Person | |
|---|---|---|---|---|---|---|---|---|
| Low-Income Limit (LIL) “80% AMI” | 54,950 | 62,800 | 70,650 | 78,500 | 84,800 | 91,050 | 97,350 | 103,600 |
| Very Low-Income Limit (VLIL) “50% AMI” | 36,700 | 41,950 | 47,200 | 52,450 | 56,650 | 60,850 | 65,050 | 69,250 |
| Extremely Low-Income Limit (ELIL) “30% AMI” | 22,050 | 25,200 | 28,300 | 31,450 | 34,000 | 36,500 | 39,000 | 41,550 |
| Income limits ratio to 4 person (fixed all for levels — HUD Methodology) | 70.0% | 80.0% | 90.0% | 100.0% | 108.0% | 116.0% | 124.0% | 132.0% |
| Census Poverty Threshold | 13,171 | 16,733 | 20,591 | 26,496 | 31,417 | 35,499 | 40,406 | 44,755 |
| Poverty threshold ratio to 4 person (built up from need — Census Methodology) | 49.7% | 63.2% | 77.7% | 100.0% | 118.6% | 134.0% | 152.5% | 168.9% |
| ELIL as % of poverty threshold | 167% | 151% | 137% | 119% | 108% | 103% | 97% | 93% |
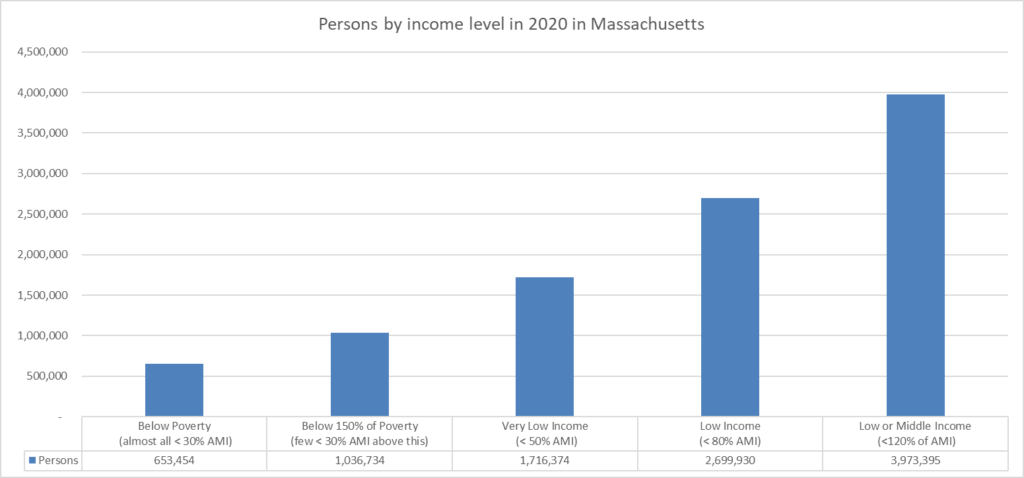
From all of the data above, we have the following summary chart. This chart is useful in considering the availability of housing at different income levels — a subject for a future post.
Persons in households below certain household income levels in Massachusetts in 2020
Thanks for this data, Will.
ILLEGAL immigrants will get Section 8 too. Millions of them
And their children will overwhelm schools, just is happening in Springfield (“Influx of migrants strains public schools in Springfield; schools are struggling to teach and provide for migrant students with no previous education”):
https://defendinged.org/incidents/influx-of-migrants-strains-public-schools-in-springfield-schools-are-struggling-to-teach-and-provide-for-migrant-students-with-no-previous-education/
Perhaps Watertown and Belmont can open their schools to a few thousand of these children.
I am sure there is lots of empty space and plenty of property tax money to fund it.
And plenty of housing is available in both towns for the parents. Don’t let Springfield handle this alone.
Watertown and Belmont: Step up!