
Slow pace is the most widely shared concern about our building electrification strategy. We are not doing heat pump conversions fast enough to hit our climate goals (although we may see widespread adoption eventually).
Current Climate Goals and Plans in Motion
Our greenhouse gas reduction goals for buildings appear in Table 5-2 at page 52 of the Massachusetts Clean Energy and Climate Plan for
2025 and 2030 (“CECP”).
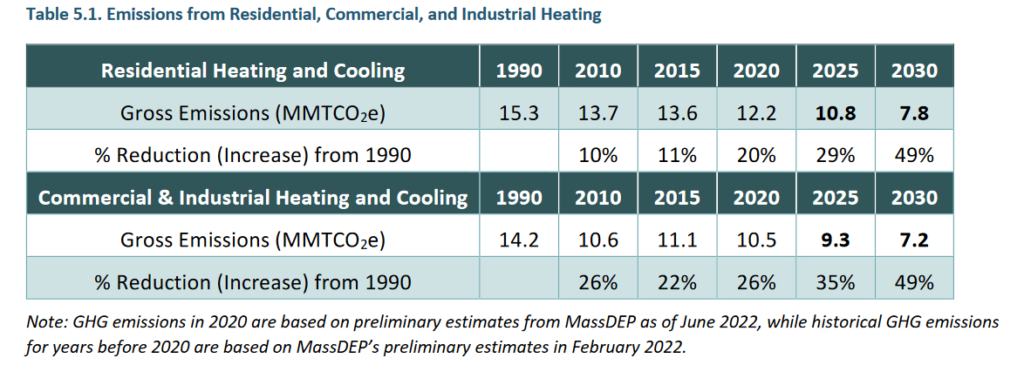
Note that Building Sector emissions include only the fuels burned on site — the emissions associated with electricity used in buildings are accounted for within the electrical sector. See CECP at page 21. So, electrification of fossil heating systems always results in GHG accounting benefits for the building sector, regardless of the net emissions change. Note that improvement in cooling efficiency mainly helps the electric sector, not the building sector. From the above chart, we see that from 2020 to 2030, we need to knock down building emissions by 4.4 million metric tons of CO2e (MMTCO2e) on the residential side and 3.3 MMTCO2e on the commercial and industrial side — a total of 7.7 MMTCO2e in reductions.
To that end, the CECP Appendice E (page 159) includes specific metrics for the adoption of heat pumps:
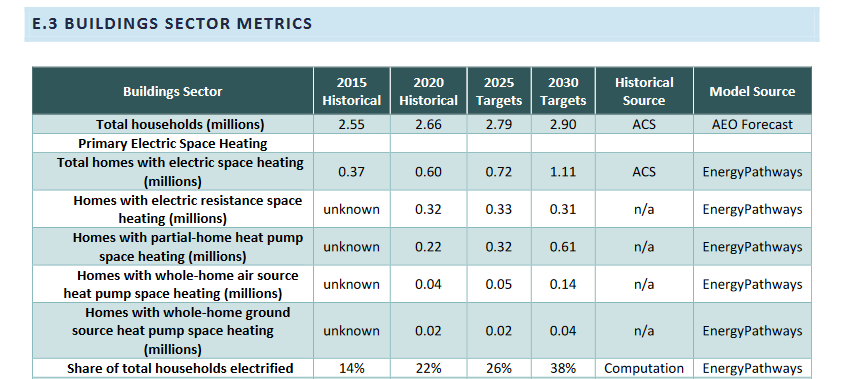
These numbers imply a total of 790,000 residential heat pumps operating in 2030, up from an estimated 280,000 in 2020. Referencing Mass Save 4th Quarter KPI spreadsheets it appears that Mass Save installed heat pumps for 10,954 customers in 2020 and 16,235 in 2021. An unknown but likely small number of pumps may have been installed independently. Roughly, we need to install another 480,000 heat pumps in Massachusetts buildings in the current and two following Mass Save three year plans (2022-4, 2025-7, 2028-30). The chart below repeats this analysis.
| Heat pumps operating in 2020 — estimated actual | 280,000 |
| Heat pumps operating in 2030 –target | 790,000 |
| Total to heat pumps to install, 2020 to 2030 | 510,000 |
| Heat pumps installed in 2020 and 2021 by Mass Save (rounded) | 27,000 |
| Remaining to install in current and next two three year plans (2022-4, 2025-7, 2028-30) | 483,000 |
| To be installed in current three-year plan (rounded) | 63,000 |
| Remaining to be installed in subsequent two three year plans together | 420,000 |
The current Mass Save three year plan contemplates electrification of 63,000 homes from 2022 through 2024, a substantial acceleration over prior years. So far, Mass Save is not too far off that goal (although lagging on goals on the commercial and industrial side). See Mass Save Quarterly KPI Report through 1st Quarter 2023. But even if Mass Save hits its three-year goal, to reach the 2030 goal of roughly 483,000 more electrified homes, Mass Save will have to do another 420,000 installations by 2030, which would require an average of 70,000 installations per year from 2025 through 3040 — more than triple the current pace.
The burden on the next two three-year plans looks even more disproportionate if one focuses on green house gas reductions directly. The Secretary of EoEEA set a goal of 0.845 MMTCO2e (845,000 MTCO2e) of annual emissions impact in 2030 for the 2022-24 Mass Save three year plan. The graphic below breaks down the 845,000 MMTCO2e in planned reductions by fuel source.
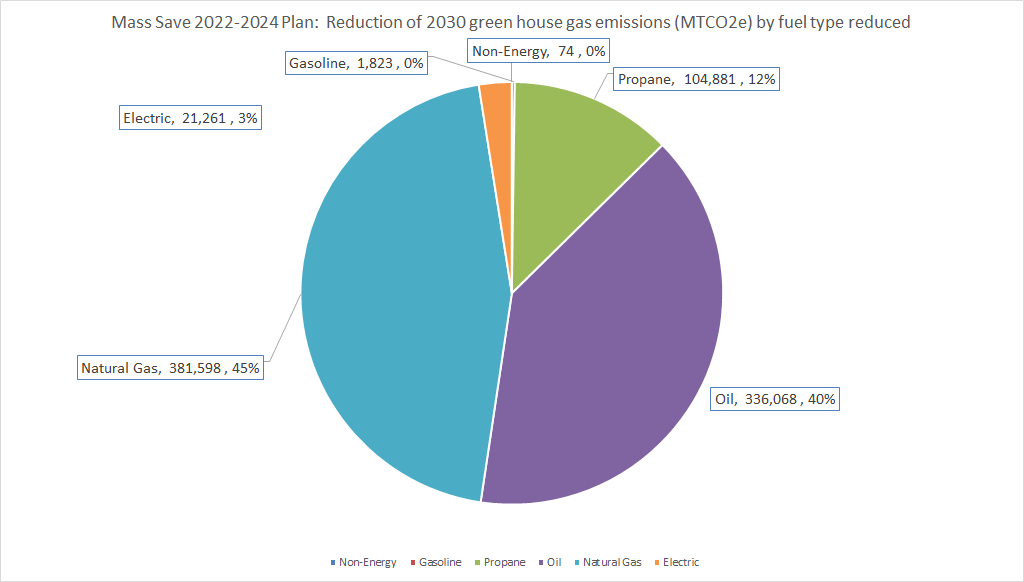
This chart is derived from the Mass Save Quarterly KPI Report through 1st Quarter 2023 (filtering planned reductions in the Master Data tab).
The total reduction includes a slight net reduction of emissions in the electric sector — electric savings from other Mass Save measures slightly exceed electric increases from electrification. But 97% of the 845,000 MMTCO2e emissions reductions come from the fossil heat sources displaced through electrification and efficiency in the building sector. The chart below shows that as of the first quarter of 2023 (42% of the plan period), Mass Save was running behind emissions reductions — only 26% achieved, due to lagging results especially in the low income and commercial and industrial sectors.
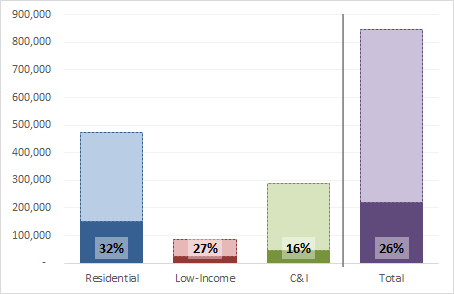
This chart is derived from the Mass Save Quarterly KPI Report through 1st Quarter 2023, the GHG tab with a correction to the data range.
As noted above, we need to cut annual building emissions a total 7.7 MMTCO2e by 2030. Since the current three year plan only hopes to achieve 0.845 MMTCO2 in emissions, the next two three-year plans will need to achieve emissions reductions totaling 6.9MMTCO2e (annual impact in 2030). This implies reductions of 1.14 MMTCO2e per year — four times the current pace. Given that the current plan’s GHG reduction goals look increasingly out of reach, this acceleration seems especially challenging.
Factors limiting acceleration
The electrification agenda faces challenges on both the supply-side and the demand-side. The Commission on Clean Heat recently considered the challenges and developed a set of recommendations for acceleration, including:
- Lower electric rates; create a greater operating cost advantage for heat pumps — upfront incentives alone are not enough
- Continue to support strong upfront incentives and/or create new mechanisms to help consumers finance electrification
- Streamline for consumers the heat pump design and installation process
- Support the expansion of the clean energy work force
- Strengthen messaging and public awareness of clean heat solutions
- Implement building energy scoring to increase awareness and motivation for efficiency and electrification.
If the recommendations of the Commission are all aggressively implemented in some form, we should see some acceleration. However, the potential volume of heat pump installation depends on consumer decisions. Consumers are ready to invest in their heating system only under certain conditions. Heat pump decision-making by consumers was carefully studied by multiple consultants as part of current the three year plan development. The “potential studies” find that only a very small percentage of consumers are likely to consider a heat pump conversion in any given year: less than 5%, up to that level for oil conversions, likely lower gas conversions. These findings are consistent with my constituent survey of interest in heat pumps.
The agreed targets for installations embodied in the three-year plan roughly track the potential volumes estimated in the “potential studies.” It is no accident that the plan targets and plan results are modest. The studies do leave some room for acceleration on the demand side and gas conversions have exceeded expectations. With continued availability of generous incentives, it seems plausible that consumers will continue to pay the high prices needed to attract more workers. But, as we face labor shortages across the economy, it’s hard to imagine the several-fold expansion of the work force that we would need to accelerate our progress enough to meet our stated goals.
The “potential studies” project heat pump adoption based on the Bass diffusion model of product adoption in a market. That model projects an S-shaped curve of installation growth. Adoptions start slowly and then eventually speed up. It seems like we may be on one of the slower curves — spending a few more years in the early/slow phase.
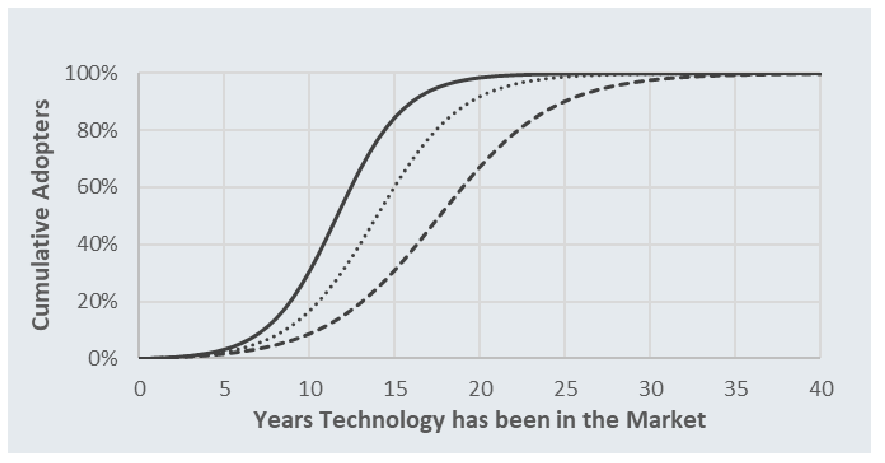
Dunsky potential study submitted in DPU rate proceedings (Eversource Exhibit 1, Appendix F3, page 232)