
Background
Our interest on this page is to understand what major models say about expected volumes of heat pump installations. As part of the three year planning process for MassSave, each utility must conduct a “potential study” to assess the possibility for implementing particular program measures in its service area. Four different major consulting firms were involved in conducting these studies for the 2022-24 plan.
- Guidehouse, Inc. — National Grid
- Dunsky — Eversource
- Opinion Dynamics together with Dunsky — Cape Compact
- Applied Energy Group — Berkshire Gas, Liberty Utilities, Unitil (Fitchburg Gas and Electric)
This page discusses how these studies treated the potential for heat pump replacements of fossil-fueled space heating. The AEG studies do not consider electrification and Opinion Dynamics left most of the electrification analysis to Dunsky, so really there are two methodologies to review:
- The Guidehouse methodology in its study for National Grid (starts at page 1 of the packet).
- The Dunsky methodology in its study for Eversource (starts at page 255 of the packet).
Technical Potential
Definitions
Guidehouse and Dunsky treated technical potential differently. For Guidehouse, technical potential consisted of all possible electrifications, regardless of equipment replacement schedule:
This study defines technical potential as the total energy savings available assuming that all applicable installed baseline measures can immediately be replaced with the efficient measure/technology—wherever technically feasible—regardless of the cost, market acceptance, or whether a measure has failed and must be replaced. Therefore, technical potential in neither cumulative nor incremental, but instead shows the total potential if all savings were to be achieved in a single year.
Guidehouse Potential Study, Section 4.1. Incorporated by reference as definition for electrification purposes at Section 10.
For Dunsky, technical potential was an annual concept and included only electrification at the time of equipment replacements, although a cooling replacement could trigger electrification of heating and early replacements occur in selected circumstances:
The technical potential includes opportunities related to end-of-life replacements of existing heating and cooling equipment, as well as some early replacement opportunities for cooling equipment (mostly related to existing AC units being replaced by heat pump equivalents). It also includes the potential to avoid installing combustion heating systems in newly constructed buildings or reduce their consumption through partial electrification.
Dunsky Potential Study for Eversource, Study Page 106
According to Dunsky, program administrators implied that early replacements for existing heating systems should not be considered:
The PA’s are not targeting heating system early replacement, so only heating systems that are at their end of life are considered a trigger for a heating electrification opportunity.
Dunsky Potential Study for Eversource, Appendix Section C.3.5
National Grid Technical Potential Computations
Using the Guidehouse/National Grid broader approach, technical potential for electrification is essentially all the homes in the service area. The chart below shows the number of National Grid Customers of each type.
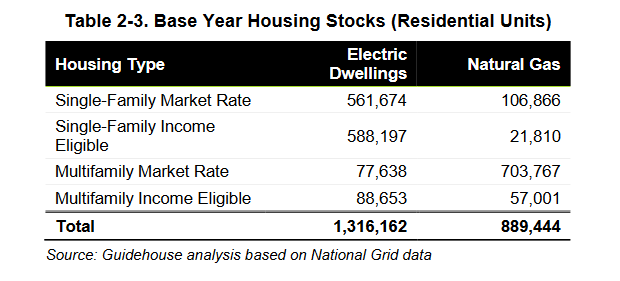
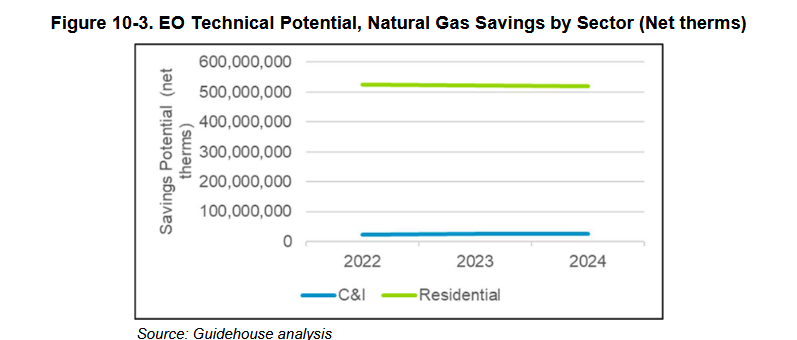
On this baseline, Guidehouse estimates a technical potential of approximately 520,000,000 therms of gas savings from electrification within National Grid’s gas service territory. Study Page 87. That works out to 584 therms per customer, which is more than the average household uses, according to MassDOER. (MassDOER estimates 22-23 Winter gas spending of $988 per household at $2.14 per them which works out to 461 therms per season.) In other words, consistent with its definition, the Guidehouse estimation of technical potential roughly equals all gas consumption in the service territory.
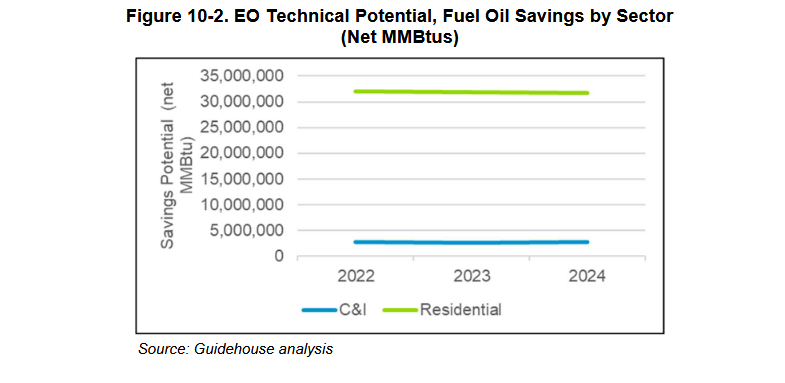
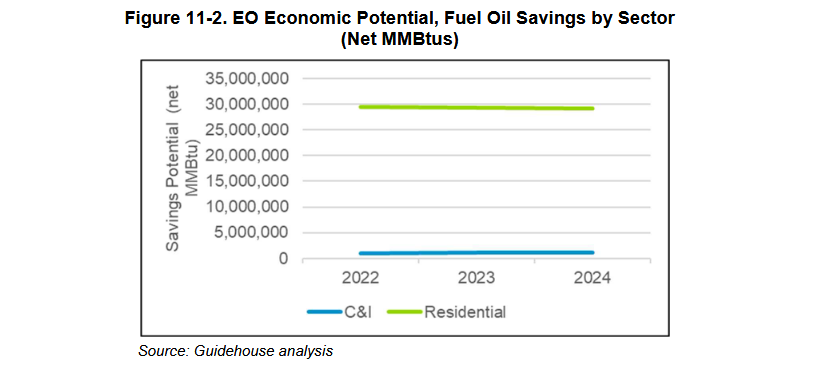
Similarly, Guidehouse presents a technical potential for energy savings from residential fuel oil customers that is approximately 32,000,000 MMBTU. Study Page 86. If 24% of National Grid’s electrical customers use oil (consistent with these data), then this works out to 731 gallons of fuel oil per customer, more heating oil than the average home uses (637 gallons from MassDOER estimates). Again, Guidehouse is estimating technical potential as essentially every home in the service area.
Eversource Technical Potential Computations
Eversource has a similar electric customer base to National Grid, but a smaller gas base:
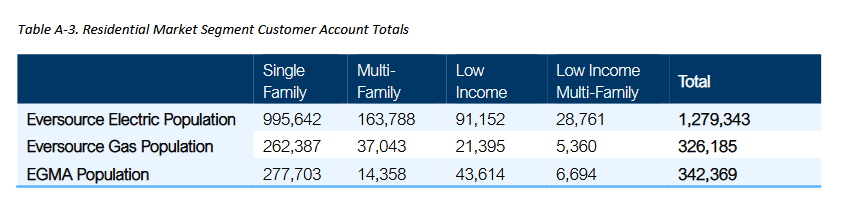
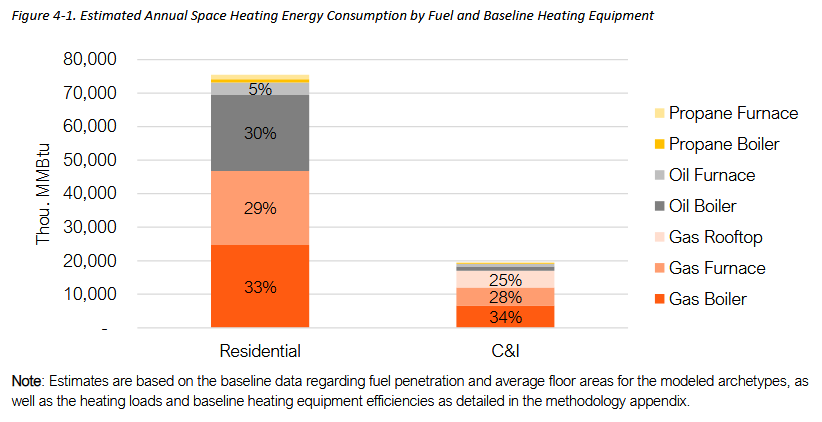
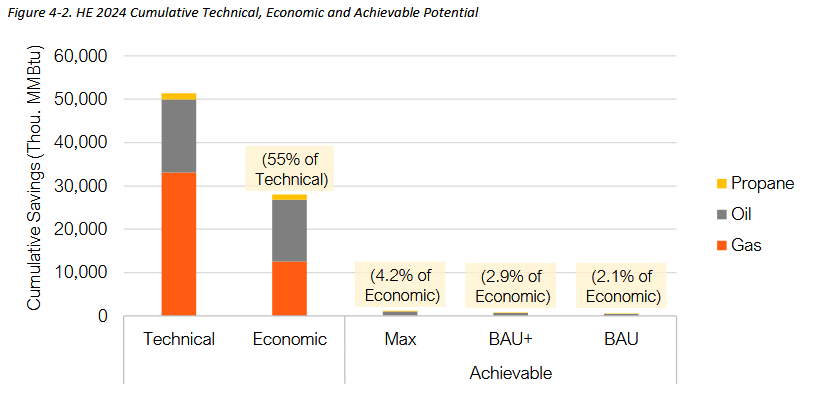
The Dunksy approach, which limits annual technical potential to heating or cooling burnout occasions plus a few early replacements, computes technical potential equal to 18% of the total installed base for oil, gas, and propane. To see this, compare Figures 4-1 and 4-2 in Dunsky document, pages 106-7, packet pages 393-4 (these figures are reproduced in Appendix further below): 51 million MMBTU technical savings potential cumulative for the three year plan — so we’ll divide by three — compared to annual combined residential and commercial sector consumption of approximately 95 million MMBTU.
The approximate technical savings potential of 18% annual consumption implies replacement opportunities coming every 5.5 years. This seems a little more frequent than suggested by the useful life data found in the TRM (shown below, right hand column): However, either a cooling or a heating failure could trigger an opportunity for a heat pump conversion; if one assumes that the burnout spacing is independent for cooling and heating, then the expected interval between burnout drops by roughly half; additionally there are some early conversions allowed in the Dunsky model. See Appendix C.3.5 “Economics” in the Dunsky model (packet page 484). If Dunsky is assuming too frequent replacement, the effect is to elevate technical potential, but this should wash out in the economic potential computation.
| End Use | Penetration in 2019* (% of homes) per Per Baseline Study* | Effective Useful Life (years) Per Baseline Study* | Effective Useful Life (years) Per TRM** |
|---|---|---|---|
| Natural Gas Furnace | 24% | 17 | 15 |
| Natural Gas Boiler | 33% | 23 | 19 |
| Oil Furnace | 4% | Not shown | 12 |
| Oil Boiler | 17% | 27 | Not shown |
| Central Air Conditioning | 33% | Not shown | 18 |
| Room Air Conditioner | 55% | Not Shown | 8 |
Economic and Achievable Potential
Defining Economic Potential
Both studies include within economic potential includes all projects within technical potential for which benefits exceed costs. The constructs do differ because the projects included within the technical potential differ — as noted above, Guidehouse includes all gas and oil heat systems regardless of expected burnout date.
From the Guidehouse study:
Economic potential is a subset of technical potential and uses the same assumptions regarding immediate replacement as in technical potential. However, this only includes those measures that have passed the benefit-cost (B/C) tests chosen for measure screening. A measure with a B/C ratio greater than or equal to 1.0 is a measure that provides present value monetary benefits greater than or equal to its present value costs. If a measure’s B/C meets or exceeds the threshold, it is included in the economic potential.
Guidehouse Study, Appendix Page A-5, packet page 183
From the Dunsky study:
[Economic potential is] the savings opportunities available should customers adopt all cost-effective savings, as established by screening measures against the Total Resource Cost (TRC) Test without consideration of market barriers or adoption limitations.
Dunsky Study, page ix, packet page 265
Defining Achievable Potential
The concept of “Achievable Potential” is shared between the studies — achievable potential is the subset of economical conversions which will likely actually be achieved given a defined set of incentives and best practice marketing of the incentives.
Achievable potential is a subset of economic potential, but further considers the likely rate of efficient measure acquisition, which is driven by a number of factors including the rate of equipment turnover (a function of measure’s lifetime), simulated incentive levels, budget constraints, consumer willingness to adopt efficient technologies, and the likely rate at which marketing activities can facilitate technology adoption.
Guidehouse Study, Appendix Page A-5, packet page 183
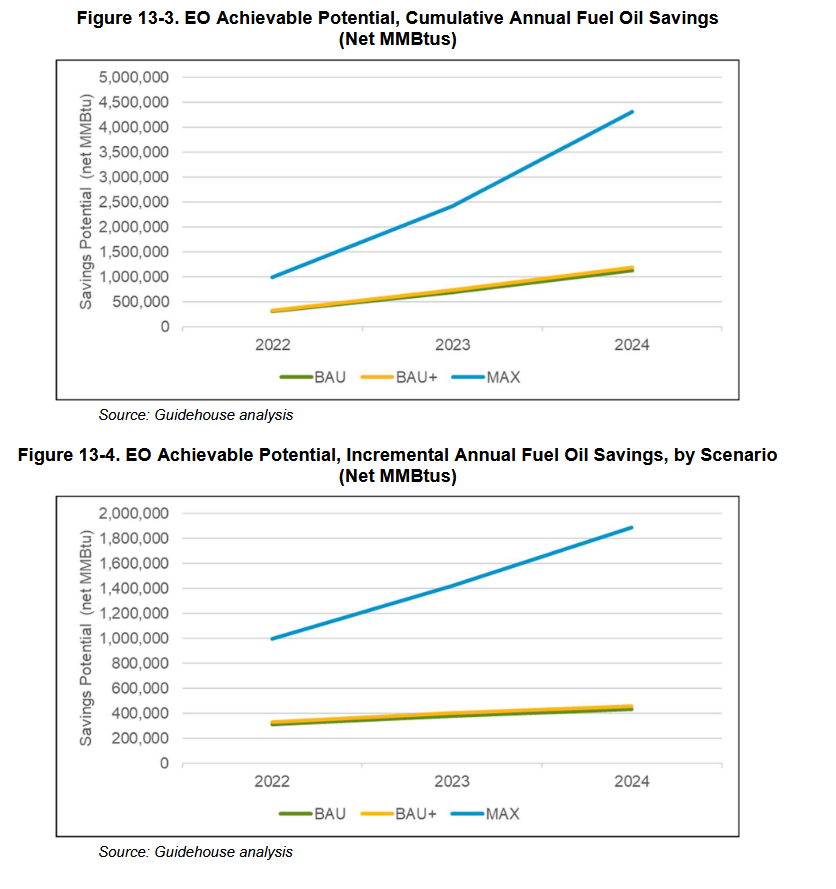
This graphic from the Dunsky study shows the relationship between the different potential constructs; it includes achievable potential at several different levels of incentives — BAU (business as usual, existing incentives), BAU+ and Max.
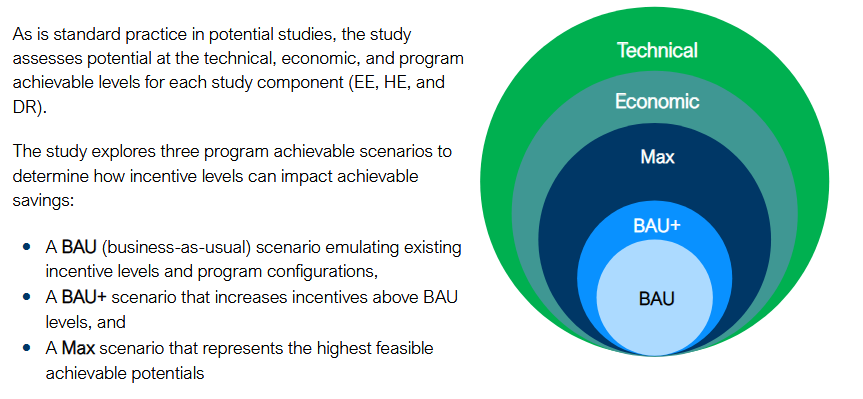
The studies conceive the Max scenario differently. For Guidehouse/National Grid, the Max incentive tested was “100% incremental cost-based incentives across the board”. Guidehouse Study, Appendix Page 1, packet page 17. For Dunsky/Eversource, the Max incentive was considerably less — $2,500/ton for air source heat pumps capped at 90% of full heat pump installation costs. Dunsky Study, page 104, packet page 391
Since our interest is to understand what the models say about how far we can get with heat pumps over the next few years, the “Max” level is most instructive.
Modeled Potential
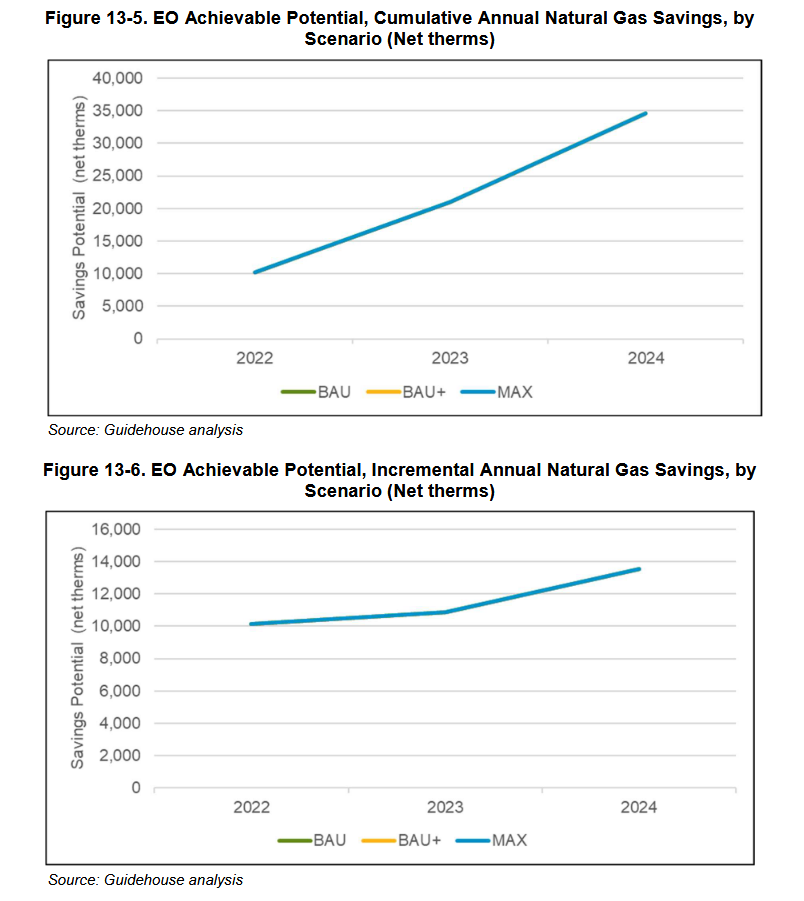
The two studies each outline their methodologies for computing Achievable Potential, but since they involve proprietary models — Guidehouse’s “DSM Potential tool” and Dunsky’s “Heating Electrification Adoption (HEATTM) model” — we can only compare the outputs. The technical and economic potential columns are not comparable between the two models because of the limitation to burnout events in the Dunsky model. But the final column — achievable potential, shows substantial agreement between the two models: Negligible annual gas conversions and modest annual oil conversions. The Guidehouse model, which assumes higher incentives, estimates somewhat achievable higher conversions than the Dunsky model — 5.4% vs. 1.4%.
Comparison of Alternative Measures of Potential
| Consultant Model /Customer Fuel | Technical Potential as % of Service Area Consumption | Economic Potential as % of Service Area Consumption | Achievable Potential as % of Service Area Consumption (Max Scenario — Annual) |
|---|---|---|---|
| Guidehouse/Gas | ~100% | ~0% | ~0% |
| Dunsky/Gas | 18% | 7% | ~0% |
| Guidehouse/Oil | ~100% | 86% | 5.4% |
| Dunsky/Oil | 19% | 17% | 1.4% |
Comparison of modeled potential to plan assumed potential
As to gas conversions, these modeled results are consistent with the negotiated Term Sheet. that was the basis of the three year — the plan contemplates converting a mere 0.1% (1804) of the 1,411,895 natural gas heated homes in the state.
As to oil conversions, the modeled rates are also roughly consistent with the three-year plan. The three year plan contemplates converting 6.9% (44,848) of the statewide 649,036 oil heated homes or 2.3% per year — intermediate between the annual rates suggested by the models. And, in fact, the actual $10,000 heat pump incentive being offered is intermediate between the incentives offered in the models.
The next three year plan could perhaps sustain a 5% annual conversion rate consistent with the Guidehouse model with a 100% capital cost incentive. Note that the 5.4% rate shown in the table is based on the third year of the model which assumes a rising rate of conversion consistent with technology diffusion — increased customer capacity and installer capability. It is possible that future rates could go higher. Arithmetic extension of the Guidehouse rates to reflect diffusion for another three years would take the average rate for the next three year plan to 9% per year. We’ll see how the current plan goes.
Appendix: Charts of Potential
These charts are the ones used for the input into the chart titled “Comparison of Alternative Measures of Potential.” They appear in two studies which are contained in a consolidated packet of studies termed Appendix F in the initial plan filing in the Three Year Mass Save Plan docket, 21-124 (DPU file room here).
- The Guidehouse Potential Study for National Grid (starts at page 1 of packet).
- The Dunsky Potential Study for Eversource (starts at page 255 of packet)
This spreadsheet shows the computations that translate the graphics excerpted below to the Comparison of Alternative Measures of Potential Chart.
Guidehouse/National Grid Study
Dunsky/Eversource
Will Brownsberger, November 2022