
Update, February 16, 2026
The charts in this post are a year old and have not been updated. Since the original posting, Mass Save costs have been reduced from $.03111/kwh to $.02506/kwh for Eversource (Eastern MA Service Area). Solar and renewable factors have not changed over the past year, while the EV factor has gone up from $.00138 to $.00238/kwh. The total of all these environmental charges is down modestly from $0.05390/kwh to $0.048850/kwh. If a typical non-heating customer uses approximately 530 kwh/month, they are now spending roughly $310 for these charges, including $160 per year for Mass Save. Of course, the exact amount depends on their utility and their electric usage. In addition to these charges, which appear within the delivery charge, ratepayers pay costs attributable to the Renewable Portfolio Standard; RPS costs are embedded in the cost of energy supply. RPS costs are only approximated in this post (at $.02384/kwh or $151.62 annually for a non-heating customer); RPS costs are likely to be trending slightly upward according to the Avoided Energy Supply Cost report, Tables 88-90. See updated spreadsheet.
After my last post on gas rates, a lot of people asked me about electric rates. Many households in my district heat with electricity (33.5% of households in Allston, Brighton, and Fenway). These households have felt bill pressure over the past heating season.
This post offers some analysis and recent history of electric rates in the eastern territory of NSTAR Electric Company (“Eversource”). This territory includes Cambridge, Watertown, and Boston. The post also compares Eversource rates to Belmont Municipal Light rates.
Some highlights:
- Over the last decade, electric rates have drifted upward a little faster than inflation.
- Rising regional transmission charges and rising environmental charges together account for a little over half of the increase.
- Policy driven environmental charges comprise a little more than 1/5 of total electric bills.
- Mass Save energy efficiency charges increased approximately 130% (more than doubled) from 2015 to 2025.
- Eversource and Belmont light rates are similar except as to policy-driven environmental charges, which are over 80% lower in Belmont.
- Eversource customers pay approximately $500 to $700 per year through their electric bill to support environmental polices. Belmont Light customers pay approximately $80 to $100 per year.
- Customers needing help paying their electric (or gas) bills can view resources here.
The outline of this post is as follow:
History of Eversource Rates
Chart 1: Components of Eversource residential rates applicable on January 1 — 2015 to 2025
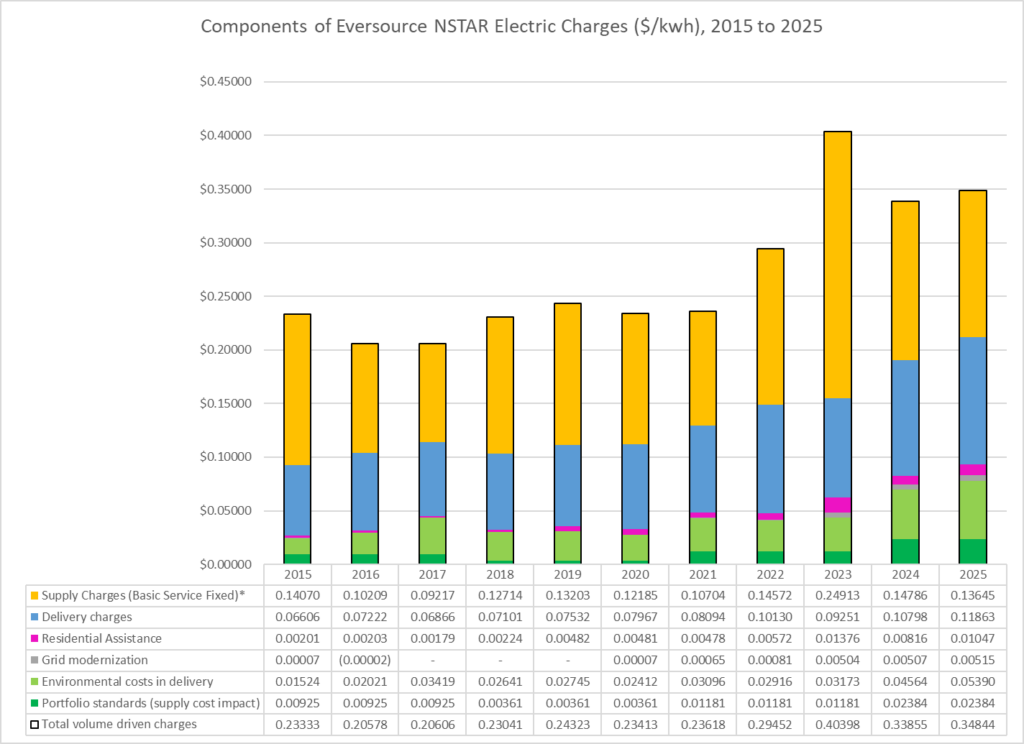
Chart 1 (above) and Chart 2 (below) show the history of the components of Eversource’s rates. Some notes about the charts:
- Rates are shown in dollars per kilowatt hour (kwh). For example, the total rate for Supply Charges in January 2015, which shows as 0.14070 is 14 cents per kwh. The “kilowatt hour” is the standard unit for measuring electric power for residential billing.
- The Supply Charges shown (the yellow top segment of each bar) are the rates for Eversource fixed Basic Service. In recent years, very few ratepayers actually pay this charge. While all ratepayers in Boston, Cambridge, and Watertown pay Eversource for delivering power to their home, most purchase their power from a municipal aggregator or competitive supplier. For a chart showing the declining share of basic service customers, see the 2021 Annual RPS Compliance Executive Summary at page 3. Charges from an alternative supplier are shown as such on the Eversource bill.
- The rates in the chart are the R1 Rates for non-heating customers. The R3 rates for heating customers are the same in most components, but the base distribution charge is a little lower (0.7 cents per kwh lower in January 2025). Low-income customers received a discount of 42% off these rates as of January 2025. The rates shown are for the eastern market area of Eversource or, in earlier years when the market area was not consolidated, the Boston portion of that area.
- The “Portfolio Standards” line in the chart is an estimate of the cost of compliance with Massachusetts laws that require power retailers to purchase a share of their wholesale power from renewable sources. These laws are referred to as renewable portfolio standards or “RPS.” The chart backs the RPS cost out of the supply charge, which normally includes it (whether power is purchased from Eversource or an alternative supplier). Expenditures for RPS compliance are treated as confidential in individual company rate filings and the estimates here are very rough modeled averages for all suppliers. The estimates appear in the Avoided Energy Supply Cost study. Eversource’s actual RPS compliance costs appear in this spreadsheet (received after preparation of graphics in this post); they are 1 to 2 cents per kwh higher than the estimates in earlier years, but less than .3 cents higher in 2024 and 2025.
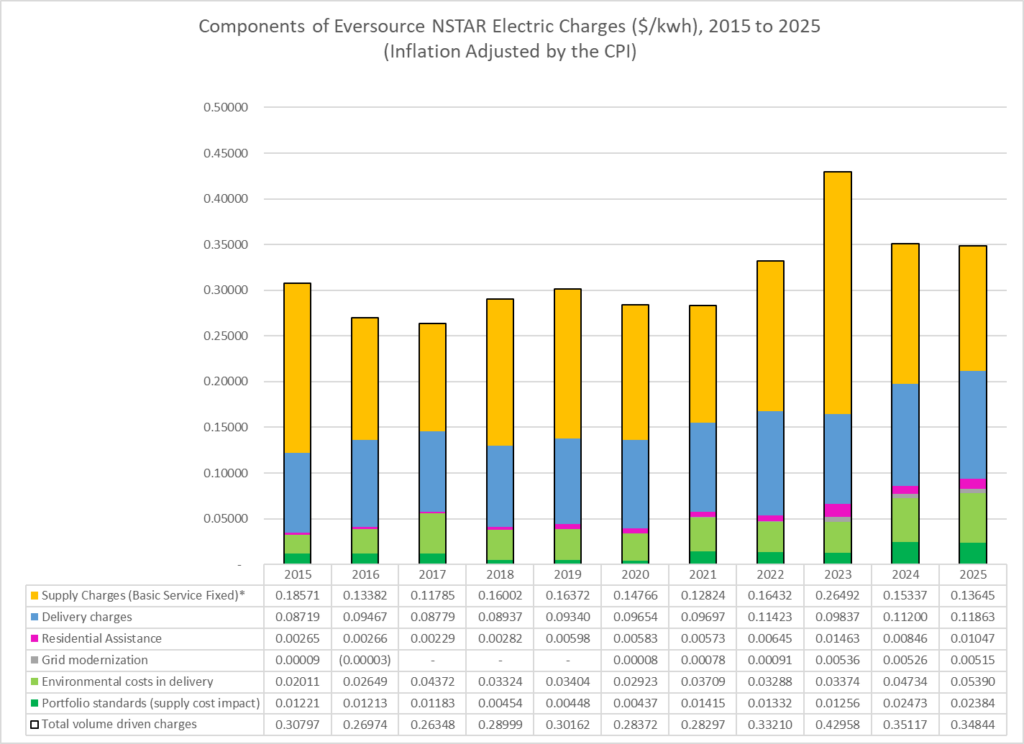
Chart 1 shows that costs other than power supply costs have more than doubled over the past 10 years. Chart 2 shows the same components adjusted for general price inflation. All non-supply components of the rate show increases in real terms.
Chart 2: Components of Eversource residential rates applicable on January 1 — 2015 to 2025
(inflation-adjusted by the Consumer Price Index for Urban Consumers in the Northeast)
Components of Eversource Rate
Focusing on rates as of January 2025, Chart 3 highlights the relative share of the components, using the same breakdown as in Charts 1 and 2.
Chart 3: Relative share of components of Eversource residential rate, January 1, 2025
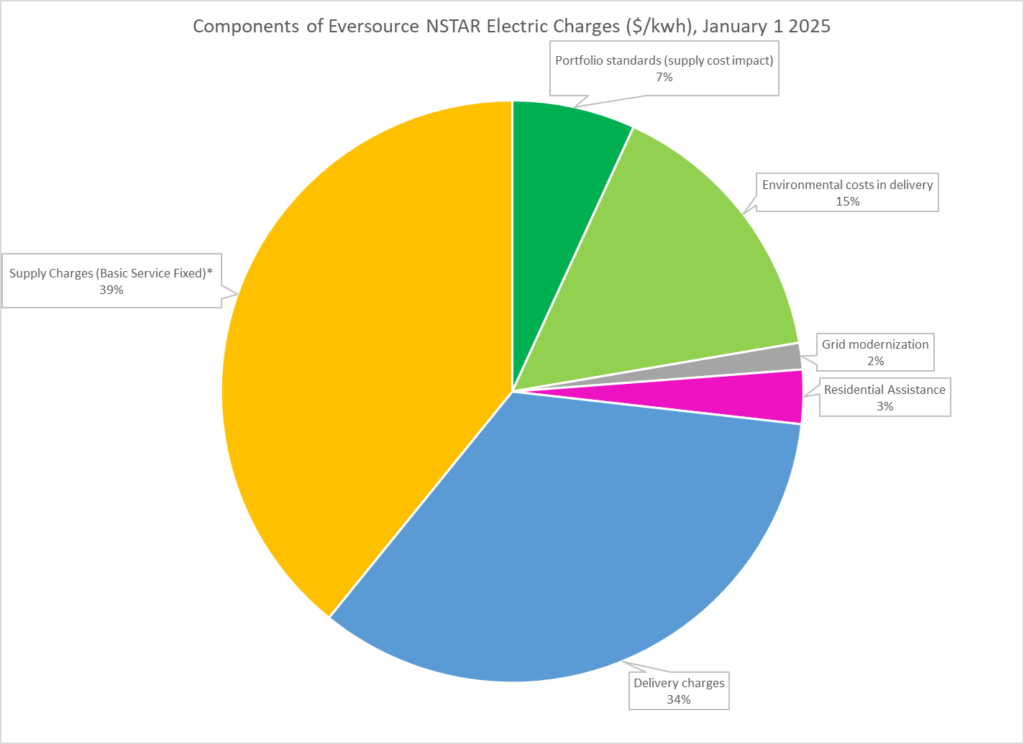
Looking at each of the components in turn as they appear in Charts 1 through 3:
- Supply Charges, the largest component of cost, have fluctuated, but have not trended upwards — basic service supply charges (excluding RPS costs) were lower in 2025 than in 2015. Natural gas now accounts for the majority of power generation in New England and over 75% of the power generation in Massachusetts. Nationally, natural gas prices have been flat to down for the past couple of decades; regional gas costs are more subject to seasonal spikes, but have followed the same trend. See national commodity gas prices here; for a comparison of national to regional gas prices, see Figure 3 in the 2024 Avoided Energy Supply Cost study. More expensive generators (coal, oil, nuclear) have reduced output or have been decommissioned. For power generation trends, see EIA-923 Power Plant Operations Report, downloadable here and analyzed in the attached sheet.
- Delivery Charges, the second largest component of cost, have risen from 6.6 cents to 11.9 per kwh since 2015 — an 80% increase or 36% when adjusted for inflation. Delivery charges as shown in this chart consist primarily of local distribution (53% in 2025) and regional transmission (38% in 2025). Costs for local distribution — the wires, transformers, and substations on the streets — have risen 35% since 2015, only slightly faster than inflation. Transmission charges, however, have more than doubled from $0.01915 to $0.04545. Transmission charges are regulated by the Federal Energy Regulatory Commission and transmission development is overseen by ISO-New England.
- Residential assistance — the cost of providing discounts to low-income ratepayers (spread across other ratepayers) — has drifted upwards relative to overall costs. In part, this reflects policy decisions to increase the low-income discount from 27% in 2015 to 42% in 2025. I have not analyzed how other factors explain the inflation-adjusted tripling of the costs of residential assistance program. Eligibility for assistance is based on participation in any of several means-tested programs like MassHealth.
- Grid modernization charges, including advanced metering infrastructure charges, are based on an initiative by the Department of Public Utilities dating back to 2012 (see DPU docket 12-76, especially final order). The DPU requires the electric utilities to develop grid modernization plans and to pursue grid modernization investments. DPU allows the utilities to recover these investments through dedicated charges. See for example DPU 24-58 in which DPU approved Eversource’s current charge of $0.00221/kwh for grid modernization or DPU 24-45 in which DPU approved Eversource’s current charge for advanced metering infrastructure of $0.00294/kwh.
- Portfolio standards — the rising cost of complying with renewable portfolio standards reflects (a) increases in the share of renewable energy that the standards require utilities to purchase; (b) layering of additional standards, for example the Clean Peak Standard. As noted above, the compliance costs of portfolio standards are built into supply rates on electric bills and are not published for individual utilities. The estimates shown in the charts above are modeled Massachusetts averages. For in-depth analysis of the costs of portfolio standards, see the 2024 Avoided Energy Supply Cost Study, Section 7 and DOER’s RPS Compliance Reports. As noted in this previous post there are modest additional charges built into supply costs (FCM and RGGI charges), which add approximately $0.0020/kwh to the rates; these costs are not reflected in the analysis here. Eversource’s actual RPS compliance costs appear in this spreadsheet (received after preparation of graphics in this post); they are 1 to 2 cents per kwh higher than the modeled averages in earlier years, but less than .3 cents higher in 2024 and 2025.
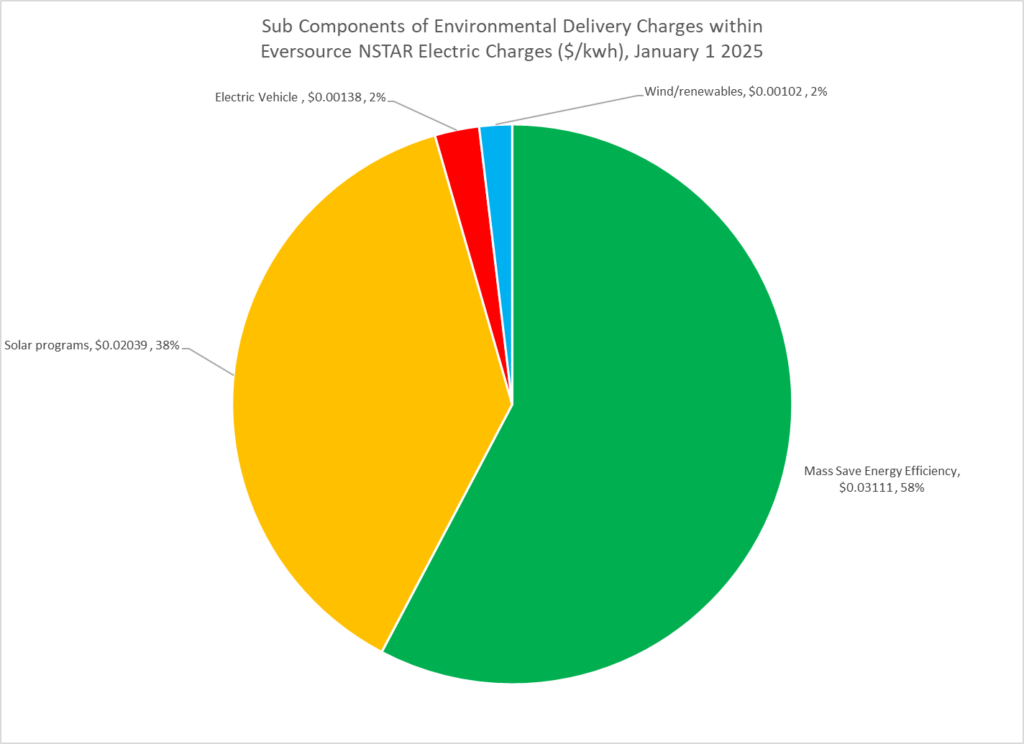
- Environmental Charges in Delivery — this component is composed of four types of charge illustrated in the graphic further below. Two types account for 96% of the environmental charges in delivery:
- Mass Save Energy Efficiency Charges increased approximately 130% (more than doubled) from 2015 to 2025. These charges are comprised of a fixed charge of $0.0025/kwh and a reconciling factor which is set periodically to cover the growing budget, $0.02861/kwh in 2025. For more discussion, please see this previous post.
- Solar programs. There are five distinct solar charges, but the Net Metering Recovery Surcharge and the Distributed Solar Charge (SMART) account for most of the category — the remaining three minor charges added up to a small net negative in 2025 rates.
- The Net Metering Recovery Surcharge (NMRS) accounts for 80% of solar program charges. Through the NMRS, “the electric distribution companies, including NSTAR Electric, recover from all ratepayers the costs for compensating net metering customers.” Order in DPU 24-171. Much of this goes to large standalone solar facilities. The NMRS more than doubled from 2023 to 2024 and will apparently remain at its current level through 2025 into 2026.
NOTE: When customers make a net sale of power back to the grid during a billing period, utilities generally pay them at the full retail rate and recoup these credits through the NMRS. (When customers use solar to merely reduce their energy needs, these bill reductions are recovered through the revenue decoupling charge, not by the NMRS.) For larger solar installations, the delivering utility is able to sell the power back to the wholesale market and the NMRS is reduced by the amount of these sales. For smaller solar facilities, residences and other loads that have their own distributed solar, sales into the wholesale market are infeasible. For these customers, there is no reduction to the NMRS to reflect their contributions to supply. At their current limited scale, the contributions of these small generators are absorbed as reductions in delivery losses: Power is lost within the delivery system; power suppliers always have to buy more power than they are paid for delivering and they price those expected delivery losses into supply contracts — if a collection of customers has some small distributed solar installed, then the pricing of power supply to that collection of customers will be reduced by the market to reflect the lower net delivery loss rate for that those customers. - The Distributed Solar Charge compensates the utilities for solar incentives paid to participants in the SMART program. The charge has increased since 2019 when it was instituted, but declined from 2024 to 2025. For more information, see Exhibits in DPU 24-174.
- The Net Metering Recovery Surcharge (NMRS) accounts for 80% of solar program charges. Through the NMRS, “the electric distribution companies, including NSTAR Electric, recover from all ratepayers the costs for compensating net metering customers.” Order in DPU 24-171. Much of this goes to large standalone solar facilities. The NMRS more than doubled from 2023 to 2024 and will apparently remain at its current level through 2025 into 2026.
Chart 4: Relative share of subcomponents of Environmental Costs in Delivery — these rate subcomponents add to 15% of total Eversource residential rate, January 1, 2025 (as shown in Chart 3)
Comparison to Belmont Light
Chart 5: January 2025 rate components — Belmont vs. Eversource
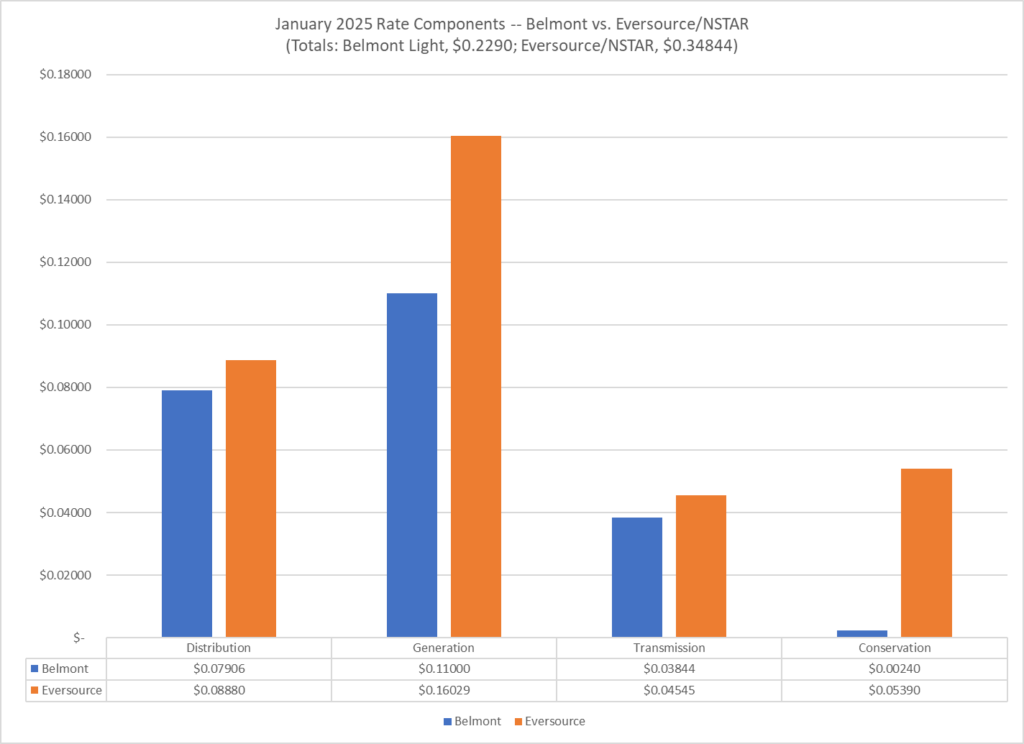
Eversource serves my constituents in Boston, Cambridge, and Watertown. Belmont has its own municipal utility. Chart 5 compares Eversource and Belmont Light Rates. Belmont Light last raised rates as of January 1, 2023.
- For comparability, the rate categories are simplified from the greater detail in the Eversource Charts above.
- “Distribution” combines the rate elements referred to in the Eversource charts above as “Delivery charges”, “Grid Modernization”, and “Residential Assistance.” However, it excludes Transmission charges (which were bundled with “Delivery” in the Eversource Charts). Distribution is a little higher for Eversource than for Belmont, but the difference is modest ($0.00974/kwh). This helpful Reddit post suggests that higher distribution costs are to be expected for Eversource given the the complexities of a dense urban grid, but the comparison cannot be made with confidence.
- The “Generation” charge comparison makes Eversource rates look high, but most Eversource customers do not buy power generation from Eversource, using alternative suppliers, likely municipal aggregators. Eversource is limited by law in its ability to buy longer term contracts, so its rates tend to fluctuate and Chart 5 reflects January rates.
- “Transmission” charges are similar, which is to be expected since Belmont receives its power through Eversource’s substation in Cambridge.
- The most striking difference is as to “Conservation” charges — Belmont’s “Conservation” charges are a small fraction of Eversource’s delivery charges for environmental policies (only $0.00240 vs. $0.05390/kwh, under 5%); Belmont’s per kwh conservation charge is also less than 10% of Eversource’s Mass Save charge alone ($0.03111). Belmont does provide residential incentives for heat pumps and other energy saving measures, but at a much more modest level than Mass Save and Belmont does not make the substantial investment in low income environmental improvements that Mass Save does.
- Note that Chart 5 does not include a measure of Renewable Portfolio Standard Compliance costs. These costs are left embedded in Generation charges. Belmont attempts to cover all of its purchases with renewable credits so that its power is 100% “green.” Belmont does publish (2024-05-15 Power Supply Presentation) the costs of its RECS (unlike Eversource), and they work out to only approximately $0.01/kwh — half the generic estimated level used in the Eversource charts above. While not segregated in Chart 5, RPS costs are included in the Bill Impacts table further below.
Bill Impacts
Table 1: Estimated annual bill impact of environmental policies at January 2025 rates
| Non-Heating Customer | Heating Customer | |
|---|---|---|
| Belmont Light Conservation Charge | $15.26 | $21.46 |
| Belmont Light approximate cost of 100% green policy | $63.60 | $89.40 |
| Belmont Light est. total cost of environmental policies | $78.86 | $110.86 |
| Memo: Eversource Mass Save Charge alone | $197.86 | $278.12 |
| Eversource Environmental Costs in Delivery (incl. Mass Save) | $342.79 | $481.84 |
| Statewide modeled average costs of RPS compliance | $151.62 | $213.13 |
| Eversource est. total cost of environmental policies | $494.41 | $694.97 |
Several notes about Table 1:
- Eversource estimates monthly usage of 530kwh for non-heating customers and 745kwh for heating customers in its bill impact spreadsheet filed for its energy efficiency plan three year plan. Table 1 shows annual bill impacts assuming these monthly average usage levels.
- As noted in this previous post there are additional modest indirect charges built into supply costs (the FCM and RGGI charges), which add very approximately another $12 per household per year; these charges are not included in table 1.
- Table 1 reflects January 2025 rates, before the Mass Save budget cuts ordered by DPU on February 28, 2025; these cuts will likely reduce the Eversource Mass Save charge by 15%, roughly $30 to $40.
- Note that Eversource’s actual costs of RPS compliance are slightly higher than the modeled statewide average — see discussion above.
Electric Rates in other Service Areas
The impact of policy-driven charges on electric rates in other service areas may be greater than in the Eversource area analyzed here. In building to the conclusion that the Mass Save budget for the 2025-2027 Three Year Plan should be cut by $500,000,000, the DPU made the following observation:
Notably, these Three-Year Plans are one of several legislatively mandated policy initiatives designed to further the Commonwealth’s critical energy policy goals. Initiatives such as net metering, the Solar Massachusetts Renewable Target (“SMART”) Program, off-shore wind and energy storage procurements, electric vehicle infrastructure programs, grid modernization, AMI, gas system enhancement programs, and ESMPs each deliver essential benefits to the residents and workers of the Commonwealth. And like the Three-Year Plans, these initiatives are also funded through reconciling mechanisms that allow the electric distribution and gas companies to recover the cost of these programs directly from ratepayers. Currently, when combined with energy efficiency, these programs constitute 17.5 to 24.5 percent of residential electric bills, depending on the Program Administrator (see, e.g., Exh. NSTAR-Electric-6 (Rev)).
DPU Order dated February 28, 2025 at page 208-9 in Three Year Efficiency Plan Docket 24-149 (emphasis added and link added).
In the analysis presented in this post, which reflects the latest rates (January 1, 2025 still effective in March 2025), the policy driven charges inventoried by DPU (environmental charges and grid modernization) comprise 16.9% of Eversource’s rates. Eversource’s bill impact exhibit, cited by DPU, shows a slightly higher policy-driven share, 18.0% in 2024 and 20.0% in 2025, but that exhibit is intended to isolate the impact of the increase in energy efficiency charges and as to 2025 does not reflect concurrent increases in other rate components. It does appear that as to policy-driven charges, Eversource is near the middle of the pack. Policy driven charges are relatively higher in some other utility service territories.
Note on executive compensation
After original publication of this post, a constituent wrote asking about executive compensation as a component of the increases. This question has to viewed on two different levels: (a) base and incentive compensation from the regulated NSTAR entity; (b) ownership compensation at the Eversource corporate level.
Base and incentive compensation
The Department of Public Utilities does review executive compensation — more broadly, employee compensation — as part of its Performance Based Rate reviews. Performance based rates are evaluated in depth every five years and updated annually. The last full update of NSTAR’s rates was in 2022, through DPU Docket 22-22. The final order in that case devotes over 20 pages (pages 149-171) to discussion of employee compensation issues, including a specific discussion of incentive compensation for executives. The company is required to demonstrate that there is parity between union and non-union compensation growth and that non-union compensation is reasonable — in relation both to business strategy and to similar jobs in other companies. NSTAR’s submissions on these issues were not contested by any party in the heavily litigated proceeding. Non-union incentive compensation was finalized at a total of $6.5 million with an additional $0.6 million for the CEO and CFO — see pages 158, 160 (note 82), and 164 of the final order. The Massachusetts supplement to FERC Form 1 details base salaries for the top compensated officers in 2022 in the lower six figures. These are relatively small amounts in the context of NSTAR’s roughly $5 billion in total revenue (page 533 of the final order; note that roughly $1 billion in revenue is derived from base distribution charges, which account for 6 cents per kwh in residential rates).
Ownership compensation
Notwithstanding his limited salary and incentives within the regulated NSTAR entity, NSTAR’s Chair, Joe Nolan, is also compensated (a) with salary and incentives paid by ratepayers in other territories served by other Eversource companies and (b) with stock and other ownership interests. Neither category of additional compensation is paid by NSTAR electric ratepayers. The ownership compensation is paid effectively by the company investors. Including all his additional compensation, his total package in 2022 was reported at over $13 million. That compensation rose to $19 million in 2023, ranking him 9th among major utility executives nationwide. While very high executive compensation levels across the economy are deeply troubling, state utility regulators appear not to have a handle that would allow them to address this excess. See this discussion from the New Hampshire consumer advocate. To keep the numbers in perspective, if $10 million per year from this package were all rebated to NSTAR customers (giving nothing to customers of other service areas), the rate impact would be approximately $0.00050 per kwh hour, as compared to a total 2025 rate of $0.34844 per kwh hour. [As a comparison, the statutory systems benefit charge of $0.0025/kwh yields approximately $50 million in revenue to NSTAR according to Appendix C of the 2025-27 three year plan.]
Resources
- Spreadsheet of all computations and sources in this post (with Feb 2026 updates)
- Eversource actual RPS compliance costs: 1 to 2 cents per kwh higher than the presented estimates in earlier years, but less than .3 cents higher in 2024 and 2025. (Added 4/3/2025, after publication of graphics)
- EoEEA Powerpoint — Utility Rates 101
- DPU’s bill explanation page
- Governor Healey’s Energy Affordability Agenda
- Assistance with paying utility bills
- Additional background resources on gas and electric costs
- What’s in my electric bill (online bill analysis tool)
Links to Eversource Rate Filings in DPU File Room
| Rate year | DPU Docket | Summary rate filing file name (rate sheet as of 1/1 for rate year) |
| 2015 | 14-121 | NSTAR_rev_umbrella_filing_121814.pdf |
| 2016 | 15-152 | Eversource_Supp_Filing_12-1-15.pdf |
| 2017 | 16-172 | Updated_Initial_Filing_12-1-16.pdf |
| 2018 | 17-157 | EV_updated_filing_12-1-17.pdf |
| 2019 | 18-120 | Exhibit_ES-MQ-79_and_10_Umbrella_Revised.xlsx |
| 2020 | 19-122 | Summary_Rate_Tariff_Compliance_Filing_12-30-19.pd |
| 2021 | 20-124 | M.D.P.U.No.1-21-BNSTARSummaryTariff_Approved.pdf |
| 2022 | 21-131 | NSTARElectricDPU21-131ComplianceSummaryRateTariff |
| 2023 | 22-131 | NSTARElectricDPU22-131RevisedSummaryRateTariffFil |
| 2024 | 23-111 | DPU23-111SummaryTariff.approved.12.29.23.pdf |
| 2025 | 24-171 | NSTARDPU24-171UpdatedRateFiling(11-27-24).pdf |
Text last updated on March 16, 2025
Thank you for this detailed information, Will. I love studying this type of data. The bottom line, I hope you (as any rational individual) will agree, is that the state needs to fund environmental programs (in particular, MassSave) and low-income assistance, from the general fund–or at least share in the burden of these programs. The cost of moving to green energy is high. Massachusetts as a state must absorb more of the cost rather than regular working people who pay their bills. Also, one cannot continue to increase discounts to lower income people (Healey for instance suggesting a 70%+ discount recently) by spreading this cost to full-paying rate payers. Such an approach is unsustainable (and actually frightening for rate payers), particularly when the overall population of the state is increasingly skewing to lower income ratepayers (i.e., net outmigration of higher-income individuals, as noted in census data now for many years). People will simply leave the state. I work part-time at U. Mass. Lowell as a professor. We have not had a raise or an agreed-upon contract in 3-4 years, btw–making the escalating energy costs truly intolerable.
I hear and share the concern about the burden, but I don’t think that there is a general fund alternative. At this stage, I’m working on understanding the numbers and making them transparent. Ultimately, we are going to have to make some hard choices.
Thank you for the response, Will. Yes. You can’t make the move to green energy without sacrificing other priorities and programs. There’s an old saying, “you can’t eat your cake and have it, too.” Choices are necessary.
Ok, thank you, and for showing up for the town hall. This is all Chinese to me, but thanks anyways..
Thank you for this detailed research and explanation. I can see it’s complex. However, the recent jumps in my Eversource bills seems inexplicable. It was a shock when I saw a bill that was essentially double that of the month before — in the same season! I don’t get how this can happen. Is there appropriate oversight?
This happened because our lovely president decided to alienate our chief supplier of energy (Canada, in some parts of the US ) with heavy tariffs. It’s retaliation, and to be expected.And excuse my last response..Be well everyone.
Take a close look at your electric bills over the last few years. The dramatic rate increases over the past few years are primarily from added fees to pay for green environmental and welfare assistance programs.
The electric company lobbyists have also enticed the legislature to raise rates far above what is needed to cover their own actual costs increases. The electric companies like National Grid have experienced some of their highest profitability ever during this period.
It has nothing to do with very recent leveling tariffs across nations like Canada who already had tariffs on U.S. goods.
great analysis Will.
I appreciate the analysis, senator
I have been able to compare electricity issues between Belmont and Jeffrey NH. In MA, there has been much more regulatory capture (even in municipally owned power plants like Belmont) than in NH. This was obvious watching how net metering was handled. Now in NH, even though we have to use Eversource for distribution, we can choose community power for generation, and community power can be 100% green if you so choose. I have seen the generation portion of my NH bill drop, while the distribution portion increases (mostly because climate change now requires more maintenance),
Senator: Can you do a similar analysis for Gas.
For instance, today my charges per Therm (29.3KWh per browser) are:
Supply Peak: 0.8466 per Therm or 0.0288 per KWh (Much cheaper than electric)
Delivery Peak 0.9799 per Therm or 0.0334 per KWh (More than the gas)
Distribution Adjustment 0.668 per Therm or 0.0227 KWh (Environmental Charges)
If you do the charting you will see that 2/3rd of the cost is distribution and environment.
I don’t have my bills from 2015 but certainly the charges were much lower.
My perception is that the rate payers for gas are paying even more for the transition and if we are still using 75% gas to generate electric this is captured also in the direct cost of the electric so a good percentage of that fee is also environmental charges. I’d love to see the same analysis for this as your team did for electric rates, including the segmentation of the indirect climate charges associated with the 75% gas generation costs built into the base electric fee.
ps.) The Governor is now talking about preventing us the choice of provider for electric to save us money? I don’t understand why she wants to decide what is good for us, we are adults, not children. Choice is a key American value.
The gas analysis is here.
This discussion with an electrical engineer in Massachusetts is worth watching. He seems pretty knowledgeable and speaks to costs associated with new electrification-related building codes. https://www.youtube.com/watch?v=lBXwIkCUyQc&t=4522s
If it wasn’t clear why the State has been pushing relentlessly to convert to electric everything it sure is now.
All of the non-essential added fees are nothing more than thinly veiled taxes hidden in the form of fees. This practice needs to end. If you want to fund so-called green environmental or low income assistance welfare programs do it openly and stop forcing people to pay for it through this back-door type of taxation.