
If you wish to comment on the transportation issues raised by the survey, please do so on this new thread.
Key Takeaways
- At least in this sample, neither MBTA ridership nor road traffic (including all road modes — auto, bike, walk) is likely to soon rebound to pre-COVID-19 levels, even after businesses reopen. The shift to working from home will keep traffic down in all modes and safety concerns will additionally depress MBTA ridership. Working from home is the dominant factor and will keep road traffic down even as some MBTA riders shift to driving.
- Support for social distancing remains strong — 54% feel that the phased reopening is going at the right pace, 39% feel we are reopening too fast and 6% feel we should be opening faster.
Summary of Survey
- A total of 1,737 people responded within approximately 24 hours to an email and Facebook survey initiated on the afternoon of Tuesday, May 26. The survey questionnaire appears here.
- Support for social distancing remains strong — 54% feel that the phased reopening is going at the right pace, 39% feel we are reopening too fast and 6% feel we should be opening faster.
- In this sample, 30% are concerned about their financial security currently or over the next few months.
- Currently, in this sample, 10% are unemployed and 58% are working from home.
- Among regular MBTA riders (at least one day per week) before COVID-19, 61% now say they are “too concerned about disease transmission to ride the MBTA, at least until doctors develop vaccines or better treatments for COVID.”
- Among regular MBTA rirders (at least one day per week) before COVID-19, 75% say their MBTA use is likely to “stay down at least until a vaccine or treatment is developed.”
The following chart shows how in this sample, continued working from home and concerns about MBTA safety are likely to keep both traffic and MBTA ridership down.
People within total sample of 1,737 who are leaving home for work before, during shutdown, and in the months after reopening — by actual and expected MBTA use level (less than one day per week, one or two days per week, more than two days per week).
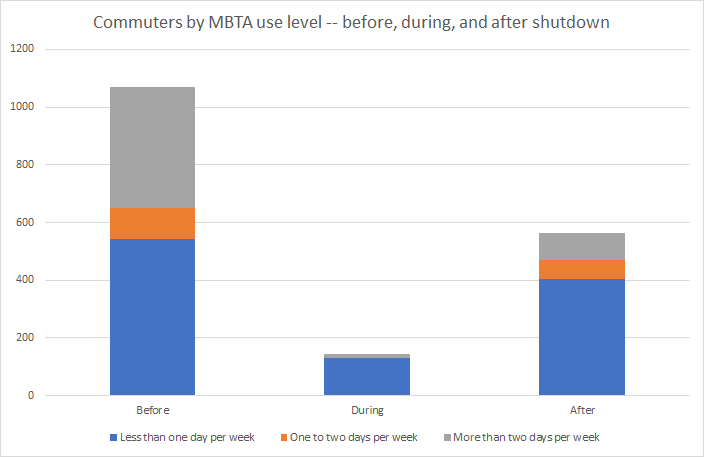
The blue bottom area of each bar represents non-MBTA commuters. The overall level of expected non-MBTA commuting is expected to be down in the coming months, even with some shift from MBTA to non-MBTA commuting. The grey area in each bar represents the most regular MBTA users (more than 2 days per week); this group remains much smaller in the after-shutdown period. The after-shutdown time frame in the survey was worded as “after businesses reopen, but before the discovery of a vaccine or treatment for COVID-19”.
The results are broadly consistent with recent statewide polling and national polling as to distancing attitudes. As to ridership and commuting changes, the poll is broadly consistent with a recent statewide poll by MassInc.
Survey Process and Sample
The survey outreach was almost identical to that of our March and April surveys – including direct email, news group email and Facebook, reaching people mostly in my Belmont/Watertown/Boston district. The email distribution was slightly smaller reflecting an update of our voter/resident list and deletion of people who may have moved away.
Email delivery started at approximately 4PM on Tuesday afternoon, May 26, 2020 and the Facebook post went up about the same time. Email delivery was complete at approximately 9PM on the same day and the survey was closed 24 hours later at 9PM on Wednesday, May 27. There were no major changes of social distancing policies in Massachusetts while the survey was open. In the sample of 1,757, there were 20 instances of 2 submissions from the same browser/IP combination in under ten minutes, likely dups. Only the second of these submissions were included in the final sample, yielding 1,737.
As discussed in connection with the the March and April surveys, “the outreach heavily targeted people who are engaged in their local community. It should be added that the outreach would especially favor those interested in online discussion of issues, especially issues of state policy.” These engaged people were sent an email which did indicate that the survey related to transportation and COVID-19. The Facebook post more explicitly indicated an interest in how COVID-19 impacted transit ridership, but the Facebook post got very limited response.
The overall response (1,737) was below the April survey (2,662) which was below the March survey (3,259). The declining response may indicate that people are getting a little tired of COVID news and discussion, but may also reflect weather and the slightly smaller distribution.
The age and geographic distribution was similar to the previous surveys.
Age of Respondents (self-reported)
| 24 or Under | 13 | 1% |
| 25 to 64 | 1152 | 66% |
| 65 or over | 572 | 33% |
| TOTAL | 1737 | 100% |
Zip code of Respondents (self-reported)
| 02115 (East Fenway) | 62 | 4% |
| 02116 (Back Bay) | 87 | 5% |
| 02134 (Allston) | 45 | 3% |
| 02135 (Brighton) | 282 | 16% |
| 02215 (West Fenway) | 65 | 4% |
| 02472 (Watertown) | 415 | 24% |
| 02478 (Belmont) | 524 | 30% |
| All other | 257 | 15% |
| TOTAL | 1737 | 100% |
Results
Question 1: View of Massachusetts’ COVID-19 response so far
| The pace is right at this time. | 947 | 55% |
| We need to reopen faster. | 107 | 6% |
| We are opening too fast. | 683 | 39% |
| TOTAL | 1737 | 100% |
Question 2: Economic Situation
| Cannot pay bills due now. | 26 | 1% |
| OK now, but concerned about the next few months. | 503 | 29% |
| Secure for at least the next year. | 1208 | 70% |
| TOTAL | 1737 | 100% |
Question 3: Current Work Status
| Leaving the home to work. | 143 | 8% |
| Retired, partner works, other. | 405 | 23% |
| Unemployed. | 175 | 10% |
| Working mostly at home. | 1014 | 58% |
| 1737 | 100% |
Commuting Status before COVID-19, during shutdown, and expected “after businesses reopen, but before the discovery of a vaccine or treatment for COVID-19”
| Before | During | After | |
| Not working | 452 | 580 | 450 |
| Working outside the home | 1070 | 143 | 562 |
| Working from home | 215 | 1014 | 725 |
| Total | 1737 | 1737 | 1737 |
MBTA Use level before COVID-19, during shutdown, and expected “after businesses reopen, but before the discovery of a vaccine or treatment for COVID-19”
| MBTA Use | Before | During | After |
| Less than one day per week | 999 | 1689 | 1464 |
| One to two days per week | 225 | 27 | 167 |
| More than two days per week | 513 | 21 | 106 |
| Total | 1737 | 1737 | 1737 |
MBTA Use among those working outside the home before COVID-19, during shutdown, and expected “after businesses reopen, but before the discovery of a vaccine or treatment for COVID-19”
| MBTA Use | Before | During | After |
| Less than one day per week | 543 | 129 | 403 |
| One to two days per week | 108 | 2 | 68 |
| More than two days per week | 419 | 12 | 91 |
| Total | 1070 | 143 | 562 |
Perception of MBTA safety among those who were riding the MBTA at least 1 day per week prior to COVID-19.
| Concerned about disease transmission on the MBTA, but can take adequate personal precautions. | 262 | 36% |
| Too concerned about disease transmission to ride the MBTA, at least until doctors develop vaccines or better treatments for COVID. | 453 | 61% |
| Not concerned about disease transmission on the MBTA. | 23 | 3% |
| Total | 738 | 100% |
Summary statement of expected MBTA use change among those who were riding the MBTA at least 1 day per week prior to COVID-19.
| No response | 6 | 1% |
| Is likely to stay down at least until a vaccine or treatment is developed | 553 | 75% |
| Has not changed | 19 | 3% |
| Is down temporarily, but will rebound as businesses reopen. | 160 | 22% |
| Total | 738 | 100% |
Data Availability
The underlying anonymous data and detail tabulations can be downloaded in spreadsheet form here.
The comments posted below begin with comments that people made after having taken the survey but before the posting of the results at 9:20PM on May 28.