95% support Massachusetts’ social distancing policies or feel we should go further.
96% expect we will take a long time to get back to normal or will have to adapt to a permanent new normal.
Summary of Survey
A total of 2,662 of people responded to an email and Facebook survey initiated on Saturday, April 25, 2020, with 85% responding on that day.
As to Massachusetts’ COVID-19 response, only 5% of respondents stated “We have gone too far — the economic impact is not worth it.”
Public support for social distancing remains strong: 65% felt “The balance is right at this time” and 30% felt “We have not gone far enough — people are still doing unnecessary and unsafe things.”
As compared to the March survey which was completed mostly before the Governor’s non-essential business closures of March 23, the group feeling “We have not gone far enough” has declined from 54% to 30%, while the group feeling “We have gone too far” has increased slightly from 3% to 5%.
9% reported that they were unemployed as a result of the epidemic while 3% reported they were previously unemployed. The newly unemployed were somewhat more likely to feel our response has gone too far (12%) than the respondents as a whole (5%), but 88% of them felt we have the balance right or have not gone far enough.
The share of respondents currently behind on bills dropped slightly from 3% to 2%. This group was more likely to feel we have gone too far (29%) than the respondents as a whole (5%), but 70% of them felt we have the balance right or have not gone far enough.
Almost half of respondents (49%) believe that “The virus may change our lifestyles in permanent ways. We may have to adapt to a new normal.” An additional 47% expect that “We will get back to normal eventually after a long period involving at least some retrictions.” Only 3% of respondents expect that “We will get back to normal pretty soon.”
As noted further below and in the discussion of the March survey the survey methods are not designed to be representative. They reflect people who are engaged in the community or in political issues, mostly within my senate district. However, the sample size is large at 2,662 and the results are broadly consistent with recent statewide polling and national polling.
Survey Outreach
The survey outreach was identical to that of the March survey — including direct email, news group email and Facebook, reaching people mostly in my Belmont/Watertown/Boston district. As before, the survey was entirely anonymous.
Survey Timing
Email delivery occurred starting at approximately 8AM on Saturday morning, April 25, 2020 and the Facebook post went up about the same time. The survey was closed a little after 11AM on Monday, April 27. The survey was open for approximately 51 hours. However, 80.5% of the responses came in during the first 12 hours and 87.2% came in during the first 24 hours. There were no major changes of social distancing policies in Massachusetts while the survey was open.
Date
Hour
% of response
cumulative % of response
Saturday, April 25, 2020
8
1.8%
1.8%
Saturday, April 25, 2020
9
14.9%
16.7%
Saturday, April 25, 2020
10
13.6%
30.3%
Saturday, April 25, 2020
11
12.3%
42.6%
Saturday, April 25, 2020
12
10.0%
52.7%
Saturday, April 25, 2020
13
8.3%
60.9%
Saturday, April 25, 2020
14
5.4%
66.3%
Saturday, April 25, 2020
15
3.9%
70.2%
Saturday, April 25, 2020
16
2.6%
72.8%
Saturday, April 25, 2020
17
3.0%
75.8%
Saturday, April 25, 2020
18
3.2%
78.9%
Saturday, April 25, 2020
19
1.5%
80.5%
Saturday, April 25, 2020
20
1.3%
81.8%
Saturday, April 25, 2020
21
1.4%
83.2%
Saturday, April 25, 2020
22
0.9%
84.1%
Saturday, April 25, 2020
23
0.8%
84.9%
Sunday, April 26, 2020
All
11.5%
96.4%
Monday, April 27, 2020
Up to 11AM
3.6%
100.0%
Survey Participation — Sample Characteristics
Our outreach methods were not designed to produce a representative sample of the community. As discussed previously, the outreach heavily targeted people who are engaged in their local community. It should be added that the outreach would especially favor those interested in online discussion of issues, especially issues of state policy. These engaged people were sent an email with a fairly neutral subject line, exactly as in the March survey or viewed an identically worded Facebook post.
For reasons that are unclear, the 24 hour response to survey was only 71% of the 24 hour response for the March survey. This does not appear to reflect survey timing. We left the survey open through Sunday into Monday (an additional 27 hours covering the same weekdays that the March survey was open ), but did not gather much additional response. The final total response to the survey was 2,662 (excluding 12 consecutive entries from the same browser/ip combination in a period of 40 minutes) as compared to 3,259 for the prior survey. The lower response may reflect factors like what the weather was when the email hit people’s inbox or perhaps people are getting a little tired of COVID news and discussion.
The age and geographic distribution was similar to the March survey. Those 65 and over were slightly more heavily represented at 35% as opposed to 29% in the March Survey.
Age of Respondents (self-reported)
24 or Under
50
2%
25 to 64
1676
63%
65 or over
936
35%
TOTAL
2662
100%
Zipcode of Respondents (self-reported)
02115 (East Fenway)
97
4%
02116 (Back Bay)
131
5%
02134 (Allston)
76
3%
02135 (Brighton)
426
16%
02215 (West Fenway)
109
4%
02472 (Watertown)
551
21%
02478 Belmont
860
32%
All other
412
15%
Total
2662
100%
Completed March Survey (self-reported)
Completed March
1122
42%
First Time Participant
1084
41%
Not sure
456
17%
Total
2662
100%
Detailed Results
The full text of the questions can be viewed at this link. The main difference from the March survey was that we did not include an “other” option. We dropped the “shelter in place” question, which people interpreted in different ways and we added a question about outlook for the pandemic.
Question 1: View of Massachusetts’ COVID-19 response so far
Have not gone far enough
790
30%
Balance right at this time
1734
65%
Have gone too far
138
5%
Question 2: Work Situation
Retired, at home, etc.
657
25%
Leaving home to work
210
8%
Unemployed prior
71
3%
Unemployed by COVID
249
9%
Working from home
1475
55%
Total
2662
100%
Question 3: Financial Situation
Behind on bills
62
2%
OK but concerned
857
32%
Secure for the next year
1743
65%
Total
2662
100%
Question 4: Expectations for Pandemic Course
Back to old normal in time
1263
47%
New normal
1312
49%
Back to old normal soon
87
3%
Total
2662
100%
Crosstab A: View of response vs. age
Age
Not enough
Just Right
Too Far
24 or Under
58%
36%
6%
25 to 64
30%
64%
6%
65 or over
28%
69%
3%
Crosstab B: View of response vs. zipcode
Not enough
Just Right
Too Far
02115 (East Fens)
33%
60%
7%
02116 (Back Bay)
33%
63%
4%
02134 (Allston)
37%
59%
4%
02135 (Brighton)
35%
60%
5%
02215 (West Fenway)
39%
60%
2%
02472 (Watertown)
32%
63%
5%
02478 (Belmont)
24%
71%
5%
All Other
28%
66%
6%
Crosstab C: View of response vs. work situation
Not Enough
Just Right
Too Far
Retired, at home, etc.
26%
71%
3%
Leaving home to work
35%
57%
9%
Unemployed prior to COVID
32%
62%
6%
Unemployed by COVID changes
31%
57%
12%
Working from home
30%
65%
4%
Crosstab D: View of response vs. financial situation
Not Enough
Just Right
Too Far
Behind on bills
35%
35%
29%
OK but concerned
37%
56%
7%
Secure for a year
26%
71%
3%
Crosstab E: View of response vs. pandemic course
Not Enough
Just Right
Too Far
Back to old normal in time
22%
73%
5%
Possible new normal
39%
58%
3%
Back to old normal soon
2%
53%
45%
Crosstab F: View of response vs. prior survey participation
Not Enough
Just Right
Too Far
Completed March
28%
69%
4%
First Time Participant
31%
61%
7%
Not Sure
31%
66%
3%
The anonymous row by row results can be downloaded in spreadsheet form for additional analysis here.
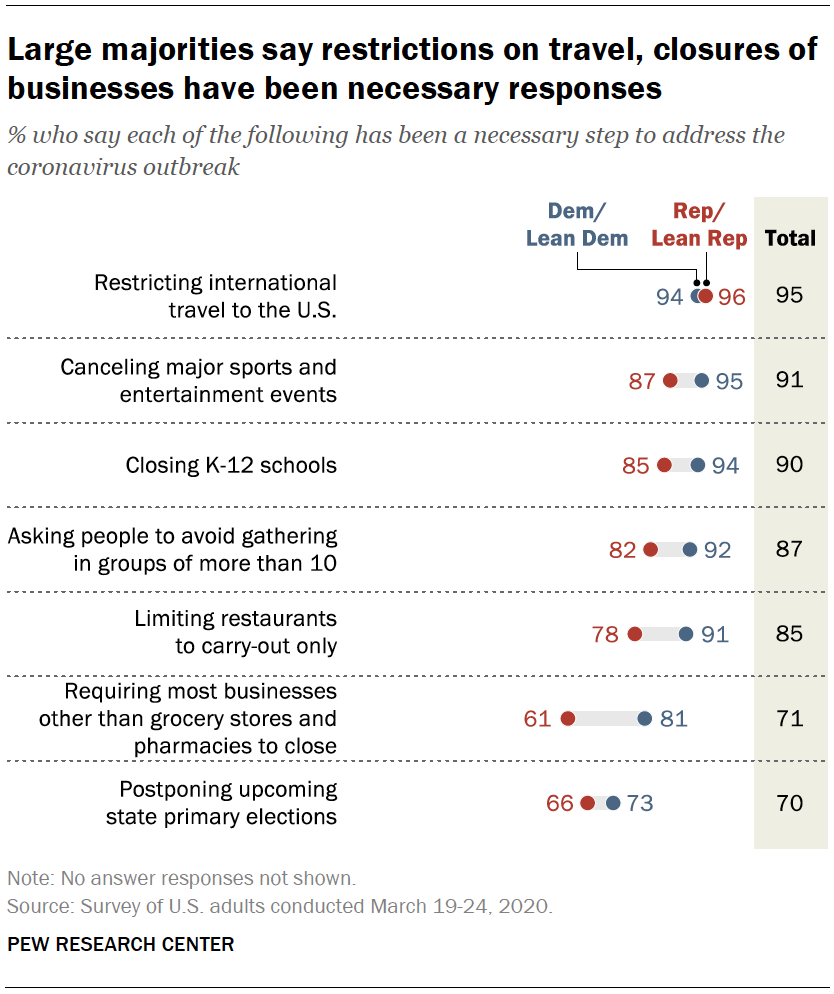
Comparison to National Polling
Its timing is different and its questions are different, but the following poll from the Pew Research Center is broadly consistent with the present survey in showing strong support for social distancing.
Published by Will Brownsberger
Will Brownsberger is State Senator from the Second Suffolk and Middlesex District.
View more posts