
Several observations suggest that the role of legislative enactments in the state prison population increase was limited:
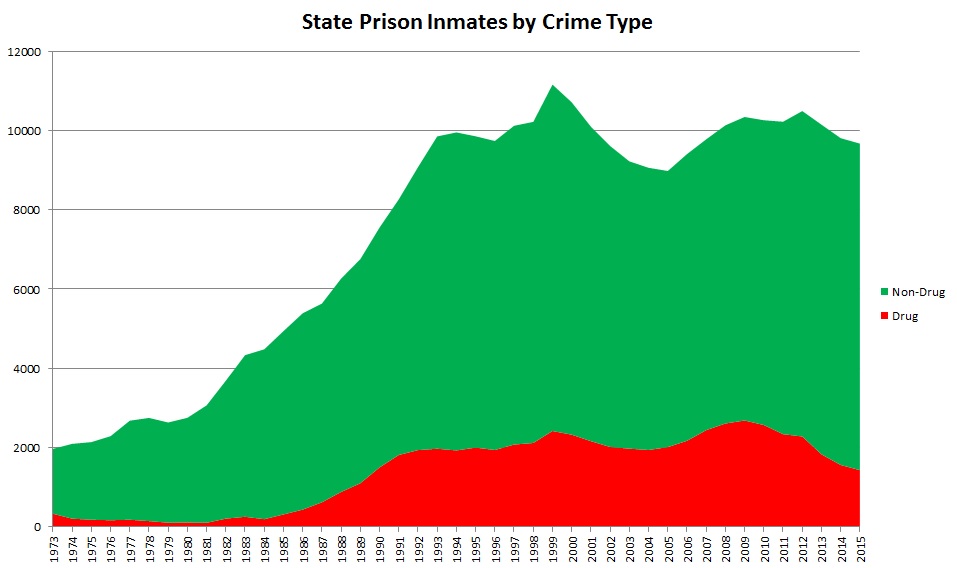
- Drug sentences — mandatory and non-mandatory — have accounted for at most 26% and often much less of the state prison population. Drug offenders are currently only 15% of the state prison population. That places an upper bound on the contribution of drug mandatory sentences to the five-fold state prison population growth. Further, in some cases, judges would have sentenced to incarceration without the threat of a mandatory, so only a hard-to-estimate fraction of the drug prison population is due to the mandatories.
- The historical expansion of drug mandatory sentences did not coincide with the historical increase in state prison population:
- Second offense heroin distribution carried a minimum mandatory state prison sentence of 10 years (not-suspendable) in the 1957 drug laws. Acts of 1957, Chapter 660, Section 212A.
- The major recodification in 1971 ( Acts of 1971, Chapter 1071), added a second offense minimum mandatory of 5 years for cocaine distribution (but may not have prohibited suspension of the sentence).
- The trafficking penalty enhancements in 1980 (Acts of 1980, Chapter 436) completed the state prison penalty structure that remains largely intact to today (with some tweaks up and down) — stiff second offense mandatories (5 years for heroin, 3 for cocaine), longer weight mandatories, no suspension or other procedural dodges allowed.
- Yet, the drug population in state prison remained stable in the low hundreds until the mid-eighties when the crack epidemic began to tear through communities of poverty and color. The drug population went up by a factor of six in six years from 1985 to 1991. The state prison population for non-drug offenses had already begun to surge 10 years earlier.
- Of course, we don’t know how law enforcement and the courts would have responded to the crack epidemic without the minimum mandatories — the crack epidemic might not have led so directly to prison population growth. But the timing of the increase suggests that the explosion of cocaine use on the streets was the proximate cause of the growth in drug incarcerations.
- The other new major drug mandatory was the school zone sentence in 1989, but drug commitments to state prison actually declined after the school zone was introduced, perhaps because it made a long House of Correction sentence available as an alternative for prosecutors. The House of Corrections drug commitment rate did not jump sharply after the school zone was introduced, but it did not fall like the state prison drug commitment rate. See Massachusetts Sentencing Commission, Report to the General Court, Figures 7 and 8 (1996).
- Other penalty enactments during the run-up in state prison population from the 70s to the early 90s impacted primarily at the House of Correction level — the 1974 gun bill, the various OUI bills, domestic violence restraining orders — and/or related to relatively low volume crimes (e.g., against the elderly, motor vehicle homicide).
Non-legislative factors that could explain the rise include, of course, the stunning rise in crime itself and discretionary responses to that rise by communities, law enforcement and the courts.
Parole board release decisions do not seem to be a likely factor. Parole release rates are measurable and correlate obviously with administration philosophy: After peaking at 70% during the Dukakis administrations, state prison parole release rates hit lows in the King administration (51%) and the Weld administration (33%), bounced back to 66% during the first Patrick administration and then fell back to 41% in 2011 after the Cinelli murder. See Parole Board Annual Report, 2012 and prior reports. However, it is not feasible to directly quantify the impact of changing parole rates on population. Parole rates were highest during the Dukakis years, but during these years the prison population expanded most rapidly. Parole rates may be a consequence of population pressures as well as a cause.
State Prison Population -- by Main Offense Type (as of January 1): 1973 - 2015
| Total | Person | Sex | Property | Drug | Other | Unknown | |
|---|---|---|---|---|---|---|---|
| 1973 | 1970 | 1111 | 165 | 285 | 334 | 75 | |
| 1974 | 2096 | 1345 | 192 | 279 | 210 | 55 | 13 |
| 1975 | 2140 | 1430 | 236 | 244 | 182 | 48 | |
| 1976 | 2290 | 1578 | 272 | 217 | 170 | 53 | |
| 1977 | 2681 | 1820 | 288 | 298 | 183 | 80 | 12 |
| 1978 | 2750 | 1936 | 300 | 288 | 148 | 68 | 10 |
| 1979 | 2636 | 1870 | 240 | 248 | 109 | 69 | |
| 1980 | 2754 | 1891 | 328 | 351 | 112 | 72 | |
| 1981 | 3067 | 2102 | 405 | 380 | 106 | 74 | |
| 1982 | 3690 | 2392 | 482 | 503 | 211 | 102 | |
| 1983 | 4334 | 2746 | 558 | 654 | 257 | 119 | |
| 1984 | 4482 | 2827 | 575 | 718 | 197 | 165 | |
| 1985 | 4940 | 2992 | 660 | 784 | 316 | 188 | |
| 1986 | 5390 | 3092 | 766 | 846 | 438 | 248 | |
| 1987 | 5636 | 3063 | 828 | 838 | 623 | 284 | |
| 1988 | 6265 | 3252 | 896 | 932 | 883 | 302 | |
| 1989 | 6757 | 3360 | 966 | 1022 | 1103 | 306 | |
| 1990 | 7553 | 3520 | 1131 | 1076 | 1502 | 324 | |
| 1991 | 8265 | 3764 | 1229 | 1097 | 1816 | 359 | |
| 1992 | 9075 | 4214 | 1402 | 1168 | 1939 | 352 | |
| 1993 | 9851 | 4618 | 1690 | 1216 | 1973 | 354 | |
| 1994 | 9952 | 4724 | 1759 | 1186 | 1931 | 352 | |
| 1995 | 9854 | 4634 | 1758 | 1135 | 2002 | 325 | |
| 1996 | 9736 | 4633 | 1620 | 1170 | 1942 | 371 | |
| 1997 | 10119 | 4803 | 1690 | 1161 | 2079 | 386 | |
| 1998 | 10218 | 4648 | 1872 | 1154 | 2119 | 425 | |
| 1999 | 11158 | 5141 | 1939 | 1237 | 2421 | 420 | |
| 2000 | 10712 | 4991 | 1893 | 1087 | 2328 | 413 | |
| 2001 | 10095 | 4782 | 1815 | 985 | 2165 | 348 | |
| 2002 | 9610 | 4622 | 1722 | 914 | 2018 | 334 | |
| 2003 | 9223 | 4499 | 1599 | 790 | 1975 | 360 | |
| 2004 | 9060 | 4493 | 1544 | 722 | 1942 | 359 | |
| 2005 | 8979 | 4388 | 1447 | 727 | 2014 | 403 | |
| 2006 | 9405 | 4533 | 1432 | 760 | 2174 | 506 | |
| 2007 | 9778 | 4610 | 1365 | 744 | 2441 | 618 | |
| 2008 | 10132 | 4704 | 1328 | 791 | 2610 | 699 | |
| 2009 | 10342 | 4773 | 1343 | 834 | 2686 | 706 | |
| 2010 | 10259 | 4772 | 1348 | 845 | 2571 | 723 | |
| 2011 | 10222 | 4876 | 1355 | 872 | 2341 | 778 | |
| 2012 | 10491 | 5102 | 1372 | 915 | 2283 | 819 | |
| 2013 | 10148 | 5191 | 1372 | 922 | 1831 | 832 | |
| 2014 | 9808 | 5174 | 1342 | 893 | 1564 | 835 | |
| 2015 | 9670 | 5197 | 1352 | 865 | 1432 | 824 |