
This post reviews our statewide housing production target. The state’s Executive Office of Housing and Livable Communities has set a statewide housing production target of 200,000 housing units in the current decade (2020 through 2030). This target is based on a demand-side computation of housing need, as opposed to a supply-side computation of the ability of the housing industry to produce housing. This post concludes that the target is reasonable from a demand-side perspective, but is a stretch goal from a supply-side perspective. The outline of the post is as follows:
- Review of components of need
- Production Potential
- Resources
- Appendix: Inventory of indicators of housing need
Review of components of need
The components of need within the housing target are summarized in the table immediately below and discussed individually in the sections further below.
Components of housing production target — 2020 through 2030
| Component of need | Estimated units needed |
|---|---|
| Achieve healthy vacancy rates | 53,500 units |
| Accommodate projected growth in household count | 116,000 units |
| Meet latent demand (households living within other households) | 30,000 units |
| Round number total | 200,000 units |
Vacancy Rates and Displacement
Massachusetts housing vacancy rates — for both homeowners and renters — are low relative to national averages and have declined over time as population growth has outpaced housing production. Low vacancy rates and resulting high prices contribute to displacement.
Trends in Massachusetts and US vacancy rates
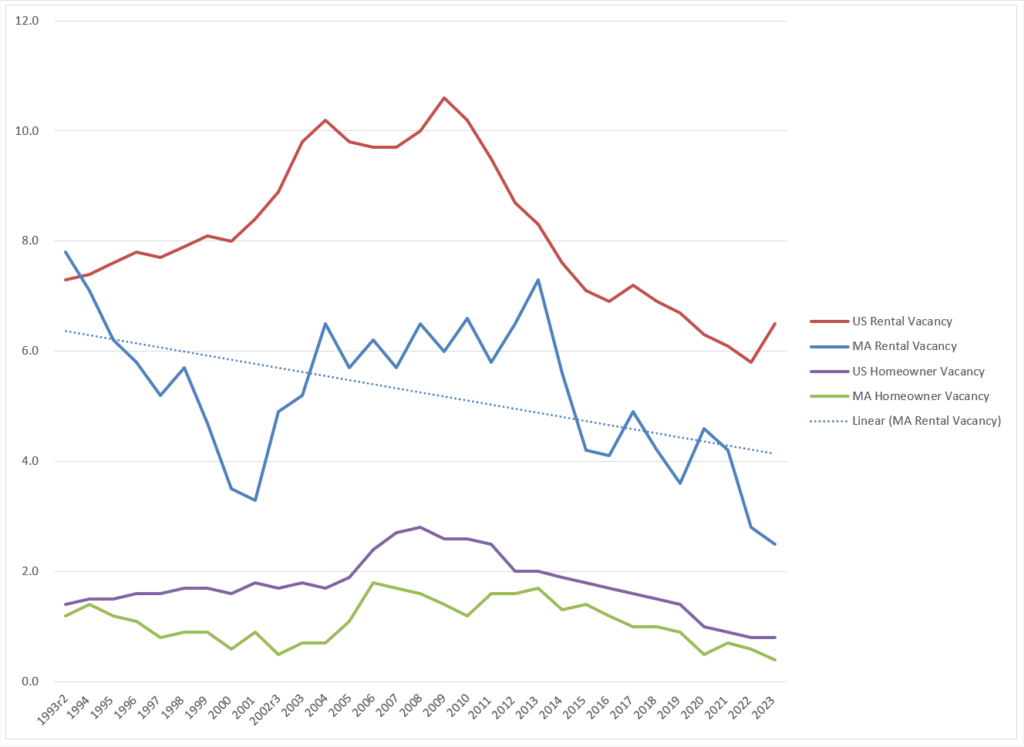
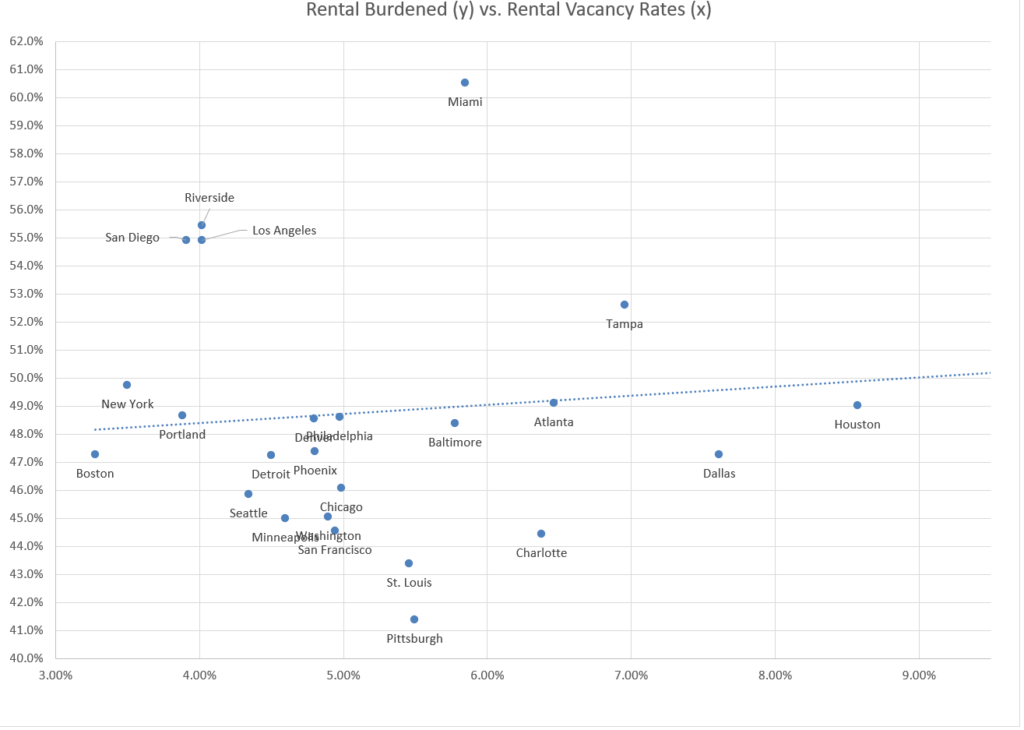
Worcester and Boston rank 75th and 73d lowest respectively as to rental vacancy rates among the 75 largest metropolitan areas in the United States. Boston has the lowest renter vacancy rate among the 25 largest metropolitan areas. It is surprising that metro Boston’s very low vacancy rate does not correlate with an unusually high rate of renter households having a high rent burden (over 30% of income) — see the chart below: Boston is near the median among large metro areas as to the rent-burdened share of renter households.
Vacancy Rates vs. Share of Renter Households with Rent Burden over 30% (25 largest Metro areas in 2022)
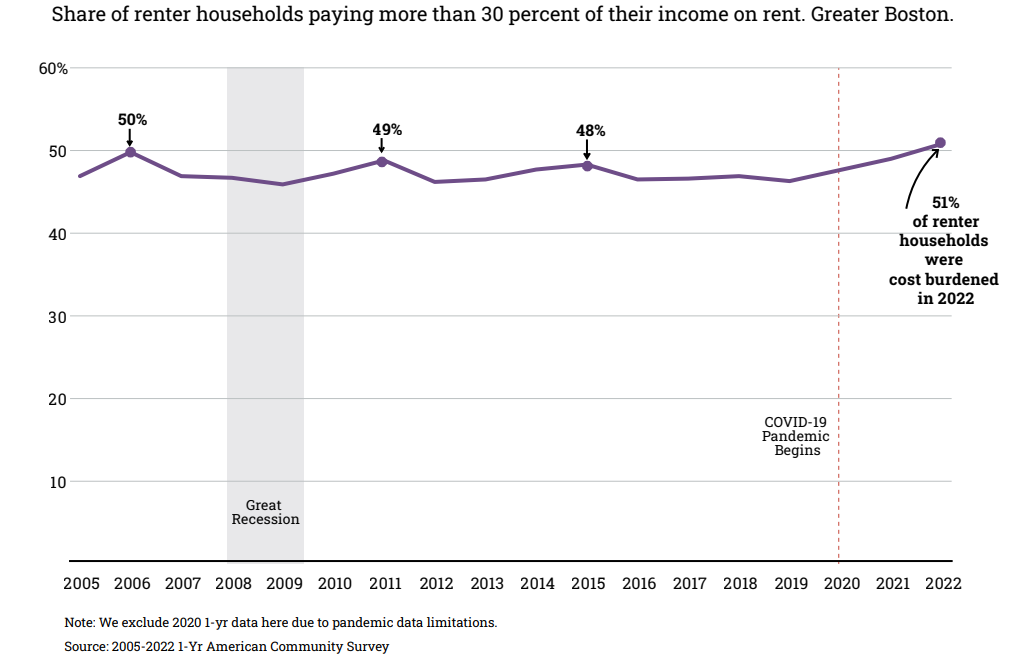
Similarly, while Boston’s rental vacancy rate has continued to decline over time, the share of households that are rent-burdened has remained roughly flat over the long-term (although it has ticked up recently), according to analysis prepared in the Boston Foundation’s Greater Boston Housing Report Card 2023.
Boston Foundation trend chart for rent burden in among greater Boston renterse
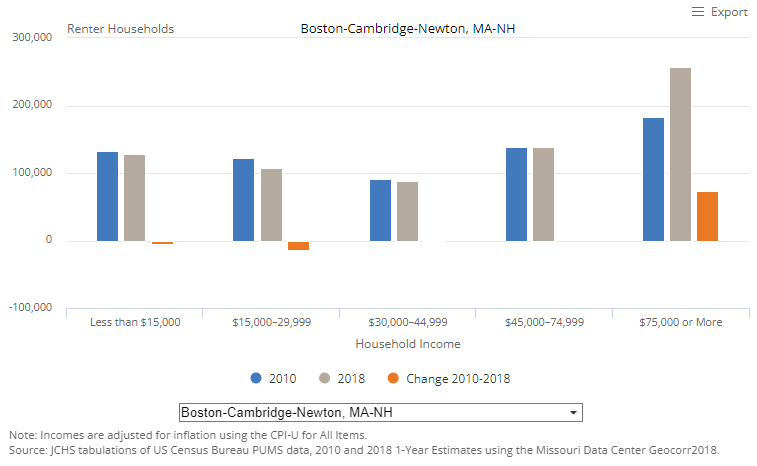
The lack of a rise in rent burden with declining vacancy rates has to be explained by the reality of displacement — lower income households are leaving to more affordable locations (within and outside the metro area) and higher income households are crowding them out of the most desirable neighborhoods. We know this anecdotally from many, many stories of low and middle income families moving further and further from the urban core. And it easy to observe gentrification in many metro Boston neighborhoods. Data compiled by Harvard’s Joint Center for Housing Studies document displacement in metro Boston: The JCHS data, which are inflation adjusted, show increases in high income renter households and decreases in lower income renter households from 2010 to 2018 within greater Boston. These data highlight that the hardship of the housing shortage falls most primarily on people of limited income who are forced to make the hard choice to relocate.
Shift from low-income to high-income renters (inflation-adjusted), Metro Boston 2010-2018
A hidden dynamic contributing to housing pressure is the increase in units owned for occasional use. Second homes do not appear within either the denominator or the numerator of published vacancy rates — they are off the market and people who own multiple homes are counted as occupying only their primary residence. See American Community Survey methodology. In Suffolk County, for example, the number of homes held for “seasonal, recreational, or occasional use” jumped from an estimated 1,135 in 2010 to an estimated 4,649 in 2022 (American Community Survey 1-year data). Suffolk County (Boston, Winthrop, Chelsea, Revere) is not generally seen as a vacation destination; these statistics are consistent with anecdotal reports of corporate temporary housing and the banking of high value units by wealthy individuals.
Units for held for Seasonal, Recreational, or Occasional Use in Suffolk County, 2010 vs. 2022
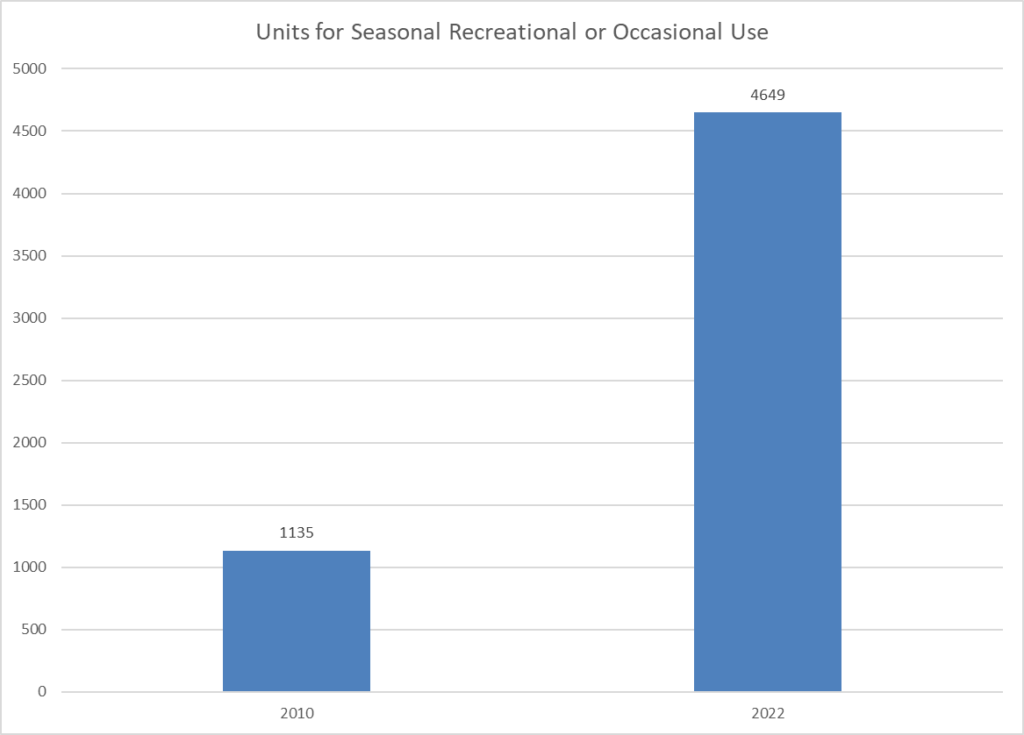
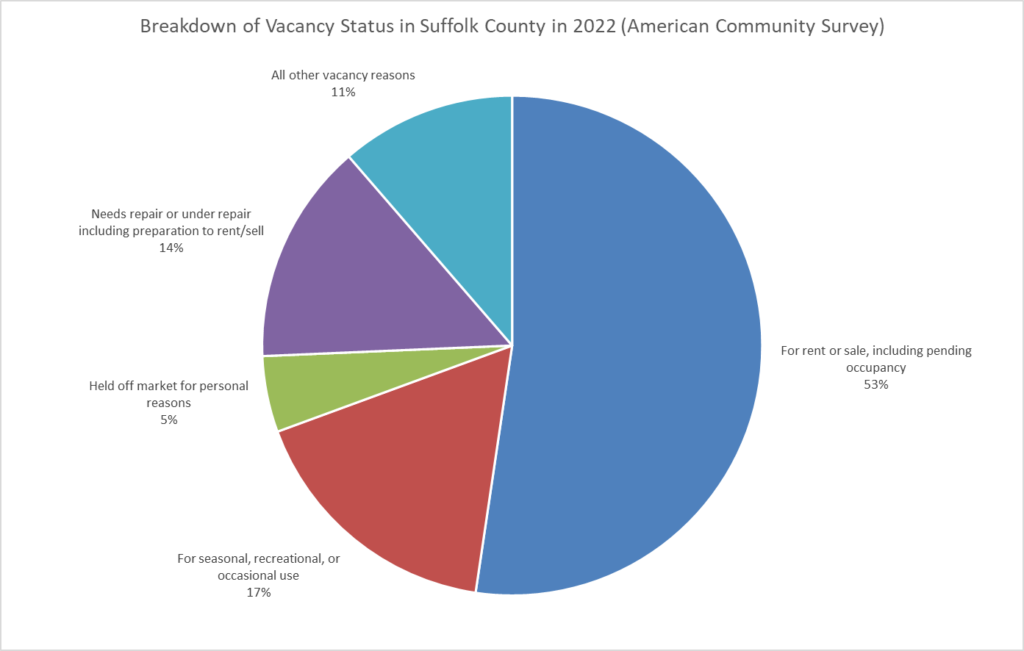
These units held off the market for occasional use comprised 17% of the vacant units in 2022.
Breakdown of Vacant Units in Suffolk County in 2022 (N=27,250)
Senior Housing Costs
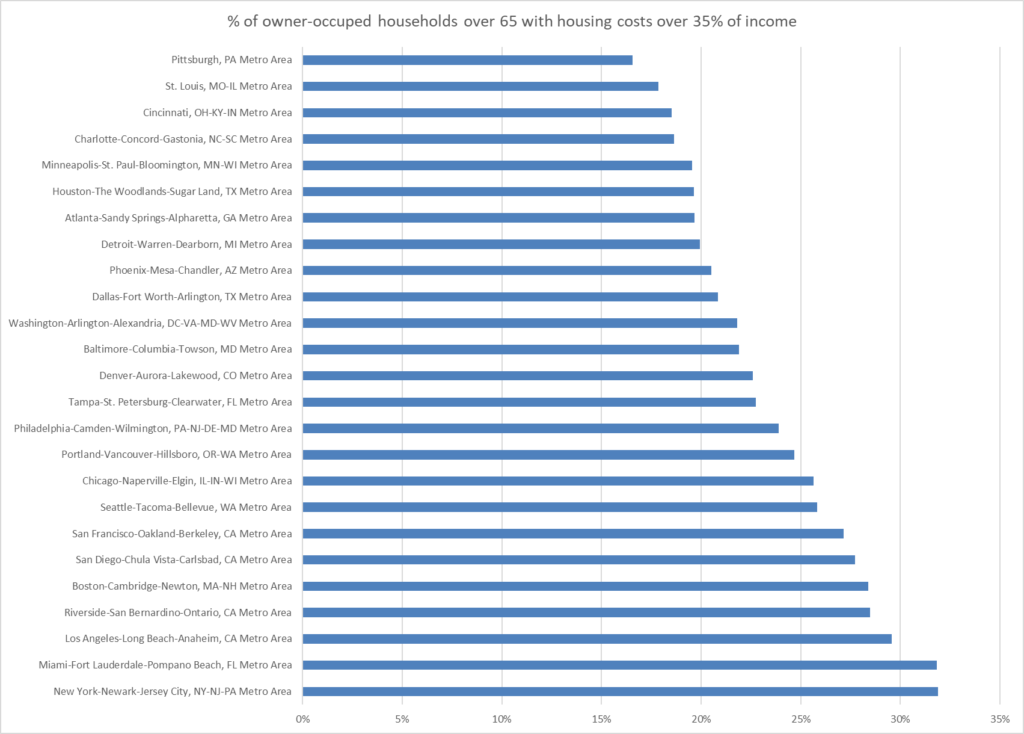
Although it is not so much a consequence of housing need as of our state’s heavy reliance on property taxes, senior homeowner costs run higher in the metro Boston area than in other metro areas. The metro Boston area has the 5th highest share of housing burdened seniors among the 25 largest metro areas. Single family tax bills vary widely by community in the area, with bedroom communities (lacking a commercial base) facing the highest residential bills. Housing undersupply rates mean that many seniors have no lower cost options within their community.
Vacancy Rate Target
What constitutes a “healthy” vacancy rate is a complex judgment call. Higher rates give flexibility and bargaining power to consumers, but at very high levels, vacancy can reflect neighborhood decay. For the purposes of the state housing target, the HLC summary states:
Housing experts have suggested that a “healthy” vacancy rate is +/- 2% for for-sale units and +/- 6% for rental. MAPC used a blended rate of 4%-5% to estimate the number of additional available units needed to achieve healthy vacancy.
Housing and Livable Communities (quoted as of August 21, 2024)
McKinsey uses a similar range in the Future of Work analysis:
Additional housing needed to maintain national average to best in class benchmark occupancy rate: 6-9 percent rental vacancy rates, 1.5-2.0 percent home-owner vacancy rates.
Future of Work, footnote 88.
Given a vacancy rate target, the computation of the vacancy component of the overall housing rate target is just math, but since vacancy rates fluctuate, the results are sensitive to choice of base year for analysis. The attached spreadsheet includes verification of the ballpark target of 50,000 to 60,000 units to raise vacancy rates to “healthy” levels based on 2022 data.
Population Growth
Projections of future housing unit need depend on both population growth and household structure. Our only real guide for these variables is the past. The state’s projections of population assume the extension of existing trends on the following variables:
- Population growth
- Birth rate
- Death rate
- International net migration
- Domestic net migration (migration to and from other states)
- Household structure
- People living alone
- Family sizes
Of course, trends — especially immigration trends — do change over time in ways we cannot anticipate. See this methodological discussion from the MAPC. The MAPC growth projections relied upon by Housing and Livable Communities are professionally developed and are also relied upon by MassDOT for transportation planning. The discussion of growth projections by Housing and Livable Communities includes appropriate caveats.
The chart below shows MAPC’s latest (vintage 2023) projections. The continuing decline in projected growth of household count is especially striking since household sizes are also expected to get smaller. MAPC projects the overall population living in households (as opposed to group quarters) to grow only 2.5% from 2020 to 2030.
MAPC Household Count Projections through 2050
| 2010 | 2020 | 2030 | 2040 | 2050 | |
|---|---|---|---|---|---|
| MAPC | 1,327,156 | 1,440,070 | 1,488,453 | 1,494,501 | 1,465,950 |
| Other Planning Areas | 1,240,899 | 1,344,555 | 1,412,570 | 1,469,952 | 1,512,781 |
| State Total | 2,568,055 | 2,784,625 | 2,901,023 | 2,964,453 | 2,978,731 |
| Total Percent Change over decade | 8.4% | 4.2% | 2.2% | 0.5% | |
| Total Absolute Change over decade | 216,570 | 116,398 | 63,430 | 14,278 |
Latent Demand
The “latent demand” component of the housing target is both the smallest and the hardest to quantify. Latent demand refers to people living with other people who would move out to their own home if other housing units were available and affordable. The 30,000-unit estimate for this category has to be seen as a very soft guess since so many factors will interact to determine this behavior. However, this behavior does need to be considered because people who make the choice to move out and create a new household will take up units that could be used to improve vacancy rates or absorb population growth.
Demand side summary
Based on the review above, it appears that Housing and Livable Communities has chosen a reasonable housing production target, at least from a demand perspective. Stepping back, it is worth noting that household growth depends in a complex and uncertain way on our actual ability to build housing — if we succeed in building more housing, we may reduce out-migration and drive up net growth. More net growth would help our labor force shortages.
Production Potential
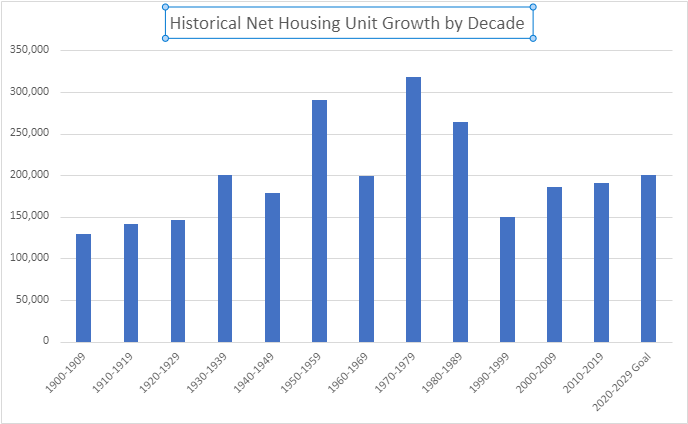
The Housing and Livable Communities’ target setting discussion does not include an assessment of production capacity. Actual production capacity depends on many variables, including the costs of capital and construction. The target of 200,000 units for a decade is not historically unprecedented — we produced over 300,000 units in the 70s. However, the current target may be seen as a stretch goal, given that it exceeds the production in each of the last three decades.
Net increase in MA housing units by decade, 1900 through 2029-goal
Raising concern as to the achievability of the target, units permitted have ticked downward recently, well below the 20,000 per year level which would meet the 200,000 target for the decade.
Units Permitted Annually in Massachusetts by Year, 1980 to 2023
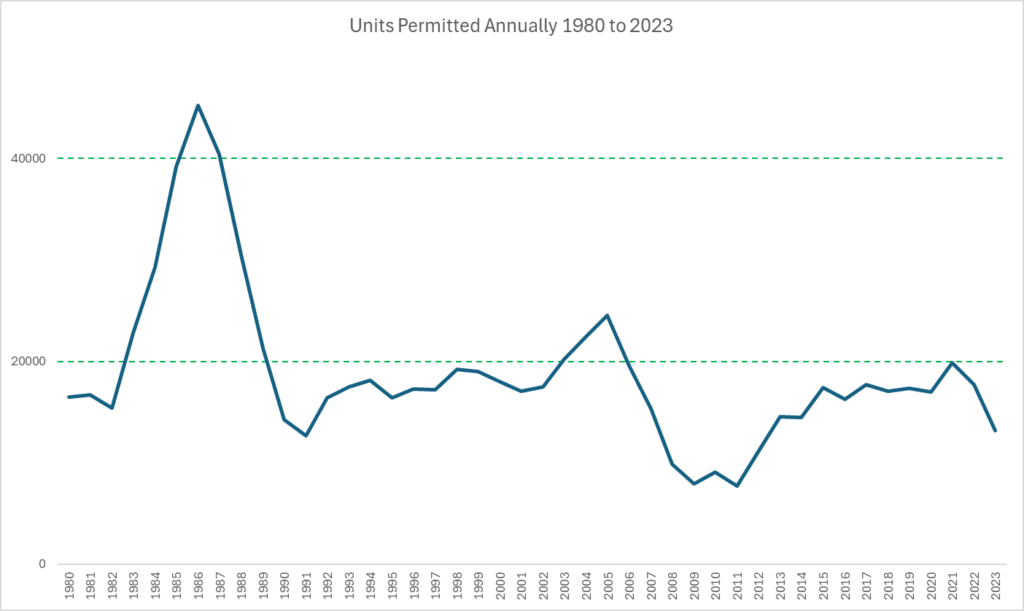
The most important takeaway from the permitting data above is the recent drop in permitting, which likely reflects both high interest rates and high construction costs. Our ability to hit our housing targets will depend heavily on national and global factors beyond our control: The chart below reminds of the volatility in housing starts and the dependence of housing starts on interest rates.
Federal Funds Rate vs. Housing Starts
While national economic factors are beyond our control, we do have control over land use regulation which limits development. It remains to be seen whether reducing regulatory barriers to housing production will suffice to overcome national economic factors and the intrinsic local challenges of site assembly.
Resources
- Bureau of the Census: This spreadsheet compiles census data used in the demand analyis in this post and includes source links. This previous post compiles historical housing quantity data.
- Metropolitan Area Planning Council
- Harvard Joint Center for Housing Studies
- Executive Office of Housing and Livable Communities
- Massachusetts Housing Partnership
- Mass Taxpayers Foundation, Heeding the warning signs, what Massachusetts must do to remain competitive
- Commonwealth Beacon — discussion of Boston housing goals
- Citizens’ Housing and Planning Association
Return to housing outline
Appendix: Inventory of indicators of housing need
| Quantity | Finding | Source |
|---|---|---|
| Outmigration | Net domestic outmigration from greater Boston accelerating at all income and education levels. | 1 |
| Rental Vacancy | Low compared to other metro areas and falling | 1 |
| Homeowner Vacancy | Low compared to other metro areas and falling | 1 |
| Sales prices | Rising state wide over time | 1 |
| Rents | Rising in metro Boston, Boston high among other metro areas | 1 |
| Rents | Highest in core communities and street car suburbs; lower in regional urban centers | 1 |
| Rents | Rent growth softening nationwide in 2024, but rent burdens high nationwide | 2 |
| Rent Burden | % of households in metro Boston spending over 30% on rent up slightly recently, but mostly flat near 50% since 2005 | 1 |
| Rent Burden | Rent burdened share up at all income levels, but not overall in metro Boston [suggesting income bracket creep in analysis] | 1 |
| Rent Burden | Rent burden statistic can be driven by either or both of high rents and low income — Springfield higher burdened rate than Boston, although rents lower | 2, 3 |
| Ownership Burden | 25% of homeowners spending over 30% of income in metro Boston | 1 |
| ELI unit availability | Number of extremely low income households twice the number of units affordable to them | 3 |
| Home prices | Ratio of single family home prices to income — rising steadily since 1980 nationwide and in metro Boston — recent up tick in ratio | 2 |
| For sale inventory | Down in relation to sales in metro Boston and in most markets nationwide (2010 to 2017) | 2 |
| Emergency shelter usage | Up recently (2023) | 1 |
| Overcrowding | Share of renter-occupied units with more than one occupant per room rising over time in metro Boston | 1 |
- The Boston Foundation, Greater Boston Housing Report Card 2023
- Harvard Joint Center for Housing Studies, America’s Rental Housing 2024, and additional JCHS tables
- Boston Federal Reserve, New England Public Policy Center, The Growing Shortage of Affordable Housing for the Extremely Low Income in Massachusetts
(1). Stop giving away American taxpayers’ hard-earned dollars to fund other countries’ super-expensive wars. (2). Use those tax dollars instead to fund construction of new housing here in the USA. 3. Legalize residency/citizenship for undocumented workers hired by construction companies to build that housing. (Good luck finding enough native-born job applicants to fill such a huge need! Native-born citizens won’t even apply for current ongoing job openings in the agricultural sector. Which is why 50% of agricultural workers are undocumented. And don’t criticize them with your mouth full of the produce that they harvest for you.) Increased supply of such housing will bring down the costs of renting/owning. Problem solved. And there’ll probably still be enough money clawed-back-from-foreign-countries wars to pay for free everything at lots of community colleges. Thus enabling native-born folks to qualify for more desirable work than installing roofs in the cities or picking fruit in farmland. A big win-win for everyone. The money is there, my fellow peasants. As much as we’ll ever need, and then some. But the lords of the manor are spending it on giveaways to foreign countries who wage endless wars in our name. So line up over here to pick up your torches and pitchforks.