
Energy Consumption Impact of Current vs. Prior Plans
The current (2022-2024) Mass Save three year plan differs substantially from prior plans in several major respects, including:
- A new strategic emphasis on electrification of heating, especially the replacement of oil and propane heat with heat pumps. Mass Save Three Year Plan at p. 11; DPU Order on Mass Save plans at page 51 and 102.
- Dramatic reduction of incentives for energy efficient lighting. The potential for lighting efficiency improvements is much less than in previous years because so many buildings are already using high efficiency bulbs. Mass Save Three Year Plan at p. 59 and 63-64; DPU Order on Mass Save plans at page 123.
- Substantial elimination of incentives for combined heat and power (CHP — natural gas units that produce heat and also electric power). This is consistent with the Secretary of Environmental Affairs directive setting Mass Save’s goals. Newly installed CHP units represent new long term commitments to natural gas, inconsistent with our climate plans. See also DPU Order on Mass Save plans at page 133 and following.
Charts 1 through 3 below highlight the consequences of these changes, comparing the expected energy consumption changes in the current and prior Mass Save plans. In the charts, energy savings show as negative. Since the Mass Save plans are actually compilations of individual plans for each of the gas and electric investor-owned utilities in the state, the comparisons are broken out by utility or type of utility (electric vs. gas).
Chart 1 compares the prior and current Mass Save plans for electric utilities. The de-emphasis of lighting and the elimination of CHP reduce electric savings; increased heat pump conversions also reduce electric savings (because they add electric use). The increased heat pump conversions also appear in the increased oil and propane savings. The elimination of CHP contributes to less increase in gas use.
Chart 1: Comparison of current and prior ELECTRIC utilities statewide plans — energy consumption impacts (MMBTU)
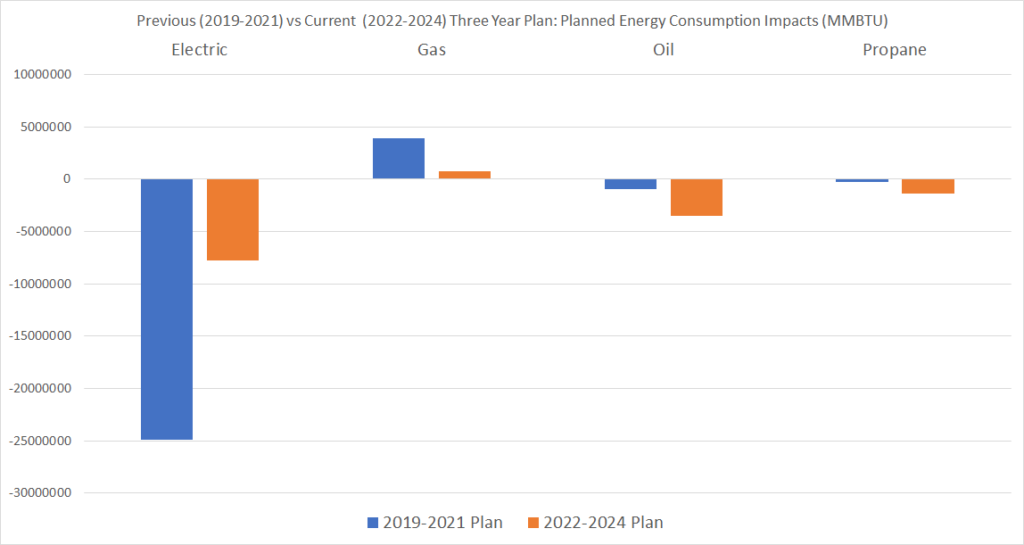
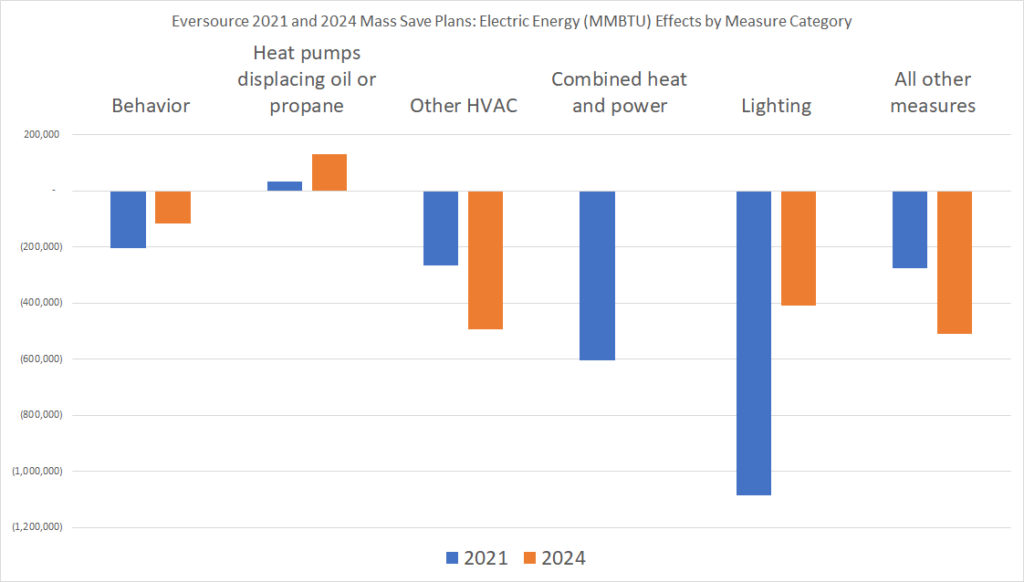
Chart 2 breaks out the electric energy impacts by categories of measures within Eversource Electric’s Mass Save Plans for years 2021 (3d year in the prior plan) and 2024 (3d year in the current plan). It confirms in more detail the shifts in program emphasis.
Chart 2: ELECTRIC energy consumption impacts (MMBTU) by particular measure type for Eversource Electric 2021 and 2024
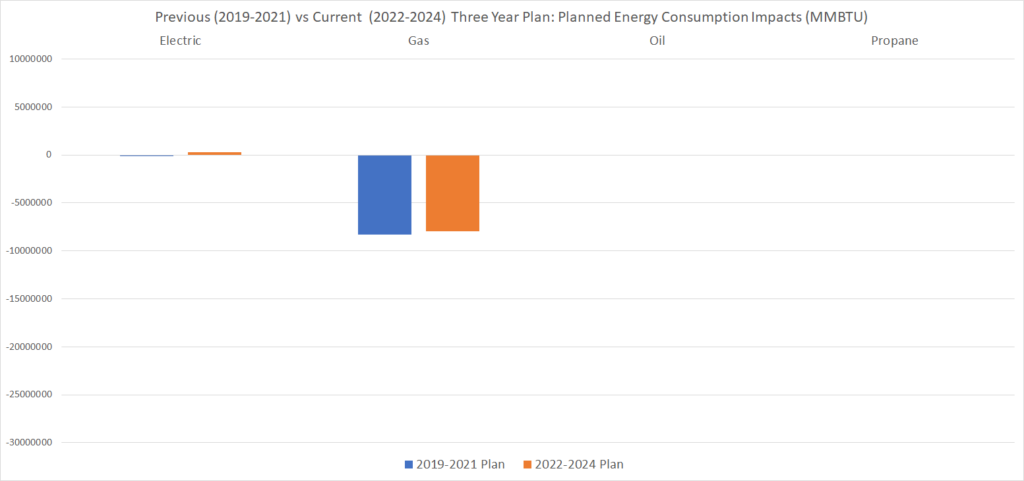
As shown in Chart 3, the shift in emphasis is much less dramatic in the gas utilities plan — as noted in our pages on economics and potential, only a small volume of electrification of gas heat is projected in the next few years, so the Mass Save plan does not change as much for gas utilities as it does for electric utilities.
Chart 3: Comparison of current and prior GAS utilities statewide plans — energy consumption impacts
Current vs. Prior Plans Greenhouse Gas Impact
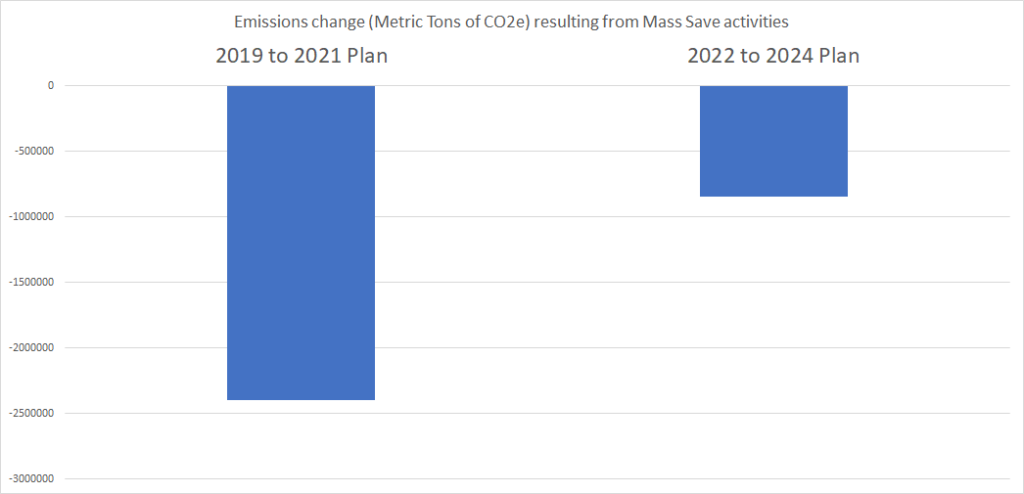
As shown in Chart 4, the previous Mass Save plan contemplated much larger emissions reductions than the current Mass Save plan (2,398,076 vs. 845,916 metric tons of CO2e). This reflects the real shift in plan activities documented above (less lighting and no CHP), but is also partly due to accounting differences.
Chart 4: Current vs Prior Mass Save Plan Emissions Impact (reduction shown as negative).
As Chart 1 at the top of the post shows, in the 2019-2021 planning cycle, the electric utilities were able to claim substantial annual electric efficiency benefits — 24.9 MMBTU in reduced electric power consumption (which equates to 3.4 million megawatt-hours of reduced consumption). As shown in Chart 2, much of this was due to CHP and lighting efficiency, including short-term light bulb efficiencies. These reductions in electric energy use accounted for roughly two-thirds of the overall emissions reductions in the 2019-2021 planning cycle.
Table 1: Approximate Emissions Reductions due to Annual Electric Energy Use Reductions
| Annual Megawatt Consumption Impact | Factor for MTCO2e Emissions per Megawatt Hour | Computed Emission Impact (MTCO2e) | |
|---|---|---|---|
| 2019-2021 Plan (partly actual, as reflected in history tab of 2022-24 plan) | -3,410,571 | .448 (at marginal gas plant emissions rate) | -1,528,445 |
| 2022-2024 Plan | -1,140,105 | .1065 (at 2030 projected overall average emissions rate) | -151,421 |
The third column in Table 1 highlights the use of two different methodologies for computing green house gas emissions associated with electric power generation.
- In the 2019 to 2021 cycle, the emissions factor for electricity (Metric Tons of CO2 equivalent per megawatt hour) was computed as if the electric power were being generated by the last power plant that would turn on to meet increased demand (also the first to avoid activation if emissions are lowered) — usually a natural gas plant.
- In the 2022 to 2024 cycle, the emissions factor for electricity (Metric Tons of CO2 equivalent per megawatt hour) was computed based on the overall average mix of generation sources; additionally, the computation was limited to measures that have service lives that extend into GHG reduction target years: 2025 and 2030. The emissions factors were specified by the Secretary of Environmental Affairs directive setting Mass Save’s goals. The directive specifies lower factors in 2025 and 2030 because it assumes a progressively greener power grid with declining emissions per kilowatt-hour. Equally important is the use of average emissions (which include zero-emission sources like wind, hydro and nuclear) instead of marginal gas plant emissions.
Between the smaller energy use reductions and the accounting policy changes, the emissions reductions due to electrical energy savings are 10 fold less in the current plan than in the prior plan, as shown in the final column in Table 1, roughly explaining the difference in overall emissions reductions shown in Chart 4.
Building Sector Emissions in the Mass Save Plans
There is also a fundamental accounting difference between our greenhouse gas inventory system and all Mass Save Plans: Mass Save appropriately looks at the energy consumption savings and resulting emissions reductions for electric energy and all fuels. However, our statewide greenhouse gas emissions inventory has always attributed the emissions to produce the electricity consumed in buildings to the Electricity Sector, not to the Building Sector. See, Building Sector Technical Report, note 1 on page 9. So, when our current Clean Energy and Climate Plan measures “Building Sector” emissions and sets targets for reducing them, the Electric Sector emissions changes don’t count.
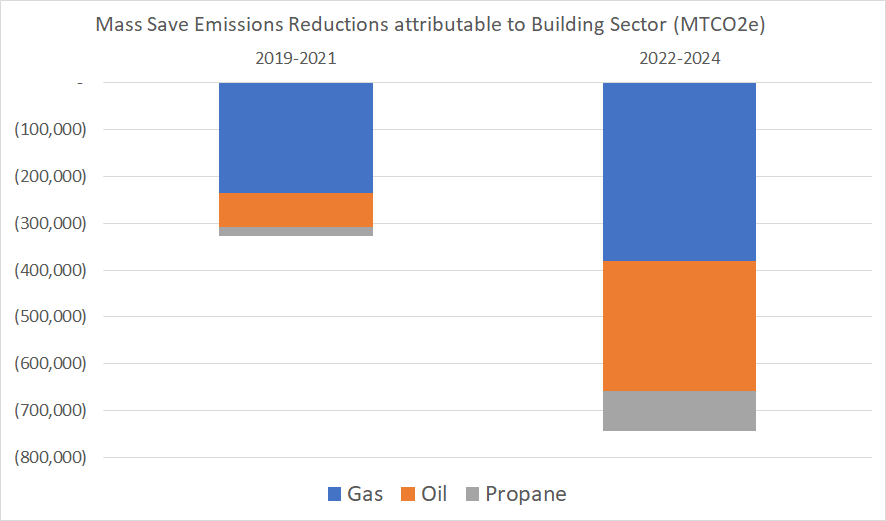
The chart below shows the major components of annual emissions reductions attributable to the Building Sector put in place by the most recent two Mass Save plans — emissions reduction resulting from reductions in on-premises burning of natural gas, oil, and propane for heating (as well as hot water, cooking, etc.).
Chart 5: Mass Save Annual Emissions Reductions Attributable to Building Sector
This table combines statewide history and planned MMBTU reduction data from 2022-2024 Statewide Data Tables – Electric and 2022-2024 Statewide Data Tables – Gas. It applies emissions factors (MMTCO2e/MMBTU for each fuel) from the Secretary of Environmental Affairs directive setting Mass Save’s goals.
Our current Clean Energy and Climate Plan calls for reductions in greenhouse gas emissions from the building sector of 2.6 million MTCO2e from 2020 to 2025. Without attempting to parse exact rates in particular years, combining the two stacked bars in Chart 5 above makes clear that Mass Save is unlikely to account for more than 1 million out of the 2.6 million MTCO2e in emissions reductions sought from the Building Sector between 2020 and 2025. There is no other statewide process happening at scale which will achieve the balance of the planned reductions. The CECP contemplates an additional reduction of 4.1 million MTCO2e of building sector emissions by 2030, suggesting the need for a great acceleration.
A note on numbers
The Mass Save planning process is exhaustively and transparently documented between the Energy Efficiency Advisory Council and the Department of Public Utilities Docket “File Room” (Dockets 21-120 through 21-129 for the current Mass Save plan). Most important numbers appear in multiple tables in multiple documents and there are inconsistencies among them, some due to deliberate updates, perhaps some due to errors. I’ve done the best I can to give an accurate big picture. I’ve noted all chart and table sources above and I attach here the less-than-completely-presentable spreadsheet I used to manipulate the numbers.
Will Brownsberger, November 2022
I find all this information useless. Maybe I’m just easily over whelmed.
Here is what I would like to see;
year on year electrical usage with a corresponding generation of that electric usage to how it’s produced be it NG, Oil, Coal, Wind or Solar. I can make sense of that with a comparable Mass Save chart of past and future impacts broken out by consumption options like heat pumps, lighting etc.
In the end we need to see how the government, through Mass Save can help make changes fiscally practical or not.
Just trying to really understand what’s happening in the program. The annual spending is over a billion and I wanted to peek under the reported aggregate numbers. But I’ll follow up with you off line.
You’ve highlighted the changes that have to with accounting methods. I can see how this would be important to understanding the complicated numbers that go into the program. But I’d like to know specifically what they are eliminating. For example, we just had them insulate our house: appreciated the difference it made in the heat retention. Would want that program to continue, as well as the access to thermostats. However, on the first assessment, we were given power strip outlets that were really unnecessary. Glad to hear they have cut out EE lightbulbs which are readily available.
I also wonder who audits the Mass Save contractors. We’ve worked with two over the years and the management of the projects left a lot to be desired (the actual installation was fine).