
This post collects Massachusetts-specific observations about annual operating costs of heat pumps as compared to heating systems that they might displace.
Projections of how the increased electric bills from running a heat pump will compare to the savings from displacing another heating source are always speculative. They depend not only on the hard-to-predict efficiency of the heat pump as installed, but on the varying relationships among different energy prices. How these relationships will change over the 15-to-20-year life of a heat pump investment is unknown.
We can make the following generalizations based on recent price levels:
- For conversions from gas, modest annual savings are possible in communities with low electric rates, but annual costs will likely go up in communities with high electric rates.
- For conversions from oil, annual savings are likely in communities with low electric rates and possible in other communities.
- Conversions from electric resistance almost always reduce operating costs.
Overall, except in the case of conversions from electric rates, uncertainties are large enough that consumers should use caution in assuming long-term savings to support a heat pump investment. If attempting to project savings, consumers should always make sure that they use their own known electric rates in considering conversion projects — electric rates vary substantially even from community to community in Massachusetts.
A few caveats:
- The focus here is on annual operating costs, not on upfront costs or the total return of a conversion project. The upfront initial cost of conversions also vary widely.
- Weatherization investments often have high returns whether one is heating with oil, with gas, or with a heat pump. While weatherization should be part of many heat pump projects, it should not be part of the cost comparison for different sources of heat. Weatherization is not part of the analysis on this page.
- For homes that already have central air conditioning installed, heat pumps may offer efficiency improvements and electric cost savings in the summer. For homes that do not have central air already, installation of heat pumps may offer summer comfort improvements but likely additional electric costs. Those considerations are properly part of the heat pump decision but the analysis will vary for different homes. This page focuses on heating.
As originally published in November 2022, this post included additional material on emissions. That material has been deleted from this post. It is superseded by better and more current data presented elsewhere in the heat pump outline on this site. Additionally, two other posts that added insights on heat pump operating have been consolidated into this post (as of May 2023).
Mass Save Projections for current three year plan
Homes heated with gas
Even before the recent electric rate increases, the Mass Save Program Administrators reached a clear conclusion about heating cost increases with natural gas conversions to heat pumps:
In almost all cases, a customer switching from natural gas to a heat pump as their primary source of space heating would realize an increase in the cost to heat their home or business, in addition to the incurred capital cost for the system’s installation.
MassSave 2022-2024, full plan document at page 13.
The following table, extracted from data submitted by National Grid to the Department of Public Utilities as part of the litigation around its 2022-4 plan, shows that most of the standard permutations for natural gas to heat pump conversions were expected to cause annual cost increases on top of installation costs.
| Type of Gas to Heat Pump Conversion | Typical Annual Cost Savings/(Increase) |
|---|---|
| Central Ducted Heat Pump Partially Displacing Existing Furnace, Gas | $ (405) |
| Central Ducted Heat Pump Fully Displacing Existing Furnace, Gas | $ (1,229) |
| DMSHP* with Integrated Controls Partially Displacing Existing Boiler, Gas | $ (358) |
| DMSHP* with Integrated Controls Fully Displacing Existing Boiler, Gas | $ (867) |
| Air-to-Water Heat Pump displacing Existing Boiler, Gas | $ (457) |
| Closed Loop GSHP** Replacing Furnace, Gas | $ (208) |
| Open Loop GSHP Replacing Furnace, Gas | $ 28 |
Get raw numbers, computations and link to original submission here.
My wife and I recently converted fully from gas to heat pumps and our experience was consistent with these results.
Homes heated with oil
Even for people who heat with oil, the Mass Save planning data suggested that a heat pump conversion would often increase operating costs.
| Type of Oil to Heat Pump Conversion | Typical Annual Cost Savings/(Increase) |
|---|---|
| Central Heat Pump partially displacing Oil Heat | $ (13) |
| Central Heat Pump fully displacing Oil Heat | $ (644) |
| MSHP* partially displacing Oil Heat | $ (34) |
| MSHP* fully displacing Oil Heat | $ (384) |
| Air-to-Water Heat Pump displacing Oil Heat | $ 179 |
| Closed Loop GSHP** replacing Oil Heat | $ 480 |
| Open Loop GSHP** replacing Oil Heat | $ 716 |
The first four oil conversion options show cost increases. As to the others, the underlying data show that, except in the case of the Open Loop Ground Source heat pump, the modest savings are insufficient to provide a positive return when capital costs are included.
Homes heated with electric resistance heat
Heat pumps offer roughly 2/3 cost savings over electric resistance heat — that relationship does not depend on commodity pricing and reflects the intrinsic efficiency of using electricity to pump heat as opposed to using electricity to generate heat.
| Electric Resistance to Heat Pump Conversion | Typical Annual Cost Savings/(Increase) |
|---|---|
| Ductless Minisplit Heat Pump displacing Electric Heat | $ 901.67 |
Price sensitivity of relative savings/costs — DOER statewide data
Except when replacing electric resistance heat, a heat pump conversion involves fuel switching, so energy market conditions affect the economics. Since Massachusetts still uses gas and oil to produce much of its electricity, electric rates do fluctuate with commodity prices.
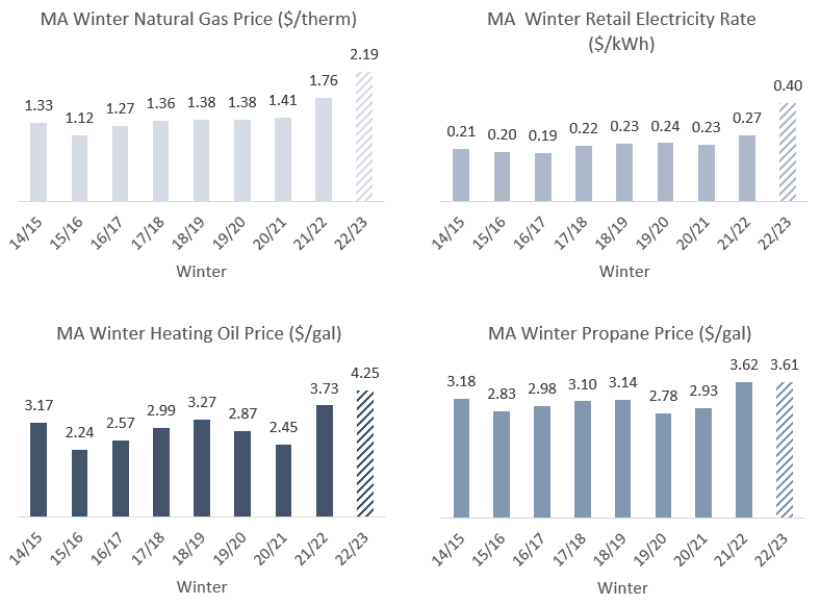
The following chart uses the DOER statewide data above to show the time variation of the costs of heating by gas, oil, electric heat pump or electric resistance:
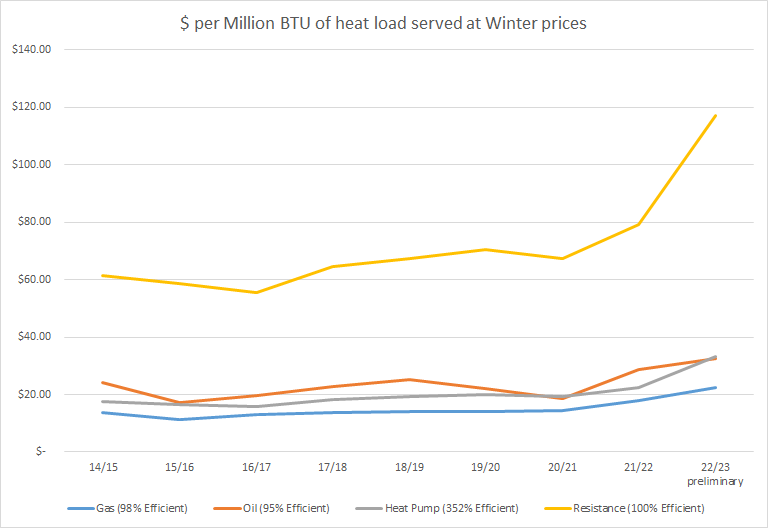
The $/Million BTU of heat load served reflects both prices and relative efficiency of heating technologies. Efficiency levels presented are for the very ‘best’ performing heating units in each category. Going to the ‘good’ level moves operating costs up for each technology, but does not change the basic ordering: In recent years, gas has been the cheapest option and electric resistance the most expensive. Oil and heat pumps are a bit above gas and trade positions as prices fluctuate. Heat pumps will mostly likely reduce costs when compared to an older inefficient oil burner.
For oil conversions, since the comparison is close, the efficiency assumptions matter more. The chart above uses the most positive possible assumption for heat pumps — 352% efficiency. Real world results are generally much lower than that — 200% to 250%. Using more typical efficiency results for all heating sources would put heat pump costs above oil heat costs in many heating seasons. The following table shows the relative advantage or disadvantage of heat pumps over oil heat over the past 9 winters, using energy pricing averages from DOER (downloaded on January 13, 2023). As the table indicates the relative prices fluctuate, and the options trade places.
Comparison of Heat Pump Operating Costs to Oil Heat Costs — Recent 9 Winters — for whole home heating systems
| Winter Ending in Year | Electric Average $/kwh | Oil Average $/gal | Heat Pump Annual $ Cost | Oil Heat Annual $ Cost | Heat pump cheaper by $ | Heat pump cheaper by % |
|---|---|---|---|---|---|---|
| 2015 | 0.21 | 3.17 | 1,767 | 1,948 | 181 | 9% |
| 2016 | 0.2 | 2.24 | 1,683 | 1,377 | -306 | -22% |
| 2017 | 0.19 | 2.57 | 1,598 | 1,579 | -19 | -1% |
| 2018 | 0.22 | 2.99 | 1,851 | 1,837 | -13 | -1% |
| 2019 | 0.23 | 3.27 | 1,935 | 2,009 | 75 | 4% |
| 2020 | 0.24 | 2.87 | 2,019 | 1,763 | -255 | -14% |
| 2021 | 0.23 | 2.45 | 1,935 | 1,505 | -429 | -29% |
| 2022 | 0.27 | 3.73 | 2,271 | 2,292 | 21 | 1% |
| 2023 | 0.4 | 5.52 | 3,365 | 3,392 | 27 | 1% |
| Sum | n/a | n/a | 18,424 | 17,704 | -719 | -4% |
| Average | 0.24 | 3.20 | 2,047 | 1,967 | -80 | -4% |
The performance assumptions in the above chart reflect my conclusions in a previous post:
- 250% efficiency for heat pumps (2.5 seasonal COP) is fairly optimistic as an average for results obtained for pumps newly installed in the field. Better results can definitely be obtained in some settings, but much worse results can also be obtained.
- 85% performance is reasonable for a newly installed oil burner. If the comparison were to an older burner one might want to use 75%. 80% could be a reasonable guess for the mix of old and new burners out there.
The chart below explores the implications of alternative relative efficiency assumptions.
Percentage cost advantage of heat pumps over oil heat on average over past 9 winters as a function of assumed efficiency.
| Heat Pump Efficiency | Oil Efficiency 80.0% | Oil Efficiency 82.0% | Oil Efficiency 85.0% |
| 300% — achievable in single zone ductless, one or two large rooms with market leading heat pumps | 18% | 16% | 13% |
| 250% — common field result based on publications and interviews | 2% | 0% | -4% |
| 200% — not an uncommon result in field installs, some even worse | -22% | -25% | -30% |
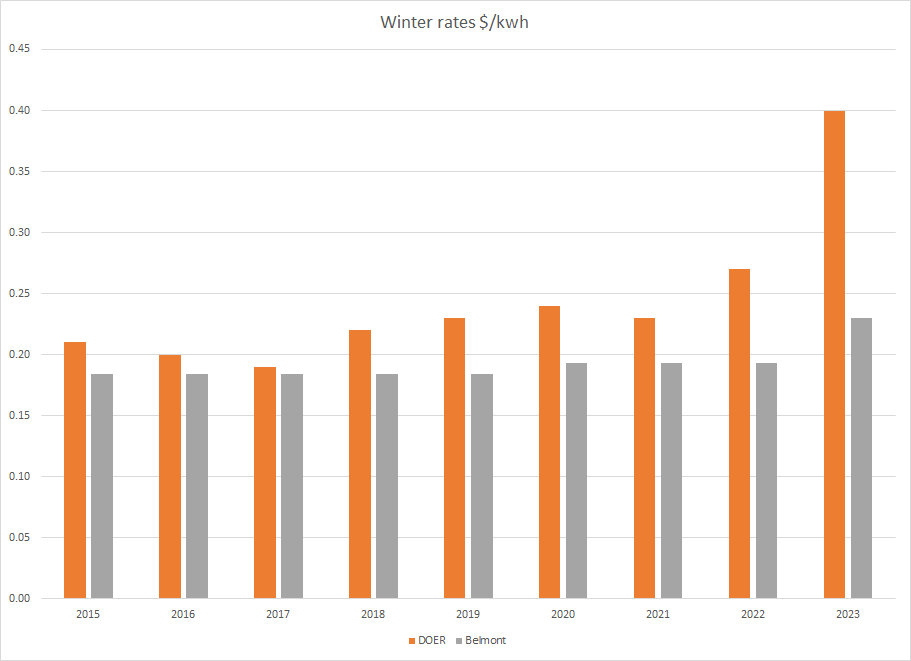
Lower electric rates in some communities
The cost estimates in the preceding two sections are based on statewide average electric rates published by the Massachusetts Department of Energy. Those rates are load-weighted averages for the major utilities and they reflect the rates for many consumers in the state. However, in communities with municipal light plants or municipal aggregation programs, electric rates are lower and heat pump adoption likely offers operating cost benefits. As an example, the chart below compares Belmont Light rates to the DOER statewide average rates over the past 9 winters.
Winter Electric Rates: Belmont Light vs. DOER Average
The difference in rates has a material effect on the economics of a oil to heat pump conversion. Using the same assumptions as in the previous 9 year table (250% heat pump efficiency, 85% oil heat efficiency), the chart below compares the annual operating cost savings for heat pumps versus oil heat.
Heat Pump Advantage over Oil: Computed using Statewide Electric Rates vs. using Belmont Electric Rates
| Winter Ending in Year | Heat Pump Advantage over Oil: Annual Savings ($) at DOER Average Electric Rates | Heat Pump Advantage over Oil: Annual Savings ($) at Belmont Light Electric Rates |
|---|---|---|
| 2015 | 181 | 396 |
| 2016 | -306 | -176 |
| 2017 | -19 | 27 |
| 2018 | -13 | 285 |
| 2019 | 75 | 457 |
| 2020 | -255 | 139 |
| 2021 | -429 | -119 |
| 2022 | 21 | 667 |
| 2023 | 27 | 1,458 |
| Sum over nine years | -719 | 3,134 |
| Average over nine years | -80 | 348 |
NOT adjusting for load variations due to weather. Belmont light rates and computations appear in the spreadsheet linked to at the bottom of the post.
The unusual market conditions in the 2022-2023 winter — which favor long term power contract holders — explain roughly half of the apparent difference between the heat pump advantage at the municipal utility rates as opposed to at statewide rates. Yet, the advantage is material even omitting 2022 and 2023.
Community choice electric programs — formally known as “municipal aggregation” programs — are another way for customers within a municipality to participate in bulk purchasing of power. Consumers participating in these programs pay a municipally determined charge for supply of power, but continue to pay the investor-owned utility for delivery of power. Arlington, Cambridge, Watertown, and Boston all offer these programs — purchasing power in bulk and reselling it to their residents with Eversource as the delivery and billing agent. These programs are currently attractive as compared to relying on Eversource for both supply and delivery as the chart below shows.
January 2023 Community Choice Electric Rates (excluding delivery charge)
| Community choice rate | Winter 2023 generation/supply charge (cents/kwh) | Year of program launch |
|---|---|---|
| Arlington Basic | 16.090 | 2017 |
| Boston Optional Basic | 10.900 | 2020 |
| Cambridge Standard Green | 10.200 | 2017 |
| Watertown Basic | 12.723 | 2019 |
| Memo: Belmont Light Basic | 11.000 | 1898 |
| Comparison: Eversource Basic | 25.776 | 2015 rebranding |
People in these communities pay additional delivery charges to Eversource or National Grid. Those charges may run a several cents higher than municipal light charges, in part due to the statewide assessment for Mass Save. It certainly appears that these programs will help make electrification projects more attractive, but consumers in each community need to make their own judgment calls about what rates to assume if they wish to project savings.
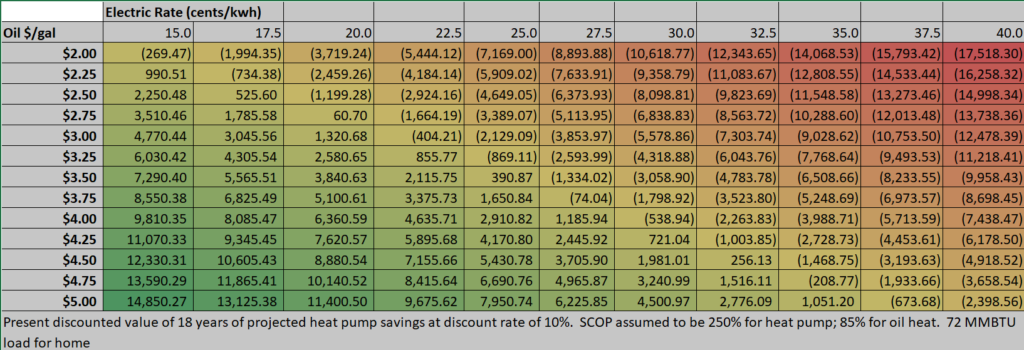
Benefit-Cost Ratio Computations
One way to think about the value of an uncertain future savings stream is to compute a “present discounted value.” The chart below computes a standard “present discounted value” with a discount rate of 10%. The 10% discount rate reflects both the cost of capital and the likely high variability of the future savings stream, which is dependent on the fluctuating relationship between rates. (The 10% rate is not entirely arbitrary, but the judgment behind it is weak. Interested readers can experiment with alternative discount rates using the spreadsheet linked to at the end of the post.)
The chart shows how the present value of expected savings depends on energy prices. In the darker green, lower left corner of the chart, one finds the best case present value operating savings for a heat pump conversion, reflecting a low municipal electric rate of 15 cents/kwh (Braintree is near this level) and very high oil costs (costs spiked over $5/gal earlier this winter). In that scenario, the savings stream, if held constant for the life of the pump (not realistic) could offset $14,850.27 of upfront costs. In the far right column on the chart one sees that heat pumps generate operating losses at any likely oil price when electric rates are at 40 cents/kwh (approximately the state IOU average this winter). All of these computations exclude up front capital costs.
Present value of heat pump savings over oil heat under alternative rate scenarios — rates held constant over 18 year heat pump life.
Over an estimated 18-year life of the heat pump, it’s hard to know how relative rates will change. Assuming middling conditions (the central area of the chart) may be wisest since the savings will average out over price fluctuations. Even if available operating cost savings are not great enough to tip a raw benefit-cost analysis in favor of heat pumps, they can help make a carbon-motivated decision easier.
Additional Sources
Computations and additional links appear in this spreadsheet.
Thanks for the thoughtful discussion! I understood going into the decision to convert from gas to heat pumps that we might not see a reduction in our heating costs. We were willing to accept a modest potential increase our home heating cost in pursuit of a better outcome for the environment – and hopefully the environmental benefits will increase over time as electric generation comes to rely more on non-emitting sources. (We also had an old gas boiler – probably nowhere near 90-95% efficient). Beyond the heating season, we expect the heat pump to operate more efficiently for air conditioning than the central air system it replaced. I understand that heat pumps are not a panacea – there’s still much work to be done to achieve our GHG reduction goals.
Will, Thank you very much for this series of postings on electrifying buildings, especially the info you provided about heat pumps.
Our “new” (c. 1950) home has a new (2021), presumably efficient oil burner. We just got a MassSave audit, which recommended weatherization updates and conversion from steam oil heat to MSHP. Despite the rebates and tax incentives (greater in ’23 than in ’22) the data you have reported makes it clear that we will pay a fair amount to reduce our 1200 sq ft house’s carbon footprint both in capital and operating costs. (Depending of course on relative increases in oil and electricity prices, which are not at all predictable.)
As we just sunk our savings into our first home, we are house-poor, and not able to shoulder conversion costs, despite the attractive rebates and credits available, especially given we’ll likely pay more for energy were we to do that. I had assumed conversion would at some point save money, but your analysis refuted that. So I think we’ll do some basic weatherization (new windows are out of the question), keep the thermostat low in winter, and use window A/C sparingly in the summer — and pray that fuel oil prices won’t go through the roof.
There must be many Mass homeowners in a similar situation. The energy equations you describe don’t seem auspicious for any of us. What strategy do you recommend for homeowners in our situation?