
This page highlights the quantitative significance of reducing emissions from existing single-family and small multi-family homes.
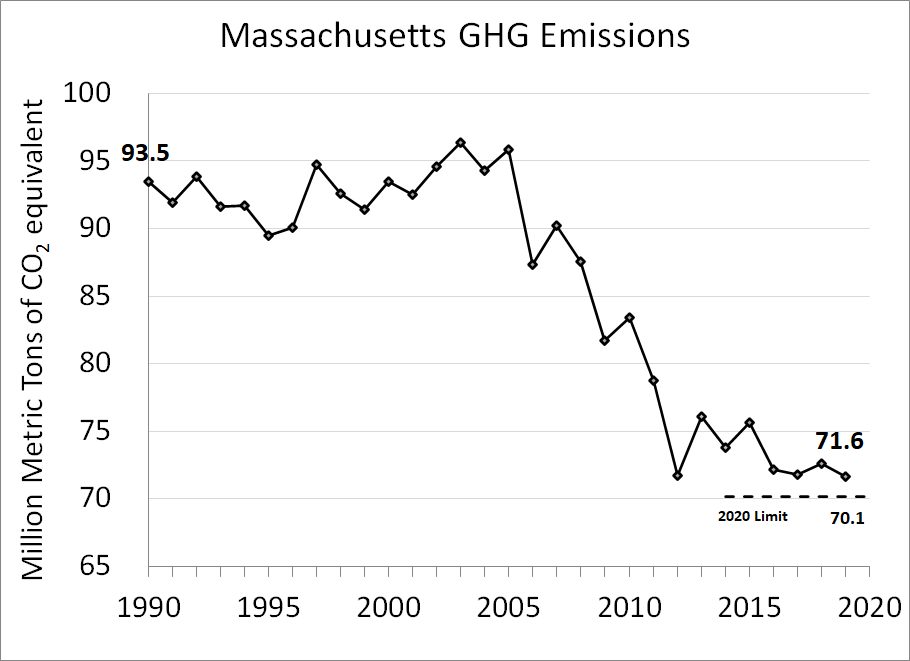
Combined emissions from all sectors have declined roughly 25% since 1990.
Total Greenhouse Gas Emissions in Massachusetts declined from 93.5 MMTCO2e (Million Metric Tons of Carbon Dioxide Equivalent) in 1990 to a little over 70 MMTCO2e in 2019. 2020 Emissions, not shown in this graph, were lower — only 64 MMTCO2e — but this aberrant emissions lull reflected the pandemic. It remains to be seen what 2021 emissions will show after the rebound.
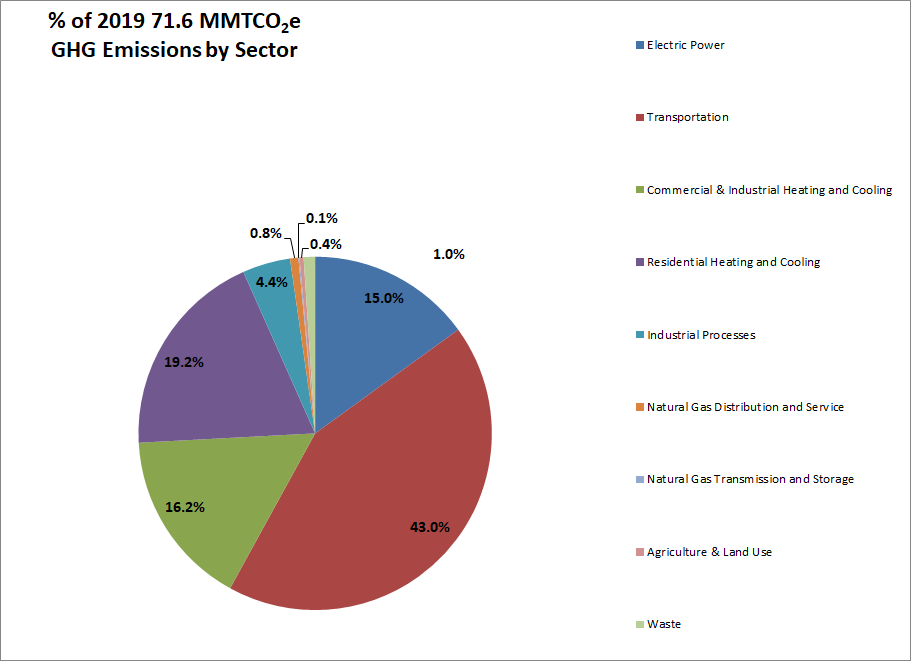
Residential buildings currently account for roughly 1/5 of emissions.
Residential buildings contributed 19.2% of Massachusetts Greenhouse Gas Emissions in 2019. By convention, the indirect building emissions from fossil fuels used to generate electricity for building heat or cooling are attributed to the Electric Power sector, so the 19.2% number reflects mostly fossil burning within buildings for space heat or water heating. According to the process tab in the inventory 13.6 of the total 13.7 Million Metric Tons of Carbon Dioxide Equivalent from the residential sector is CO2 from burning fuel.
with correction for mispointed cell AS38
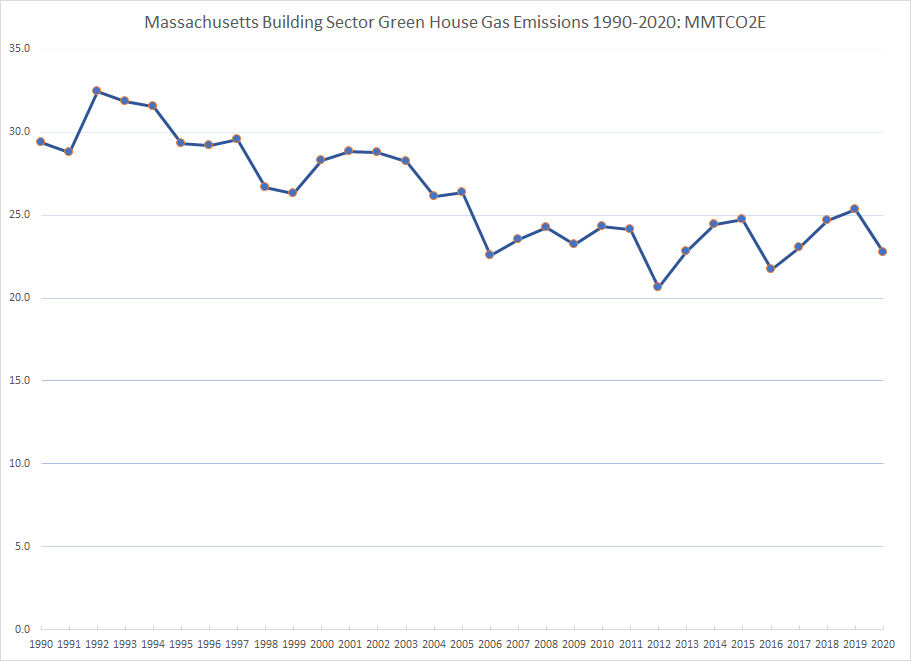
Building Sector green house gas emissions have been roughly level over the last decade.
Emissions from the building sector declined in the 1990s, but have remained roughly level since 2008 when we started fighting to reduce emissions — passing the Green Communities Act and the Global Warming Solutions Act. Emissions from the building sector fluctuate according to hot and cold weather.
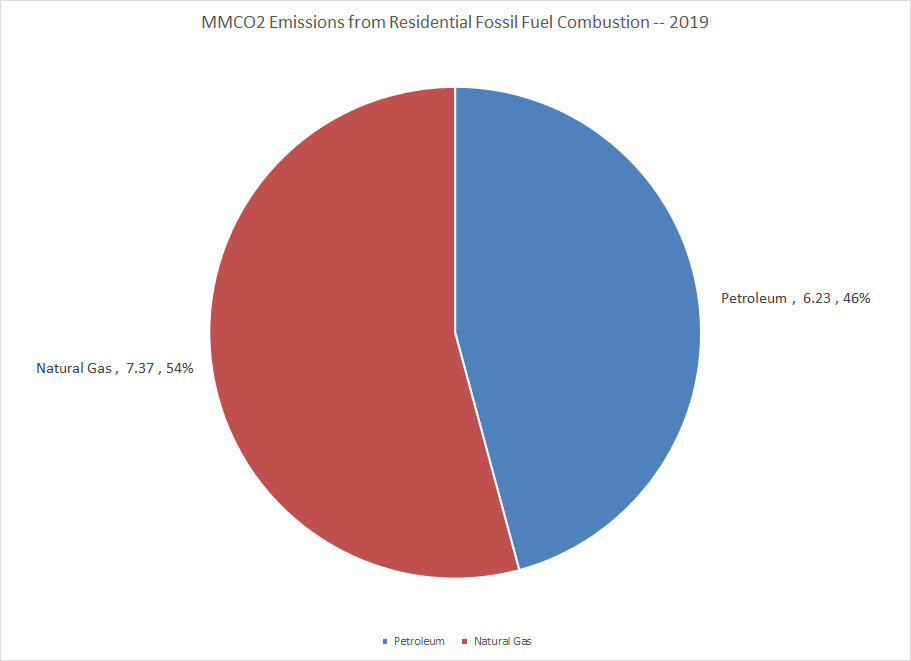
Natural gas dominates other heating types in the residential sector.
Natural gas accounts for the majority of the CO2 from fossil fuel combustion in the residential sector.
Data from the 2021 American Community Survey give us a more detailed window into primary residential heating fuels, showing all types.
Occupied Housing Units in Massachusetts by Rent/Own and by Primary Heating Fuel (2021)
| Heating Fuel | Owner Occupied | % of Owner Occupied | Renter Occupied | % of Renter Occupied | Total Occupied | % of Total Occupied | Rent % of Total Occupied |
|---|---|---|---|---|---|---|---|
| Total: | 1,742,436 | 100% | 1,016,582 | 100% | 2,759,018 | 100% | 37% |
| Utility gas | 904,966 | 52% | 506,929 | 50% | 1,411,895 | 51% | 36% |
| Fuel oil* | 549,933 | 32% | 99,103 | 10% | 649,036 | 24% | 15% |
| Electricity | 146,895 | 8% | 345,441 | 34% | 492,336 | 18% | 70% |
| Propane** | 88,379 | 5% | 41,220 | 4% | 129,599 | 5% | 32% |
| Wood | 29,339 | 2% | 1,312 | 0% | 30,651 | 1% | 4% |
| Other fuel | 14,287 | 1% | 7,168 | 1% | 21,455 | 1% | 33% |
| Solar energy | 5,069 | 0% | 738 | 0% | 5,807 | 0% | 13% |
| Coal or coke | 1,262 | 0% | 58 | 0% | 1,320 | 0% | 4% |
| No fuel used | 2,306 | 0% | 14,613 | 1% | 16,919 | 1% | 86% |
https://api.census.gov/data/2021/acs/acs1?get=NAME,group(B25040)&for=state:25&key=Your_API_Key_Here
https://api.census.gov/data/2021/acs/acs1?get=NAME,group(BG117)&for=state:25&key=Your_API_Key_Here
*Also Including Kerosene, etc. ** Bottled, tank or LP gas
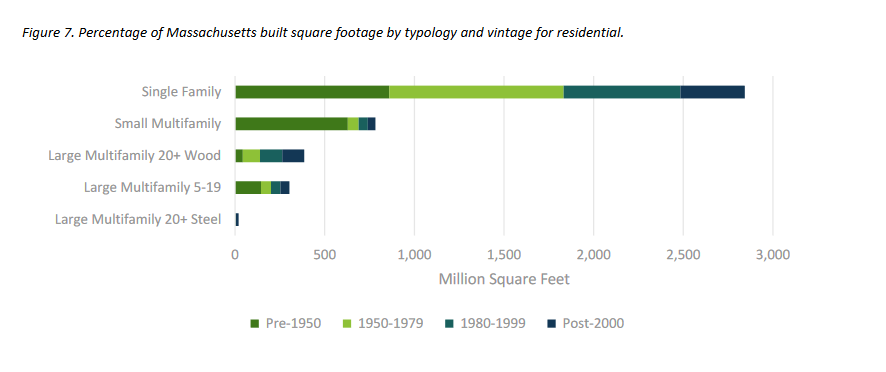
Single and small multi-family homes comprise most of the residential building square footage.
Single family homes comprise almost half of the building stock in Massachusetts.
As of 2016, there were over 5.9 billion square feet of residential and commercial buildings in the Commonwealth . . . . Residential buildings dominate the building stock, representing 74% or 4.3 billion square feet. Single family residences alone represent 49% of the Commonwealth’s building stock, or 2.8 billion square feet.
2050 Pathways Study, Building Sector Technical Report (“BSTR”), page 26
The following chart shows how significant the single family and small multifamily components of the housing stock are when weighted by square footage. Much of that stock is older and therefore especially likely to need heavy insulation work as well as heat pump conversion.
Already existing buildings will comprise most of the building stock in 2050.
The retrofit of existing buildings is a critical part of our 2050 strategy, because new buildings are likely to comprise only 19% — or on the high side 24% — of the building stock in 2050. See BSTR, page 38.
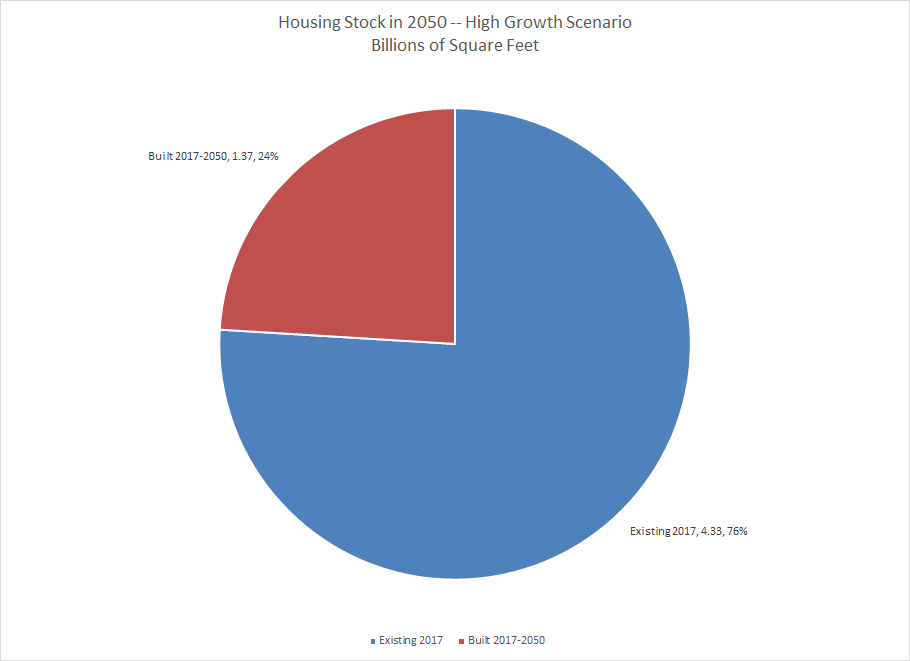
Residential construction is expected to comprise 69% of the new growth. BSTR, page 30. Single family and small multi-family is expected continue to dominate growth within the residential sector, despite the growth of large multifamily buildings. BSTR, page 28.
Will Brownsberger, November 2022
I like this kind of analysis, though it’s challenging to fully digest.
When comparing single family to multifamily contributions I would like to see an estimate of per capita housed land use and per capita housed CO2 emissions for each kind of dwelling type. It’s very good to see that the heavy energy users in single family homes can dramatically reduce their emissions via heat pumps, electric cars, and solar panels. I commend those doing that. However, I’d like the numbers to be visible to policy makers and citizenry about how wasteful it is to live in a single family house suburb vs., say, the brick buildings along the southwest corridor or in the denser parts of Brighton and Allston.
In the past, when I tried to become more politically active, I found it depressing how local politics are dominated by homeowners who object to any building larger than two or three stories, as if that’s somehow oppression against them (“I don’t want to live in NYC!”). Some of these activists I think are living in million dollar houses. Meanwhile my friend struggles to find a one bedroom apartment that meets her and her husband’s (admittedly somewhat high) standards for less than $3000 / mth in rent.
I think that many of these activists care about the climate issue and possibly some about the habitat/biodiversity issue. If they saw the contrast of land use and emissions per person between dense neighborhoods and sprawled ones, maybe they’d moderate a little bit.
The executive summary of the Building Sector Technical Report that you link to says most of those 19% of buildings coming from new construction will be small buildings (“primarily driven by small residential buildings”), which I’m supposing means yet more suburban sprawl and yet greater transportation challenges from yet more people who can’t conveniently walk, bike, scooter, or take public transit to their frequent destinations. While the 81% number speaks to where heat pumps should go, I feel we should not ignore the new construction. We should try to shape it a bit to correct the past construction mistakes, all that beating back of larger multifamily housing. Doing that doesn’t solve the emissions problem all by itself but 19% is not exactly negligible either. There should be some gains to be made by encouraging denser neighborhoods and ignoring, to a greater degree, the incumbent homeowner interests who usually dominate public input about development decisions.