
Overview
Mass Save is the only Massachusetts entity spending at large scale to accelerate heat pump conversions and energy efficiency generally. State funding for these purposes flows on a smaller scale through the Department of Energy Resources and the MassCEC, essentially for prototyping, research, planning, and oversight.
Mass Save is a collaborative of utilities that offers energy saving incentives and offers education for businesses and consumers. It is regulated by the Department of Public Utilities and it is funded through assessments on rate payers that are approved by Department of Public Utilities. The utilities submit individual three year plans for approval to DPU. The plans include a spending level and a proposed “Energy Efficiency Surcharge” on rate payers to cover the spending.
Funding Sources for Mass Save
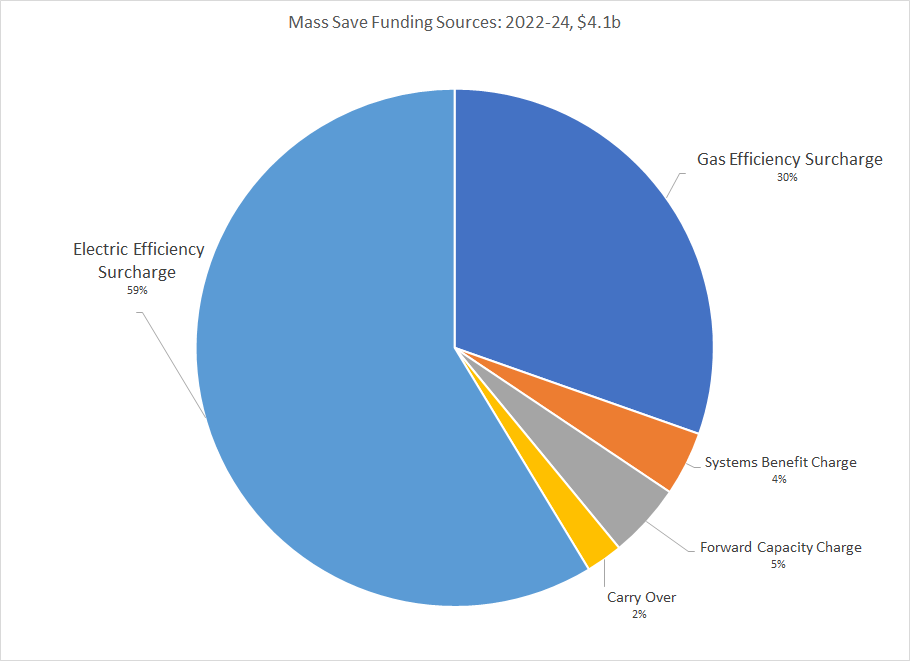
The chart below shows the statutory funding sources for the current Mass Save Three Year Plan.
Table 1: Funding Sources for Mass Save Three year Plan
| Funding Source | Description |
|---|---|
| Systems Benefit Charge | $0.0025 per kwh on electric rates (except municipal light companies). GL, Ch. 25, Section 19(a). |
| Forward Capacity Market Revenue | Amounts generated by electric utilities selling demand side measures into the regional electric market through ISO-NE pursuant to GL, Ch. 25, Section 19(a)(1). |
| Cap and Trade Revenues | Amounts generated in the regional auction of rights to emit carbon; no longer allocated to energy efficiency by the legislature. Listed here for historical completeness. GL, Ch. 25, Section 19(a)(2). |
| Other funding | Theoretically, utilities might find some other way to fund these programs, but they generally don’t. |
| Carryover Funding | Funds from prior years may carry over in to the next plan (as a positive or a negative). |
| Energy Efficiency Surcharge | An amount determined by the DPU to be added to electric and gas rates as needed to cover cost-effective efficiency programs. Embedded in the “Energy Efficiency Reconciliation Factor” for electric rates and in the “Local Delivery Adjustment Factor” for gas rates. GL, Ch. 25, Section 19(a)(3); also GL Ch.25 Section 21(b)(2)(vii). |
As the chart below shows, the gas and electric efficiency surcharges, approved by DPU, cover 89% of the costs of Mass Save. Effectively, the DPU is setting the energy efficiency budget which is then paid for by rate payers.
Figure 1: Funding Sources for Mass Save Three year Plan
In setting the Energy Efficiency Surcharge level and so the Mass Save budget, DPU is applying discretion, but only within specific statutory obligations, generally to approve cost-effective programs. See DPU Order on Three Year Plan Proposal, p. 215ff.
Heat Pump Funding within Mass Save
The three year plan is presented at the sector and program level and heat pumps are funded in multiple programs and sectors. However, in responses to inquiries from the DPU each utility produced measure level detail behind their plans. The following table extracts from those responses the count of heat pumps and value of incentives.
Table 2: Heat Pumps in Mass Save 2022-2024 Three Year Plan — Measure Level Detail from Responses to DPU Inquiries on October 2021 Plan Filing
| Fuel Being Replaced by heat pump | Heat Pump Count | Heat Pump Count | Heat Pump Count | Incentive Value | Incentive Value | Incentive Value |
|---|---|---|---|---|---|---|
| Full replacements | Partial replacements | All replacements | Full replacements | Partial replacements | All replacements | |
| Residential Electric | 11,056 | – | 11,056 | $67,389,272 | – | $67,389,272 |
| Residential Gas | 765 | 1,039 | 1,804 | $6,012,500 | $4,156,000 | $10,168,500 |
| Residential Oil | 6,545 | 27,877 | 34,423 | $142,065,780 | $130,381,965 | $272,447,745 |
| Residential Propane | 2,418 | 5,454 | 7,872 | $39,180,435 | $27,368,018 | $66,548,453 |
| Residential Other/Mixed | 15 | – | 15 | $375,000 | – | $375,000 |
| Residential Hot Water | 5,671 | – | 5,671 | $8,923,000 | – | $8,923,000 |
| Subtotal Residential Conversions | 26,470 | 34,370 | 60,840 | $263,493,487 | $161,905,983 | $425,399,470 |
| Commercial Electric | 201 | 0 | 201 | $3,306,450 | – | $3,306,450 |
| Commercial Gas | 108 | 560 | 668 | $8,400,000 | $1,760,432 | $10,160,432 |
| Commercial Oil | 45 | 1171 | 1,216 | $675,000 | $19,262,950 | $19,937,950 |
| Commercial Propane | 10 | 667 | 677 | $150,000 | $10,972,150 | $11,122,150 |
| Commercial Mixed | 1008 | 1,008 | $16,581,600 | $16,581,600 | ||
| Commercial HW | 0 | 0 | – | – | – | – |
| Subtotal Commercial Conversions | 1,372 | 2,398 | 3,770 | $29,113,050 | $31,995,532 | $61,108,582 |
| Total Residential and Commercial Conversions | 27,842 | 36,768 | 64,610 | $292,606,537 | $193,901,514 | $486,960,552 |
| “Custom” Commercial and Industrial Measures | Not tabulated here | Not tabulated here | Not tabulated here | Not tabulated here | Not tabulated here | $482,700,000 |
| GRAND TOTAL — IDENTIFIED ELECTRIFICATION MEASURES | $969,660,552 |
This compilation above ties perfectly to the residential gas detail in the plan term sheet. However, for the electric utilities, fossil conversions are lower and electric conversions are higher.
Table 3: Comparison of Analyzed Detail for heat pump conversions to Plan Term Sheet.
| Category | Conversion Count | Conversion Count | Difference in Counts |
|---|---|---|---|
| Electric Utility Funded — Residential | 2022-24 from detail | 2022-24 from term sheet | Plan detail less Term Sheet (low)/high |
| Full Fossil Replacements | 7,313 | 7,717 | (404) |
| Partial Fossil Replacements | 31,508 | 31,953 | (445) |
| Electric Replacements | 8,157 | 7,364 | 793 |
| Hot Water | 4,551 | 4,551 | – |
| Electric Utility Funded — Income Eligible | |||
| Full Fossil Replacements | 1,665 | 1,580 | 85 |
| Partial Fossil Replacements | 1,824 | 3,598 | (1,774) |
| Electric Replacements | 2,899 | 1,418 | 1,481 |
| Hot Water | 1,000 | 1,000 | – |
| Gas Utility Funded | |||
| Full Gas Replacements | 765 | 765 | – |
| Partial Gas Replacements | 1,039 | 1,039 | – |
| Hot Water | 120 | 120 | – |
Multiple Estimates of Total Costs of Heat Pumps in Mass Save Three Year Plan
The cost numbers for electrification in the 2022-2024 plans appear to have moved around a lot, but they are generally in the $800,000,000 to $1,000,000,000 ball park.
- The October 2021 plan term sheet refers to an undifferentiated investment in electrification of $800,000,000.
- Two spreadsheets filed in April 2022 show total statewide incentive spending of $874 million for electrification — 2022-2024 Statewide Data Tables – Electric show “Electrification” incentives totaling $748 million and 2022-2024 Statewide Data Tables – Gas show “Electrification” incentives $126 million.
- In the specific measures identified in Table 2 above, compiled from DPU filings in late 2021, the total incentive investment is $969.7 million. Half of that total investment comes from two Commercial and Industrial measures captioned “Custom – HVAC (Electrification)” and “Custom – Electrification Other.” It raises a flag that such a large share of the planned funds are allocated to two such vague measures.
Will Brownsberger, November 2022