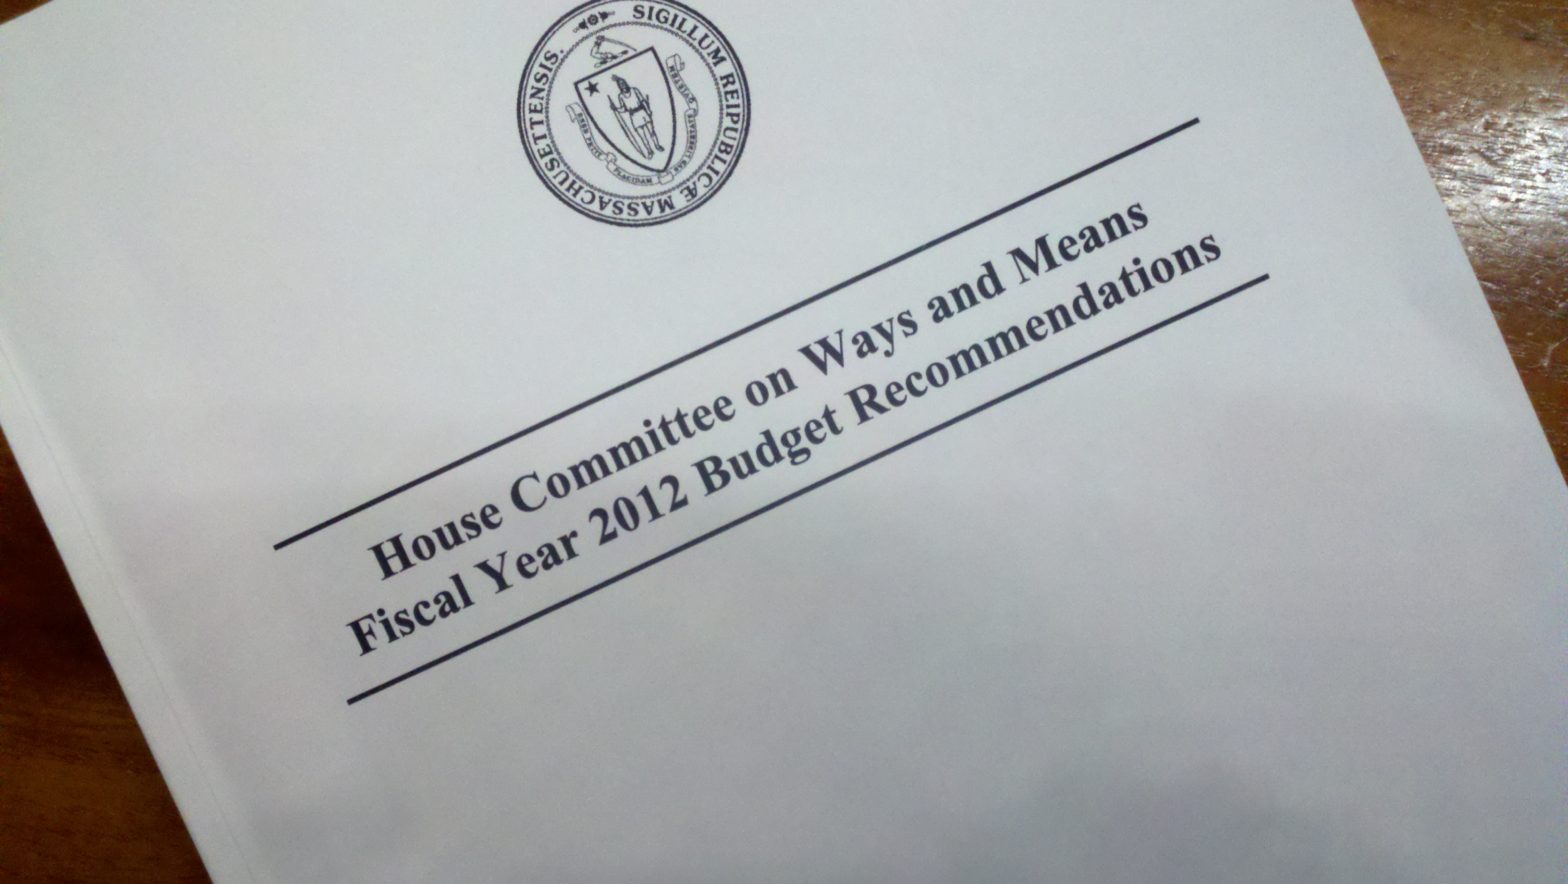
Here are some more observations about the FY12 budget. See also earlier posts on local aid, local employee health care and bar advocates in the FY12 budget.
- The total proposed spending in the FY12 budget — $30.45 billion — is slightly below the projected total spending for FY11, roughly $31 billion. The budget is, however, above the initial budget for FY11, $29.45 billion, which may be the best comparison point, since we are likely to add spending through the year in supplemental budgets.
- The budget mostly relies on cuts to close a $1.9 billion “gap” created by underlying inflation of costs and the loss of federal recovery funding. The budget also includes some “revenue initiatives” — some maximization of federal reimbursements and some subtle tax changes which, together with a stabilization fund draw, account about 1/3 of the gap closing.
- The budget is conservative with respect to its revenue assumptions — economic good news received over the past few months has not yet been directly factored in. At $20.5 billion, an increase of $741 million over FY11, tax revenues are still estimated slightly below their FY2008 levels; the assumptions have not been altered since the January consensus revenue decisions.
- The economic good news has been indirectly factored in by accepting the Governor’s aggressive assumptions about savings in the MassHealth program — he proposes to keep total health spending roughly flat. He may not be able to achieve the savings that he hopes to achieve, but if he doesn’t, we’ll probably have enough revenue to cover the excess.
- Health care spending is hard to account for completely because some of it flows through off budget fund transfers, but it appears that from FY08 to FY11, health care spending rose by over 30%. So holding it level in the coming year would be a huge accomplishment.
- The budget continues to do relatively well by core human services programs — for the developmentally disabled, the mentally ill, foster children, etc. These areas collectively have seen only a 4% cut since 2008.
- Other areas of the budget have taken much deeper cuts over the past four years:
- Energy and Environmental Affairs, 20%
- Housing and Economic Development, 16%
- Education other than local aid, 13%
- Judiciary, 15%
- Public Safety, 25%
- Perhaps excepting the poorest communities, those most dependent on state aid, most local governments are seeing revenues that are uptrending because their property tax levies keep rising by 2.5% per year or more even as incomes stagnate.
- The House of Representatives operations account, at $34.3 million in FY2012, is slightly down as compared to FY2008; Joint Legislative Operations, which includes the legislature’s technology spending is up from $5.8 million to $7.7 million. The legislature has going through a major systems upgrade.
For those who want to delve deeper, this spreadsheet comparing the HWM budget to previous budgets and spending at various levels of detail may be helpful.

