
There are many ideas out there about how earnings, real and expected, affect spending. Milton Friedman’s 1957 Permanent Income Hypothesis is probably the most famous. In its strictest form, it implies that changes in current income, such as a raise or inheritance, shouldn’t change consumption at all.
That’s an awfully strong statement. In 1989, John Campbell and Greg Mankiw proposed a modified version of this idea that incorporated the reality that many people use shorter-term budgets, and will increase their planned spending as the result of a raise or some windfall.
But what does a person’s income look like over the course of a lifetime? There’s no one clear picture of this, but the following data provide some insight based on gender and year of birth.
Some explanation of these charts:
A single line represents the same group of people across the whole chart. For example, the red line in the chart below represents income for men who were born between 1913 and 1922. Their median income in 1977 (when they were aged 55 to 64) about $40,000 in real terms.
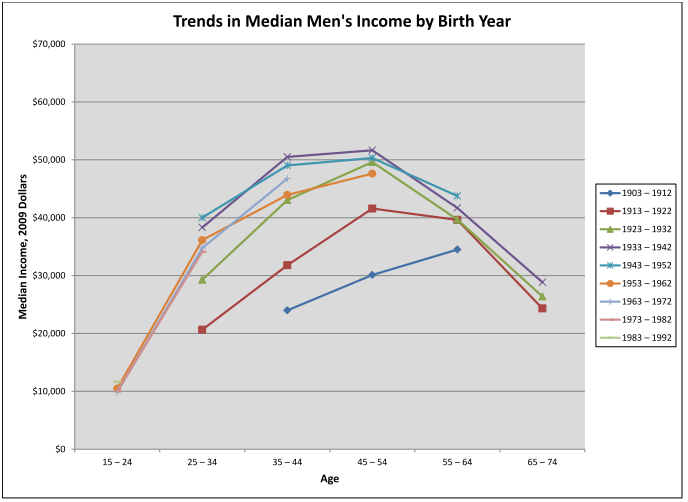 In the early 20th century, the later a man was born, the more he could expect to earn in his lifetime. This began to change during World War II. Incomes for men stagnated, and decreased in come cases. The opposite is true for women.
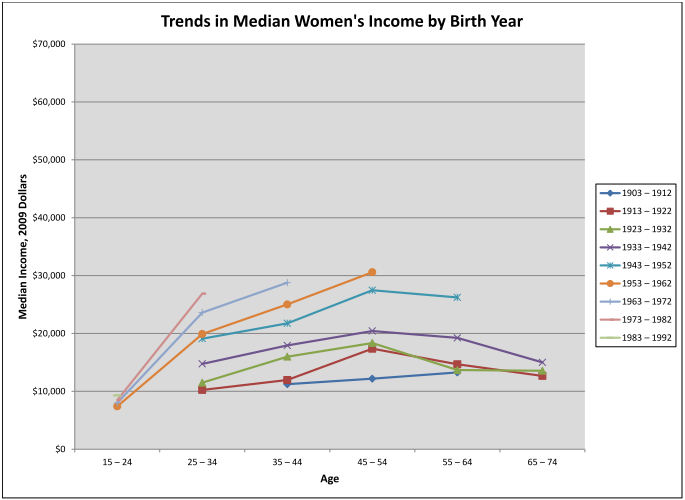 In the early 20th century, women’s incomes were stagnant. Their incomes increased during the war, as one might expect. While income levels for women are lower, their growth rates at any age are still much higher than for men.
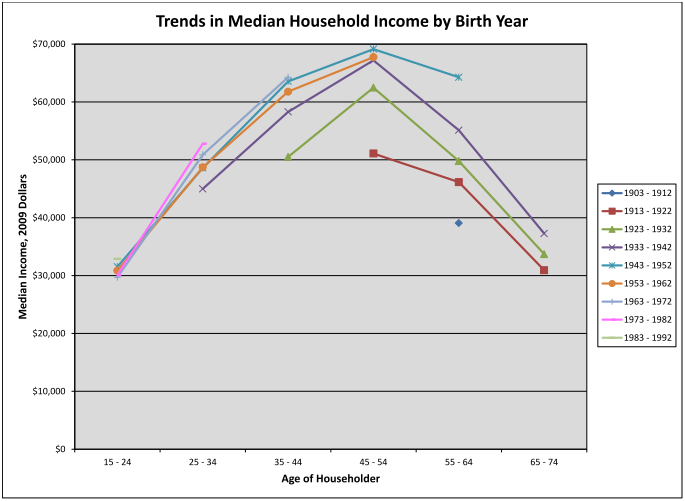
When combining these data for what the US Census considers a household, incomes increased until the war, and then leveled off. The growth of women’s incomes appears to have stabilized households and kept them from showing the same decreases that men’s earnings have.
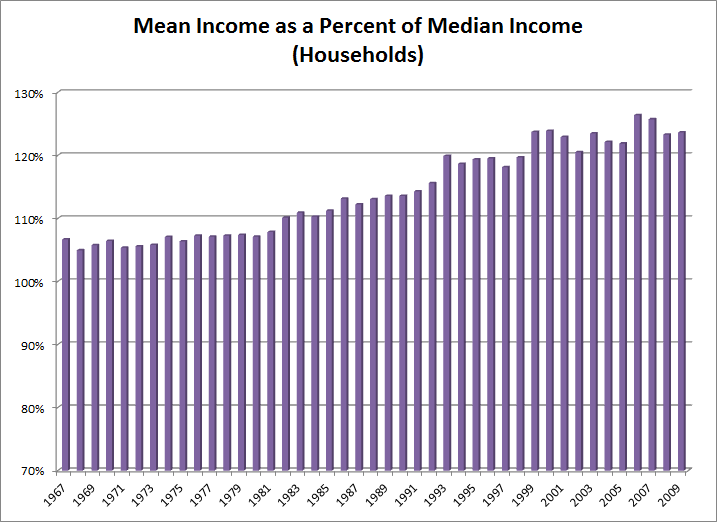
So what does this all mean? As always, it’s all in how you slice the data. For example, households are generally smaller than they used to be, so one could say that people are better off. On the other hand, if one also looks at mean incomes, the picture becomes one of increasing inequality. (When the “tail” at the top of the distribution becomes longer, the mean rises higher and higher above the median.)
Please post a reply if you have any questions or comments about these data, or would like to see similar topics researched.
– Andrew
Source PDF
Great job, Andrew!
These data really how the middle class is feeling a squeeze over the past few decades.
A recent article in The Economist provides a more global perspective on the issue of income inequality.
Very helpful, Andrew. It’s critical that we face the transcendent international trends that the article points to instead of falling into twentieth century class war thought patterns. Have you found the underlying OECD study?
The OECD paper is available here.
Some quick thoughts:
1. Real Disposable Incomes for the lowest-earning households of the OECD grew much more quickly than for those in the US (1.4% vs 0.5%).
2. Globalization and technological advances have played a part in these increases. It’s worth noting that the developing BRIC nations are not members of the OECD, so their gains don’t show up here.
Lots more detail available in the paper!