
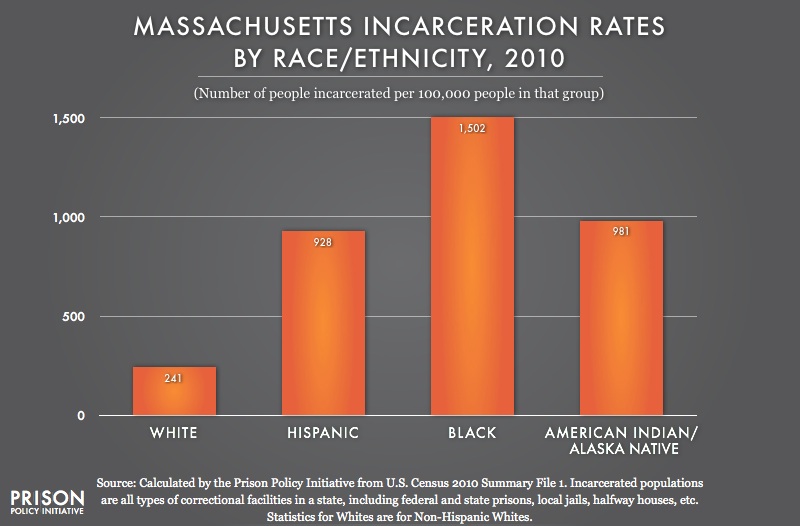
The Prison Policy Initiative has compiled incarceration rates by race/ethnicity using data from the 2010 census. Their graphic above shows wide contrasts in Massachusetts.
While Massachusetts’ white and black incarceration rates are low among states, its black rate is 6 times its white rate. The black-white incarceration rate disparity is wider than the black-white poverty rate disparity — the white poverty rate in the 2007-2011 period in Massachusetts was 8.3%, as compared to 21.1% for blacks and 29.9% for Hispanics. See Census Report: Poverty Rates for Selected Detailed Race and Hispanic Groups by State and Place: 2007–2011.
Massachusetts’ Hispanic rate is above the median among states, but Massachusetts’ 1:4 white-Hispanic incarceration rate disparity is roughly equal to its white-Hispanic poverty rate disparity. As the Hispanic share of the Massachusetts resident population has grown from 1% in 1970 to almost 10% in 2010, the Hispanic share of the state prison population has grown from nil in the 70s to 26% of the total in 2015.
We have replicated the Prison Policy Initiative computations for each state in the table below.
Persons in adult correctional facilities per 100,000 residents by state and race/ethnicity -- 2010 Census
| White | Hispanic | Black | |
|---|---|---|---|
| Alabama | 535 | 767 | 1788 |
| Alaska | 370 | 650 | 1294 |
| Arizona | 633 | 1453 | 3184 |
| Arkansas | 593 | 915 | 2432 |
| California | 453 | 757 | 3036 |
| Colorado | 509 | 1280 | 3651 |
| Connecticut | 241 | 1195 | 2260 |
| Delaware | 414 | 250 | 2002 |
| District of Columbia | 50 | 526 | 1031 |
| Florida | 626 | 536 | 2555 |
| Georgia | 640 | 1099 | 2036 |
| Hawaii | 412 | 415 | 1032 |
| Idaho | 656 | 1026 | 3252 |
| Illinois | 258 | 472 | 2128 |
| Indiana | 542 | 781 | 2814 |
| Iowa | 324 | 692 | 3473 |
| Kansas | 418 | 873 | 3306 |
| Kentucky | 705 | 1657 | 3545 |
| Louisiana | 675 | 1114 | 2748 |
| Maine | 259 | 407 | 1553 |
| Maryland | 310 | 311 | 1437 |
| Massachusetts | 241 | 928 | 1502 |
| Michigan | 374 | 588 | 2169 |
| Minnesota | 216 | 959 | 2321 |
| Mississippi | 600 | 4869 | 1788 |
| Missouri | 495 | 654 | 2337 |
| Montana | 423 | 994 | 3601 |
| Nebraska | 282 | 867 | 2452 |
| Nevada | 604 | 635 | 2624 |
| New Hampshire | 336 | 954 | 2241 |
| New Jersey | 218 | 609 | 1992 |
| New Mexico | 659 | 980 | 2609 |
| New York | 219 | 607 | 1655 |
| North Carolina | 357 | 491 | 1664 |
| North Dakota | 245 | 1032 | 1671 |
| Ohio | 422 | 1072 | 2336 |
| Oklahoma | 767 | 1876 | 3796 |
| Oregon | 506 | 809 | 3195 |
| Pennsylvania | 375 | 2001 | 3269 |
| Rhode Island | 210 | 696 | 1884 |
| South Carolina | 433 | 1205 | 1996 |
| South Dakota | 508 | 1727 | 4663 |
| Tennessee | 502 | 595 | 1962 |
| Texas | 768 | 972 | 2855 |
| Utah | 367 | 832 | 2711 |
| Vermont | 220 | 891 | 2214 |
| Virginia | 466 | 482 | 2418 |
| Washington | 392 | 601 | 2372 |
| West Virginia | 622 | 4585 | 7360 |
| Wisconsin | 416 | 622 | 4042 |
| Wyoming | 532 | 1059 | 3075 |
| Puerto Rico | 590 | 344 | 613 |
The disparity between races incarcerated cannot insinuate incarceration prejudice without a study of the percentages of crimes committed by each race or ethnicity. I would also like to see results of a study of how many illegal aliens are incarcerated in Mass and at what cost.
There are lot of things happening at once, but when we see very high incarceration rates in a few subgroups, we just have to be concerned about the long term consequences.