
There is a national debate continuing about the role of increased incarceration in bringing crime rates down. This much clear in that debate: Many factors contributed to the fall in crime rates. Incarceration played a role, but incarceration was just one factor and incarceration has diminishing returns. If we lock up the most dangerous repeat offenders — as prosecutors seek to do — we cut crime and protect the public. If we lock up too many minor offenders, we waste money and may even increase crime. There is a balance to strike.
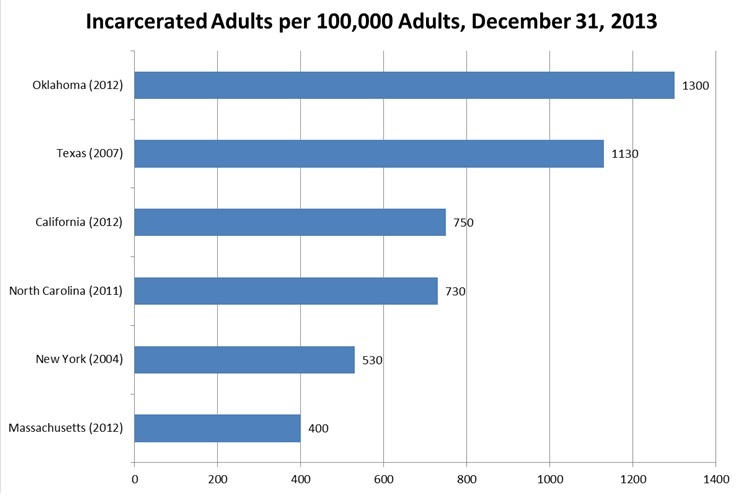
Many states have concluded that they have gone past the balance point into the zone of where incarceration costs exceed benefits and they have undertaken reforms to reduce incarceration. However, incarceration levels vary widely across states and from community to community. The chart above selects states with recent major reforms. Even after their widely admired reforms, their incarceration rates are far above the incarceration rate in Massachusetts, which, at 400 per 100,000 is less than half the national average of 830.
Just as actual levels of incarceration vary, ideal levels also vary. We cannot infer that Massachusetts is more wisely lenient than other states without a much finer analysis of crime rates and local conditions. Some other states may have higher incarceration rates because they have more crime or more serious crime. Similarly, while international comparisons make Massachusetts’ incarceration rate look relatively high, we should not assume that other countries face the same problems we face — for example, guns are much more available in the United States than elsewhere.
We should hesitate to draw inferences about about our own reform opportunities from what is happening elsewhere. We should be very cautious in asserting that Massachusetts can achieve the savings that other states have achieved through criminal justice reforms. At the same time, we should take little comfort in our favorable comparisons to other states.
Chart Data Source: Bureau of Justice Statics, Correctional Populations in the United States, 2013, Appendix Table 1. The population levels are as of December 31, 2013. The years following the state names are the dates of recent major reforms. These statistics include both state and county facilities.