
A critical question in all transportation planning is how much growth we should expect in different areas. Future needs for transportation capacity depend on the future number and location of jobs and residences.
The Central Transportation Planning Staff is engaged in constant ongoing efforts to identify the best estimates of both job and housing growth in cooperation with the Metropolitan Area Planning Council.
In the context of conversations about the Rail Vision Study, I requested their latest information for my district and adjoining high development areas in Allston.
As the transmittal letter notes — these projections are not necessarily the projections that will be used for planning in the I-90 interchange project. The discussion is ongoing about development expectations associated with that project and the discussion may lead to an upwards revision of estimates in that area.
Summary Findings
Boston Region Metropolitan Planning Organization (MPO) Land Use Assumptions for Destination 2040 Long Range Plan from MAPC, Fall 2018.
| Geography | 2016 Employment | 2016 Households | 2016 Population | 2040 Employment | 2040 Households | 2040 Population | 2040 Employment Growth | 2040 Households Growth | 2040 Population Growth |
|
|---|---|---|---|---|---|---|---|---|---|---|
| WB Senate District | 180,700 | 81,500 | 165,100 | 204,700 | 101,200 | 197,400 | 13% | 24% | 20% | |
| Allston | 12,800 | 6,500 | 14,900 | 18,600 | 102,00 | 20,400 | 45% | 57% | 37% | |
| Boston Area | 1,925,400 | 1,313,100 | 3,248,900 | 2,084,700 | 1,582,600 | 3,704,500 | 8% | 21% | 14% |
The summary conclusion is that especially Allston but also many other parts of Boston and a few pockets in Belmont and Watertown are looking at significant growth.
Details
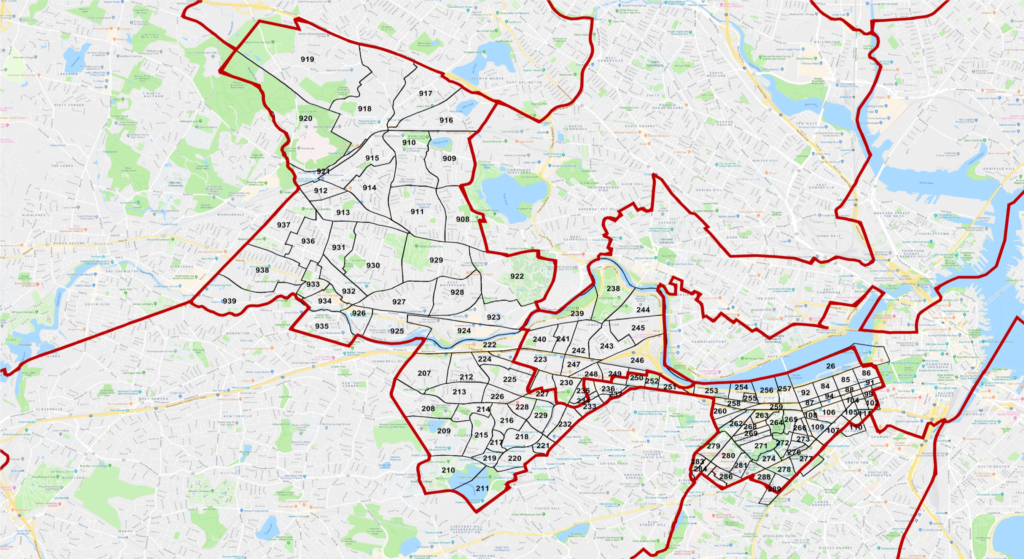
Map of Transit Analysis Zones

The CTPS uses Transit Analysis Zones to analyze regional traffic patterns. Expected growth — based on zoning, known projects and trends — is mapped at this level.
Projections by TAZ
The projections for individual transit analysis zones appear below. I’d welcome observations about particular areas.
The source is the “Boston Region Metropolitan Planning Organization (MPO) Land Use Assumptions for Destination 2040 Long Range Plan from MAPC, Fall 2018.”
| TAZ | MUNICIPALITY | Geography | 2016 Total Employment | 2016 Households | 2016 Population | 2040 Employment | 2040 Households | 2040 Population | 2040 Employment Growth | 2040 Households Growth | 2040 Population Growth |
|---|---|---|---|---|---|---|---|---|---|---|---|
| 230 | BOSTON,MA | Allston | 591 | 756 | 1,588 | 591 | 916 | 1,766 | 0% | 21% | 11% |
| 238 | BOSTON,MA | Allston | 635 | - | - | 818 | 200 | 421 | 29% | 0% | 0% |
| 239 | BOSTON,MA | Allston | 2,760 | 305 | 616 | 2,881 | 476 | 929 | 4% | 56% | 51% |
| 240 | BOSTON,MA | Allston | 2,034 | 732 | 1,789 | 2,076 | 861 | 2,026 | 2% | 18% | 13% |
| 241 | BOSTON,MA | Allston | 403 | 142 | 311 | 692 | 170 | 392 | 72% | 20% | 26% |
| 242 | BOSTON,MA | Allston | 883 | 603 | 1,591 | 893 | 719 | 1,734 | 1% | 19% | 9% |
| 243 | BOSTON,MA | Allston | 329 | 944 | 2,485 | 331 | 1,126 | 2,582 | 0% | 19% | 4% |
| 244 | BOSTON,MA | Allston | 1,205 | 1,087 | 1,881 | 2,722 | 1,752 | 2,808 | 126% | 61% | 49% |
| 245 | BOSTON,MA | Allston | 1,472 | 55 | 147 | 2,048 | 305 | 612 | 39% | 455% | 316% |
| 246 | BOSTON,MA | Allston | 587 | - | - | 3,505 | 656 | 1,137 | 497% | 0% | 0% |
| 247 | BOSTON,MA | Allston | 773 | 487 | 1,153 | 786 | 829 | 1,669 | 2% | 70% | 45% |
| 248 | BOSTON,MA | Allston | 817 | 449 | 1,151 | 886 | 833 | 1,642 | 8% | 86% | 43% |
| 249 | BOSTON,MA | Allston | 315 | 962 | 2,195 | 340 | 1,389 | 2,652 | 8% | 44% | 21% |
| Total | Allston | 12,804 | 6,522 | 14,907 | 18,568 | 10,232 | 20,370 | 45% | 57% | 37% | |
| 26 | BOSTON,MA | 2D-SM | 911 | 923 | 1,806 | 914 | 1,125 | 2,158 | 0% | 22% | 19% |
| 84 | BOSTON,MA | 2D-SM | 247 | 1,067 | 1,807 | 248 | 1,272 | 2,136 | 0% | 19% | 18% |
| 85 | BOSTON,MA | 2D-SM | 400 | 1,303 | 2,154 | 401 | 1,554 | 2,576 | 0% | 19% | 20% |
| 86 | BOSTON,MA | 2D-SM | 990 | 1,133 | 1,968 | 1,000 | 1,352 | 2,422 | 1% | 19% | 23% |
| 87 | BOSTON,MA | 2D-SM | 780 | 392 | 630 | 803 | 474 | 831 | 3% | 21% | 32% |
| 88 | BOSTON,MA | 2D-SM | 1,383 | 260 | 510 | 1,406 | 310 | 666 | 2% | 19% | 31% |
| 89 | BOSTON,MA | 2D-SM | 1,141 | 102 | 244 | 1,140 | 122 | 364 | 0% | 20% | 49% |
| 90 | BOSTON,MA | 2D-SM | 2,557 | 84 | 171 | 2,575 | 100 | 233 | 1% | 19% | 36% |
| 91 | BOSTON,MA | 2D-SM | 1,014 | 182 | 372 | 1,021 | 218 | 509 | 1% | 20% | 37% |
| 92 | BOSTON,MA | 2D-SM | 528 | 1,239 | 2,027 | 530 | 1,477 | 2,447 | 0% | 19% | 21% |
| 93 | BOSTON,MA | 2D-SM | 1,829 | 111 | 255 | 1,854 | 139 | 353 | 1% | 25% | 38% |
| 94 | BOSTON,MA | 2D-SM | 699 | 330 | 585 | 701 | 392 | 734 | 0% | 19% | 25% |
| 95 | BOSTON,MA | 2D-SM | 2,333 | 153 | 284 | 2,343 | 183 | 378 | 0% | 20% | 33% |
| 96 | BOSTON,MA | 2D-SM | 3,392 | - | - | 3,409 | - | - | 1% | 0% | 0% |
| 97 | BOSTON,MA | 2D-SM | 1,871 | 12 | 34 | 1,942 | 14 | 51 | 4% | 17% | 50% |
| 99 | BOSTON,MA | 2D-SM | 3,523 | - | - | 3,739 | - | - | 6% | 0% | 0% |
| 102 | BOSTON,MA | 2D-SM | 3,027 | 189 | 367 | 4,904 | 890 | 1,480 | 62% | 371% | 303% |
| 103 | BOSTON,MA | 2D-SM | 901 | 68 | 119 | 1,720 | 830 | 1,428 | 91% | 1121% | 1100% |
| 104 | BOSTON,MA | 2D-SM | 2,620 | 174 | 304 | 2,627 | 250 | 445 | 0% | 44% | 46% |
| 105 | BOSTON,MA | 2D-SM | 3,301 | 276 | 536 | 3,198 | 794 | 1,401 | -3% | 188% | 161% |
| 106 | BOSTON,MA | 2D-SM | 9,840 | 876 | 1,455 | 10,433 | 1,020 | 1,741 | 6% | 16% | 20% |
| 107 | BOSTON,MA | 2D-SM | 1,716 | 2,065 | 3,377 | 1,724 | 2,463 | 3,970 | 0% | 19% | 18% |
| 108 | BOSTON,MA | 2D-SM | 931 | 2 | 4 | 1,940 | 2 | 4 | 108% | 0% | 0% |
| 109 | BOSTON,MA | 2D-SM | 2,978 | 565 | 1,094 | 2,833 | 813 | 1,529 | -5% | 44% | 40% |
| 110 | BOSTON,MA | 2D-SM | 292 | 1,084 | 2,425 | 294 | 1,293 | 2,779 | 1% | 19% | 15% |
| 111 | BOSTON,MA | 2D-SM | 2,728 | 490 | 886 | 2,906 | 732 | 1,295 | 7% | 49% | 46% |
| 207 | BOSTON,MA | 2D-SM | 397 | 1,013 | 2,476 | 400 | 1,208 | 2,804 | 1% | 19% | 13% |
| 208 | BOSTON,MA | 2D-SM | 468 | 1,072 | 2,206 | 488 | 1,256 | 2,414 | 4% | 17% | 9% |
| 209 | BOSTON,MA | 2D-SM | 793 | 865 | 1,876 | 897 | 1,033 | 2,020 | 13% | 19% | 8% |
| 210 | BOSTON,MA | 2D-SM | 854 | 410 | 703 | 1,368 | 489 | 851 | 60% | 19% | 21% |
| 211 | BOSTON,MA | 2D-SM | 959 | 797 | 1,532 | 1,225 | 925 | 1,762 | 28% | 16% | 15% |
| 212 | BOSTON,MA | 2D-SM | 131 | 777 | 1,889 | 130 | 927 | 2,041 | 0% | 19% | 8% |
| 213 | BOSTON,MA | 2D-SM | 352 | 1,110 | 2,419 | 396 | 1,337 | 2,689 | 13% | 20% | 11% |
| 214 | BOSTON,MA | 2D-SM | 386 | 372 | 820 | 388 | 452 | 927 | 1% | 22% | 13% |
| 215 | BOSTON,MA | 2D-SM | 89 | 846 | 1,906 | 89 | 1,010 | 1,914 | 0% | 19% | 0% |
| 216 | BOSTON,MA | 2D-SM | 435 | 709 | 1,568 | 437 | 845 | 1,589 | 1% | 19% | 1% |
| 217 | BOSTON,MA | 2D-SM | 222 | 987 | 1,653 | 227 | 1,150 | 1,916 | 2% | 17% | 16% |
| 218 | BOSTON,MA | 2D-SM | 48 | 1,489 | 2,832 | 49 | 1,776 | 3,039 | 2% | 19% | 7% |
| 219 | BOSTON,MA | 2D-SM | 91 | 987 | 1,635 | 91 | 1,178 | 1,917 | 0% | 19% | 17% |
| 220 | BOSTON,MA | 2D-SM | 207 | 2,183 | 4,059 | 209 | 2,563 | 4,453 | 1% | 17% | 10% |
| 221 | BOSTON,MA | 2D-SM | 139 | 931 | 1,721 | 144 | 1,207 | 2,143 | 4% | 30% | 25% |
| 222 | BOSTON,MA | 2D-SM | 740 | 182 | 374 | 742 | 283 | 585 | 0% | 55% | 56% |
| 223 | BOSTON,MA | 2D-SM | 3,758 | 388 | 853 | 6,625 | 792 | 1,462 | 76% | 104% | 71% |
| 224 | BOSTON,MA | 2D-SM | 553 | 639 | 1,575 | 560 | 750 | 1,708 | 1% | 17% | 8% |
| 225 | BOSTON,MA | 2D-SM | 226 | 836 | 1,865 | 228 | 998 | 2,054 | 1% | 19% | 10% |
| 226 | BOSTON,MA | 2D-SM | 491 | 516 | 1,148 | 494 | 598 | 1,240 | 1% | 16% | 8% |
| 227 | BOSTON,MA | 2D-SM | 1,050 | 722 | 1,525 | 1,061 | 861 | 1,752 | 1% | 19% | 15% |
| 228 | BOSTON,MA | 2D-SM | 2,200 | - | - | 2,260 | - | - | 3% | 0% | 0% |
| 229 | BOSTON,MA | 2D-SM | 627 | 953 | 2,006 | 633 | 1,266 | 2,602 | 1% | 33% | 30% |
| 231 | BOSTON,MA | 2D-SM | 153 | 1,200 | 2,194 | 155 | 1,432 | 2,435 | 1% | 19% | 11% |
| 232 | BOSTON,MA | 2D-SM | 424 | 1,616 | 2,832 | 443 | 1,887 | 3,124 | 5% | 17% | 10% |
| 233 | BOSTON,MA | 2D-SM | 435 | 1,212 | 2,421 | 438 | 1,414 | 2,715 | 1% | 17% | 12% |
| 234 | BOSTON,MA | 2D-SM | 143 | 741 | 1,681 | 145 | 884 | 1,966 | 2% | 19% | 17% |
| 235 | BOSTON,MA | 2D-SM | 331 | 828 | 1,805 | 334 | 988 | 1,957 | 1% | 19% | 8% |
| 236 | BOSTON,MA | 2D-SM | 902 | 667 | 1,401 | 906 | 796 | 1,530 | 0% | 19% | 9% |
| 237 | BOSTON,MA | 2D-SM | 581 | 737 | 1,350 | 582 | 879 | 1,654 | 0% | 19% | 23% |
| 250 | BOSTON,MA | 2D-SM | 1,281 | 508 | 940 | 1,284 | 604 | 1,115 | 0% | 19% | 19% |
| 251 | BOSTON,MA | 2D-SM | 2,341 | 2 | 5 | 2,294 | 220 | 484 | -2% | 10900% | 9580% |
| 252 | BOSTON,MA | 2D-SM | 1,279 | - | - | 1,290 | - | - | 1% | 0% | 0% |
| 253 | BOSTON,MA | 2D-SM | 3,228 | 34 | 95 | 3,244 | 40 | 121 | 0% | 18% | 27% |
| 254 | BOSTON,MA | 2D-SM | 895 | 86 | 184 | 1,580 | 102 | 270 | 77% | 19% | 47% |
| 255 | BOSTON,MA | 2D-SM | 706 | 50 | 96 | 828 | 59 | 130 | 17% | 18% | 35% |
| 256 | BOSTON,MA | 2D-SM | 1,351 | 466 | 847 | 1,426 | 556 | 1,110 | 6% | 19% | 31% |
| 257 | BOSTON,MA | 2D-SM | 289 | 677 | 1,222 | 292 | 805 | 1,510 | 1% | 19% | 24% |
| 258 | BOSTON,MA | 2D-SM | 2,975 | 325 | 589 | 3,305 | 388 | 804 | 11% | 19% | 37% |
| 259 | BOSTON,MA | 2D-SM | 1,727 | 792 | 1,361 | 2,069 | 942 | 1,666 | 20% | 19% | 22% |
| 260 | BOSTON,MA | 2D-SM | 339 | 493 | 894 | 1,132 | 576 | 1,132 | 234% | 17% | 27% |
| 261 | BOSTON,MA | 2D-SM | 163 | 734 | 1,340 | 171 | 853 | 1,540 | 5% | 16% | 15% |
| 262 | BOSTON,MA | 2D-SM | 2,360 | 750 | 1,421 | 2,601 | 973 | 1,785 | 10% | 30% | 26% |
| 263 | BOSTON,MA | 2D-SM | 2,336 | - | - | 2,336 | - | - | 0% | 0% | 0% |
| 264 | BOSTON,MA | 2D-SM | 373 | 442 | 803 | 682 | 755 | 1,387 | 83% | 71% | 73% |
| 265 | BOSTON,MA | 2D-SM | 1,268 | 568 | 1,103 | 2,160 | 1,237 | 2,255 | 70% | 118% | 104% |
| 266 | BOSTON,MA | 2D-SM | 143 | 1,485 | 2,338 | 144 | 1,740 | 2,795 | 1% | 17% | 20% |
| 267 | BOSTON,MA | 2D-SM | 633 | 522 | 966 | 635 | 622 | 1,249 | 0% | 19% | 29% |
| 268 | BOSTON,MA | 2D-SM | 1,902 | 1,026 | 1,797 | 2,162 | 1,368 | 2,258 | 14% | 33% | 26% |
| 269 | BOSTON,MA | 2D-SM | 652 | 1,176 | 1,968 | 686 | 1,431 | 2,320 | 5% | 22% | 18% |
| 270 | BOSTON,MA | 2D-SM | 271 | 1,080 | 1,811 | 273 | 1,563 | 2,516 | 1% | 45% | 39% |
| 271 | BOSTON,MA | 2D-SM | 102 | 1,308 | 2,121 | 104 | 1,560 | 2,500 | 2% | 19% | 18% |
| 272 | BOSTON,MA | 2D-SM | 58 | 326 | 695 | 58 | 389 | 821 | 0% | 19% | 18% |
| 273 | BOSTON,MA | 2D-SM | 530 | 1,153 | 2,388 | 536 | 1,368 | 2,771 | 1% | 19% | 16% |
| 274 | BOSTON,MA | 2D-SM | 1,865 | 98 | 211 | 1,984 | 117 | 281 | 6% | 19% | 33% |
| 275 | BOSTON,MA | 2D-SM | 24 | 436 | 857 | 25 | 520 | 1,061 | 2% | 19% | 24% |
| 276 | BOSTON,MA | 2D-SM | 574 | 315 | 682 | 580 | 376 | 801 | 1% | 19% | 17% |
| 277 | BOSTON,MA | 2D-SM | 4,587 | 353 | 638 | 4,879 | 787 | 1,406 | 6% | 123% | 120% |
| 278 | BOSTON,MA | 2D-SM | 2,219 | 4 | 11 | 2,293 | 4 | 16 | 3% | 0% | 45% |
| 279 | BOSTON,MA | 2D-SM | 1,132 | 129 | 203 | 1,482 | 154 | 256 | 31% | 19% | 26% |
| 280 | BOSTON,MA | 2D-SM | 9,756 | - | - | 14,373 | 85 | 227 | 47% | 0% | 0% |
| 281 | BOSTON,MA | 2D-SM | 1,917 | - | - | 2,179 | - | - | 14% | 0% | 0% |
| 282 | BOSTON,MA | 2D-SM | 1,039 | 215 | 448 | 1,205 | 406 | 791 | 16% | 89% | 77% |
| 283 | BOSTON,MA | 2D-SM | 2,330 | 3 | 5 | 2,345 | 3 | 6 | 1% | 0% | 20% |
| 284 | BOSTON,MA | 2D-SM | 2,625 | 114 | 309 | 3,002 | 190 | 465 | 14% | 67% | 50% |
| 285 | BOSTON,MA | 2D-SM | 3,298 | 136 | 223 | 3,556 | 162 | 325 | 8% | 19% | 46% |
| 286 | BOSTON,MA | 2D-SM | 11,685 | - | - | 13,755 | - | - | 18% | 0% | 0% |
| 287 | BOSTON,MA | 2D-SM | 12,872 | - | - | 12,925 | - | - | 0% | 0% | 0% |
| 288 | BOSTON,MA | 2D-SM | 579 | - | - | 1,749 | - | - | 202% | 0% | 0% |
| 289 | BOSTON,MA | 2D-SM | 204 | 425 | 1,076 | 967 | 568 | 1,335 | 374% | 34% | 24% |
| 908 | BELMONT,MA | 2D-SM | 176 | 1,303 | 3,032 | 178 | 1,509 | 3,287 | 1% | 16% | 8% |
| 909 | BELMONT,MA | 2D-SM | 568 | 688 | 1,853 | 564 | 797 | 2,053 | -1% | 16% | 11% |
| 910 | BELMONT,MA | 2D-SM | 630 | 465 | 1,226 | 636 | 524 | 1,268 | 1% | 13% | 3% |
| 911 | BELMONT,MA | 2D-SM | 389 | 1,161 | 2,848 | 391 | 1,343 | 3,199 | 1% | 16% | 12% |
| 912 | BELMONT,MA | 2D-SM | 340 | 503 | 1,352 | 343 | 582 | 1,787 | 1% | 16% | 32% |
| 913 | BELMONT,MA | 2D-SM | 458 | 1,111 | 2,600 | 521 | 1,277 | 2,823 | 14% | 15% | 9% |
| 914 | BELMONT,MA | 2D-SM | 222 | 1,132 | 2,601 | 224 | 1,311 | 2,797 | 1% | 16% | 8% |
| 915 | BELMONT,MA | 2D-SM | 174 | 761 | 1,795 | 175 | 865 | 1,806 | 0% | 14% | 1% |
| 916 | BELMONT,MA | 2D-SM | 144 | 1,043 | 2,424 | 145 | 1,221 | 2,700 | 1% | 17% | 11% |
| 917 | BELMONT,MA | 2D-SM | 300 | 668 | 1,762 | 316 | 774 | 1,920 | 5% | 16% | 9% |
| 918 | BELMONT,MA | 2D-SM | 1,313 | 455 | 1,391 | 1,322 | 527 | 1,621 | 1% | 16% | 17% |
| 919 | BELMONT,MA | 2D-SM | 366 | 468 | 1,325 | 367 | 542 | 1,442 | 0% | 16% | 9% |
| 920 | BELMONT,MA | 2D-SM | 2,011 | 300 | 670 | 2,173 | 347 | 724 | 8% | 16% | 8% |
| 921 | BELMONT,MA | 2D-SM | 262 | 145 | 456 | 265 | 168 | 597 | 1% | 16% | 31% |
| 922 | WATERTOWN,MA | 2D-SM | 3,379 | 787 | 1,726 | 3,450 | 911 | 1,901 | 2% | 16% | 10% |
| 923 | WATERTOWN,MA | 2D-SM | 1,563 | 495 | 1,000 | 1,734 | 574 | 1,176 | 11% | 16% | 18% |
| 924 | WATERTOWN,MA | 2D-SM | 2,569 | 491 | 988 | 2,346 | 695 | 1,339 | -9% | 42% | 36% |
| 925 | WATERTOWN,MA | 2D-SM | 790 | 616 | 1,365 | 827 | 753 | 1,620 | 5% | 22% | 19% |
| 926 | WATERTOWN,MA | 2D-SM | 470 | 306 | 650 | 474 | 352 | 774 | 1% | 15% | 19% |
| 927 | WATERTOWN,MA | 2D-SM | 1,929 | 1,289 | 2,761 | 1,951 | 1,493 | 3,133 | 1% | 16% | 13% |
| 928 | WATERTOWN,MA | 2D-SM | 1,430 | 999 | 2,162 | 1,788 | 1,157 | 2,389 | 25% | 16% | 10% |
| 929 | WATERTOWN,MA | 2D-SM | 236 | 1,494 | 3,083 | 236 | 1,731 | 3,485 | 0% | 16% | 13% |
| 930 | WATERTOWN,MA | 2D-SM | 442 | 1,663 | 3,606 | 444 | 1,926 | 3,953 | 1% | 16% | 10% |
| 931 | WATERTOWN,MA | 2D-SM | 186 | 661 | 1,573 | 187 | 766 | 1,755 | 1% | 16% | 12% |
| 932 | WATERTOWN,MA | 2D-SM | 240 | 766 | 1,596 | 242 | 887 | 1,875 | 1% | 16% | 17% |
| 933 | WATERTOWN,MA | 2D-SM | 293 | 825 | 1,527 | 295 | 956 | 1,835 | 1% | 16% | 20% |
| 934 | WATERTOWN,MA | 2D-SM | 1,767 | 236 | 508 | 1,778 | 273 | 648 | 1% | 16% | 28% |
| 935 | WATERTOWN,MA | 2D-SM | 1,463 | 1,034 | 2,126 | 1,465 | 1,198 | 2,384 | 0% | 16% | 12% |
| 936 | WATERTOWN,MA | 2D-SM | 109 | 1,536 | 3,164 | 110 | 1,780 | 3,470 | 1% | 16% | 10% |
| 937 | WATERTOWN,MA | 2D-SM | 159 | 927 | 2,020 | 160 | 1,074 | 2,112 | 1% | 16% | 5% |
| 938 | WATERTOWN,MA | 2D-SM | 455 | 1,431 | 3,161 | 459 | 1,658 | 3,293 | 1% | 16% | 4% |
| 939 | WATERTOWN,MA | 2D-SM | 1,815 | 667 | 1,329 | 1,830 | 701 | 1,511 | 1% | 5% | 14% |
| Total | 2D-SM | 180,673 | 81,522 | 165,066 | 204,741 | 101,198 | 197,379 | 13% | 24% | 20% |
Transmittal from Central Transportation Planning Staff
Hello Senator Brownsberger,
Per your request last week, I have attached a spreadsheet summarizing the CTPS / MAPC demographic forecasting assumptions by transportation analysis zone (TAZ), Senate district, Allston area, and the MPO region.
This information will be used as inputs into our travel demand model for the Boston Region MPO planning process and for Rail Vision project.
The Allston I-90 FEIR will use a modified version of this data set, which will include more growth in the Allston area associated with the Harvard Development.
The Allston I-90 FEIR demographic assumptions are still being worked on.
There are four tabs in the spreadsheet summarizing employment, households, and population for 2016 and 2040.
- A map showing the TAZs that were identified for your district
- A map of the MPO area
- An inventory of demographic data by TAZ
- A summary
I propose two topics for discussion:
1. That vehicles used for so-called, “ride-sharing,” purposes should be numbered on the sides and back to allow the pedestrians, cyclists and other drivers to give feedback. (They should also have commercial plates and a, “How’s my driving,” bumper sticker.)
2. Ride-share drivers drivers who get two moving violations are banned from performing their services in the state.
Riders can rate the driver, drivers can rate their passengers but, other motorists, cyclists and pedestrians have no practical means of identifying, rating or reporting hazardous behaviors of Uber and Lyft drivers (short of dialing 911).
This is important because, I regularly see, and am affected by, mobile app-facilitated taxis- ride hails: standing in no-stopping zones, double parked, standing in and blocking the bike lane, standing in driveways, blocking sidewalks and making assorted moving violations, mostly, illegal u-turns. It mustn’t be left soley to the passenger/customer to report bad drivers because, they can be oblivious to the experience of people outside of the vehicle and may have a conflict of interest.
While if implemented, the first topic can be useful for the companies and to know how their drivers are behaving and, should share that data with the Commonwealth, who can employ appropriate measures, the second has teeth and immediate effect.
Thank you
Thanks, Fred. These are good thoughts.
Regarding the first. This was pretty heavily argued during the last round of Uber legislation. We do require some identification, but not commercial plates, which require different and more expensive insurance. I’ll try to post the regs on this.
On the second issue, very fair point. Part of the response is moving toward designated pick-up zones as the Mayor of Boston is doing. Let me check on the moving violation rules.
Per 220 CMR 274.08 (1), the regulations require that a decal identifying the TNC company is placed on the front and back panels of a vehicle at all times while the vehicle is in service. The decal or must be reflective, illuminative or otherwise visible at night or in low-light environments. This regulation, combined with a vehicles unique license plate number should ensure that every vehicle is individually identifiable from the front or back.
Regarding moving violations, 220 CMR 274.21 prohibits a driver from offering TNC services if they have more than four traffic violations in a three year period or one major traffic violation in a three year period. Major traffic violations are defined in 211 CMR 134.00 Appendix A.
Andrew Bettinelli
Chief of Staff
Office of Senator William N. Brownsberger