
The job of the MBTA bus service planner is one of the most thankless jobs in government. At peak hour, all available bus operators are deployed, so any increase in peak hour service for one route means a decrease for another. With every service reallocation, some riders suffer; these riders and their elected representatives demand explanations.
From the bottom-up perspective of the district I represent, I’m focused on the recent cuts to service in my district. But I’ve also wanted to understand the challenge from the top-down perspective that service planners have to take. This post is about understanding that perspective.
What I take away is that staffing shortages will likely reduce MBTA bus service for months or even several years. We should plan for modestly reduced bus service. We should ask for realistic service promises and then ask that those promises be kept — that buses run as scheduled.
Computations underlying the charts in this post appear in this spreadsheet.
The COVID Context
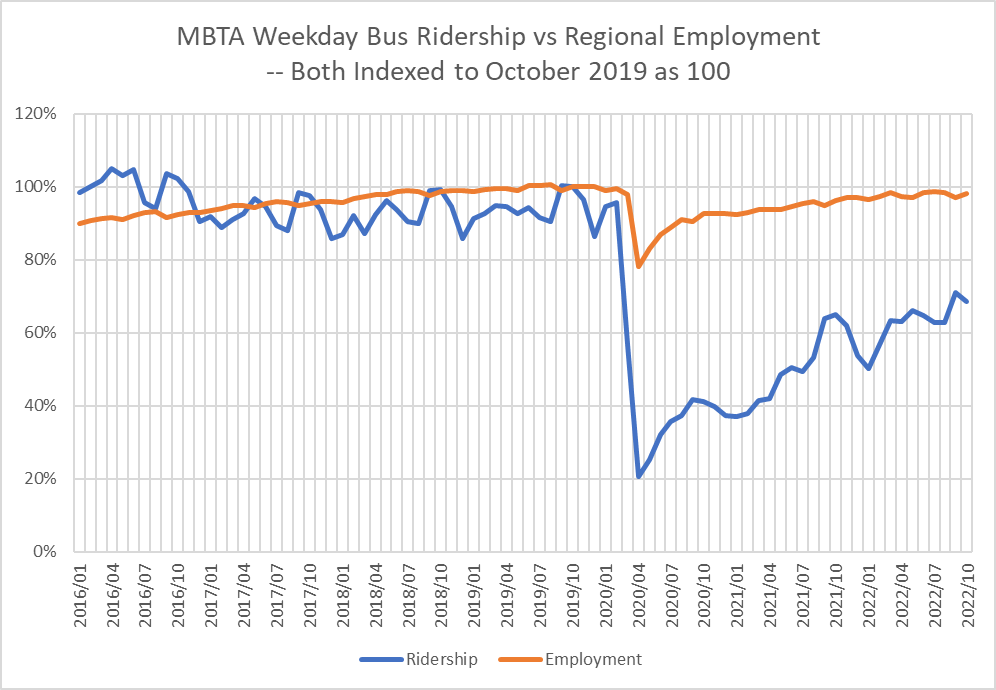
MBTA bus service planners — like bus service planners everywhere — have been adjusting service to respond to both a shortage of riders and a shortage of bus drivers.
Employment in the Boston region recovered rapidly from the pandemic shock of March 2020, reaching 91% of its pre-COVID level by September 2020. However, bus ridership was at only 42% of pre-COVID levels in September 2020 and remained at roughly 70% of pre-COVID levels in the Fall of 2022.
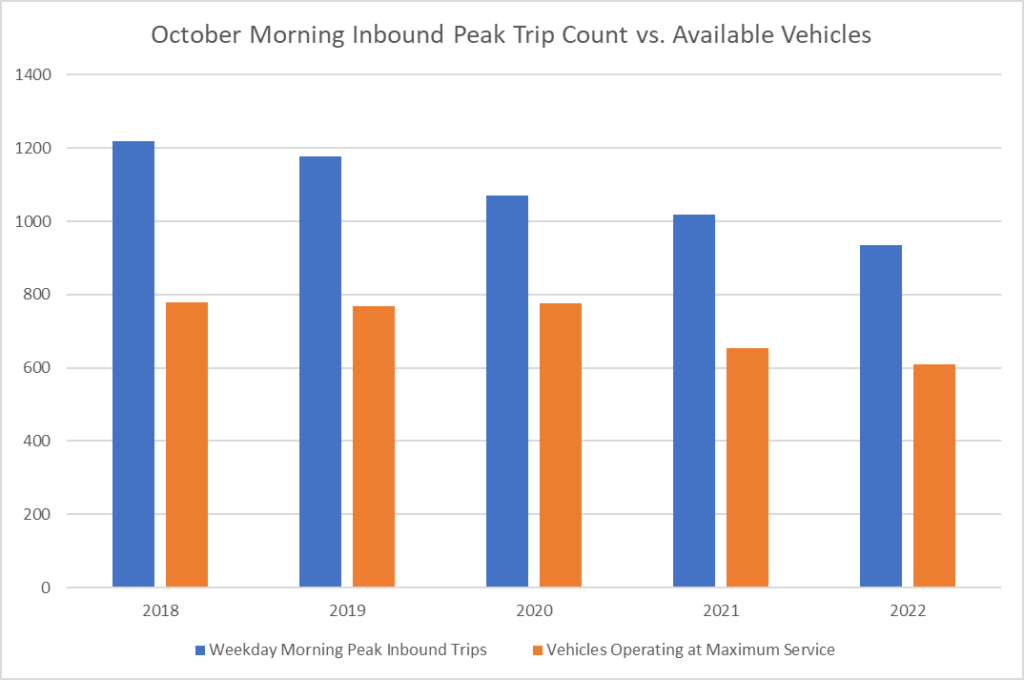
At the same time, the job of allocating staffed buses to routes has gotten harder over the past few years as the number of buses with available staff for operation in maximum service declined 21% from 767 in October 2019 to 609 in December 2022. In the same period, October morning peak inbound trips have dropped approximately 20%.
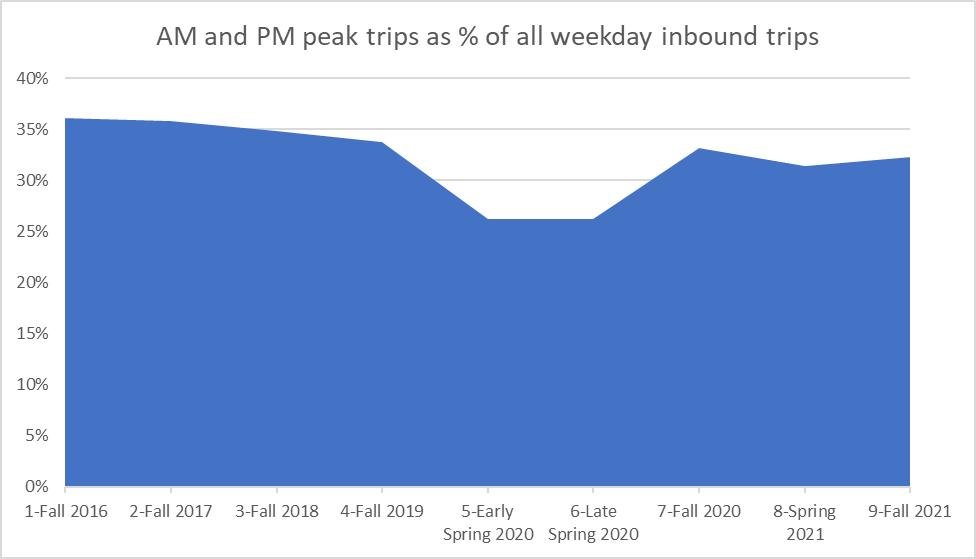
Peak service is not a complete indicator of service volume. In fact, the T has strengthened mid-day service intentionally to better serve more flexible work schedules and the peak hours have declined slightly as a share of all hours.
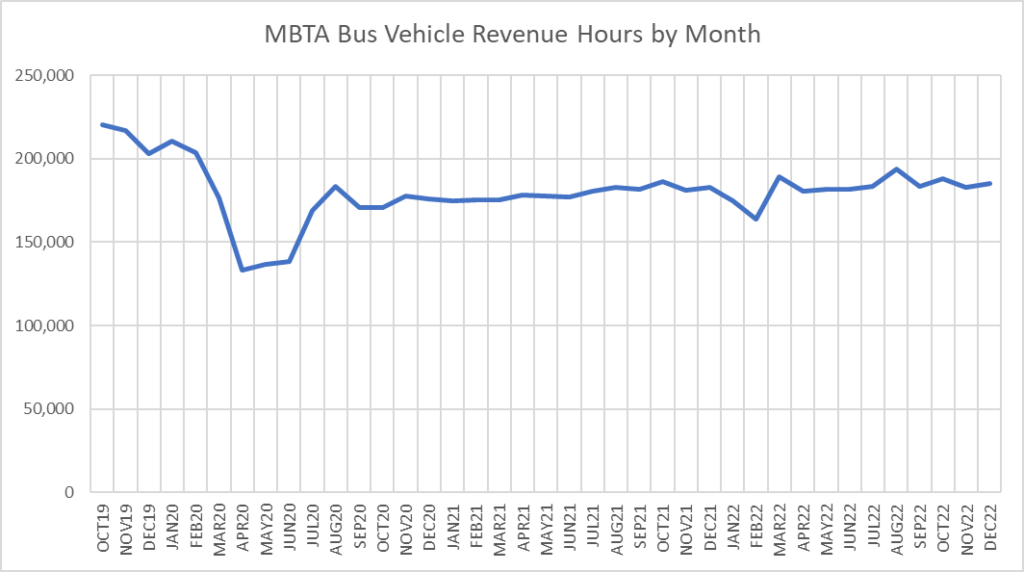
Total vehicle-revenue-hours — the sum total number of hours of that buses are in service — offers a more comprehensive metric of the total volume of service and does show a substantial decline — 15% from October 2019 to October 2022.
The declines in both peak service trips and total service hours are due primarily to the shortage of bus drivers. According to the MBTA’s legislative liaison, “The budgeted headcount for bus operators is 1,823 with the current active headcount at 1,474 and 349 vacancies.” For multiple reasons, the MBTA has seen many bus operators retire or otherwise depart. It has been unable to replace them. COVID encouraged departures and also made training and recruiting harder. Additionally, the MBTA maintains hiring standards: MBTA drivers need to have a good driving record and pass a criminal background check, a physical, and a drug test. Currently only about 10% of applicants pass these screens.
Public transit agencies across the country are facing difficulties in hiring bus drivers, according to a February 2022 survey conducted by the American Public Transportation Association. Bus operators are harder to hire than train operators because bus drivers must have a commercial driver’s license. Nationwide, people with CDLs are in short supply.
MBTA management and the MBTA board are struggling to improve recruitment and retention. But with only a few dozen operators coming on every few months and some operators departing, it may take several years for the MBTA to fill its targeted staffing level. Until the work force reaches pre-COVID levels, the MBTA must continue to run fewer total hours of bus service.
Considerations in Service Allocation
Historically, in most planning cycles, there has been great stability of routes and service allocation. Along any long-standing bus route, some people — including some who cannot drive — have chosen homes in specific contemplation of using the route. They have acted in reliance on the expectation that service on the route will continue and they will push back vocally against a loss of service. For that reason, wholesale eliminations of bus routes happen only rarely — the COVID emergency was exceptional. Even changes in span (length of service coverage during the day) are undertaken with great caution.
Until the recent Bus Network Redesign proposal, the MBTA had not in anyone’s memory considered a systemwide revision of routes. Bus Network Redesign posited an expansion of overall service by 25%, so minimizing the need to cannibalize existing routes to provide new routes. The proposal, while exciting, well-vetted, and board-approved, remains a conceptual exercise since the MBTA cannot hire the drivers it needs to provide even its existing service.
Although wholesale route eliminations are rare, on a quarterly basis, MBTA bus service planners do routinely adjust the allocation of available buses across the MBTA’s approximately 170 bus routes. The first question in reallocation is how big the operator workforce is likely to be in the coming quarter. Then the question is how to allocate resources among routes.
In allocating service, the foremost consideration has usually been crowding. Are any buses so crowded that some people are being left behind? Additionally, schedules are reviewed to see if buses are able to meet the schedules in typical traffic. When service on one route needs to be increased (and the workforce is not expanding), then the most likely response is to reduce the frequency of service on a lesser-used route.
Because overall ridership over the past three years has been depressed, crowding has been much less of an issue. Published MBTA statistics include averages of how many riders there are at each stop on each route at each time of day in each season. The chart below shows that the average maximum number of passengers on buses (passengers on the bus after any stop in the run of a bus) declined substantially through the pandemic for all times of day.
Average of maximum number of passengers on the bus at any one time on inbound trips
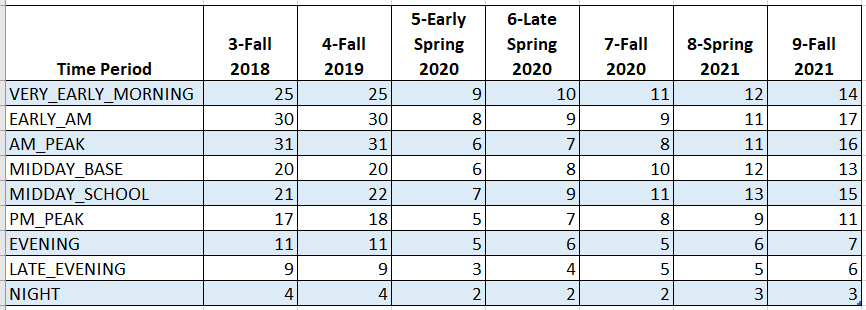
Even in the Fall of 2021, as ridership had partially recovered, only one bus in the system was showing typical peak period crowding of over 30 riders (fewer riders than seats on a typical bus). That does not mean that other buses never experienced standing-room-only runs in the Fall of 2021. Rather, it means that the average maximum load reached during the peak period was under 30 on each route except that one route. If a peak period trip is dropped on a route, the load could increase above the average maximum for the route.
While ridership was down and routine crowding abated on almost all routes, the level of persisting ridership varied widely across routes as shown in the histogram chart below.

With little actual crowding and a substantial loss of available capacity, the question in allocating service has recently been more about how to allocate cuts. With the wide variation in persisting ridership, underlying equity considerations came more to the foreground. Do people who have no viable alternative to bus service have adequate service — especially essential workers? Equity factors are hard to measure and weigh, but on any particular route, the persistence of ridership in the depth of the pandemic is an indicator that many of the riders on the route are truly transit dependent. Indeed, careful analysis of ridership changes during COVID in multiple transit systems tends to confirm what is intuitively obvious: Those without alternatives were the ones most likely to remain on the system through the pandemic.
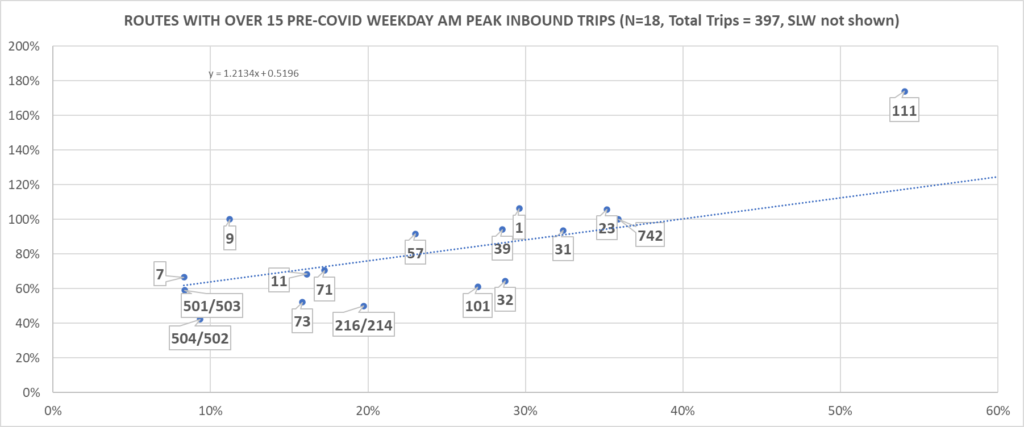
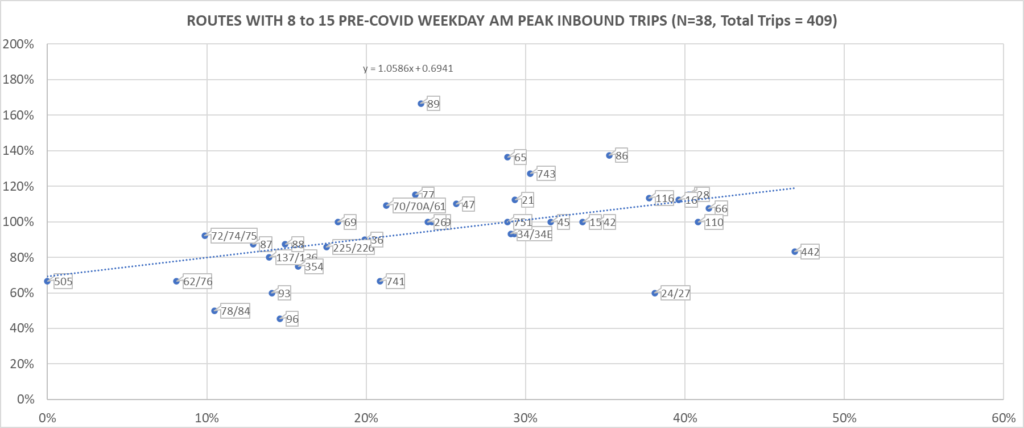
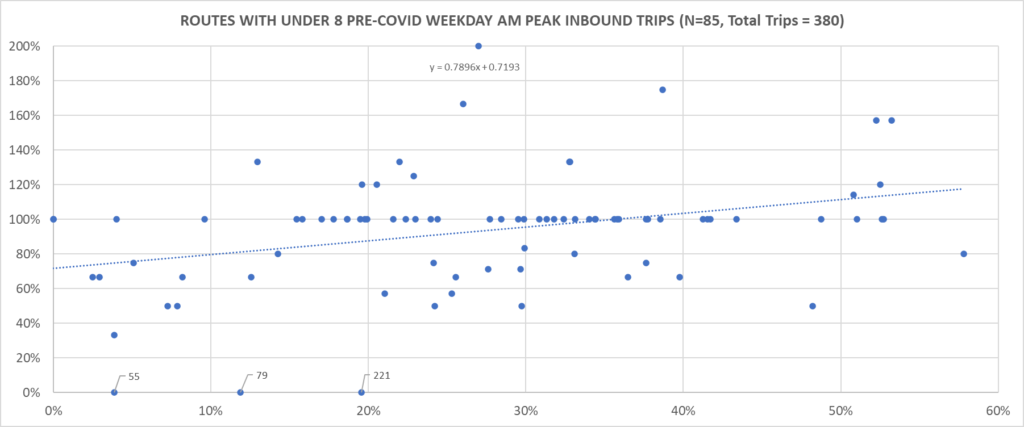
Protection of transit-dependent riders, those on routes with persistent ridership through the pandemic, was repeatedly highlighted in discussions of service changes. The scatter charts below confirm that ridership persisting in Fall 2020 (as a % of Fall 2019 ridership) was positively correlated with service level changes implemented from Fall 2019 to Fall 2021. Each point on the charts represents a bus route, positioned horizontally by its Fall 2020 level of ridership as compared to pre-COVID levels and vertically by its peak hour inbound trip in the Fall of 2021 compared to pre-COVID levels. The three charts break out high, medium, and low frequency routes. The relationship of trip change to ridership persistence is clearest for the larger routes. For the low frequency routes (bottom scatter), the scatter gets messier — for low frequency routes, it’s harder to change frequency without making the route unviable.
Note that the trip count cut points for the three charts (>15, 8-15, < 8) are chosen so that the total trips accounted for by the routes shown in each chart are roughly equal. Note also that all routes had Fall 2020 ridership persistence under 60%, the SLW (Silver Line Way) route being the only exception. The SLW is off the x-axis scale in the top chart — it had ridership persistence of 88% and gained 27% in route count.
Weekday inbound AM peak hour changes — trips vs. ridership:
Fall 2021 Trips as % of Fall 2019 Trips (Y-axis) vs. Fall 2020 Ridership as % of Fall 2019 (X-axis)
Truth in Advertising
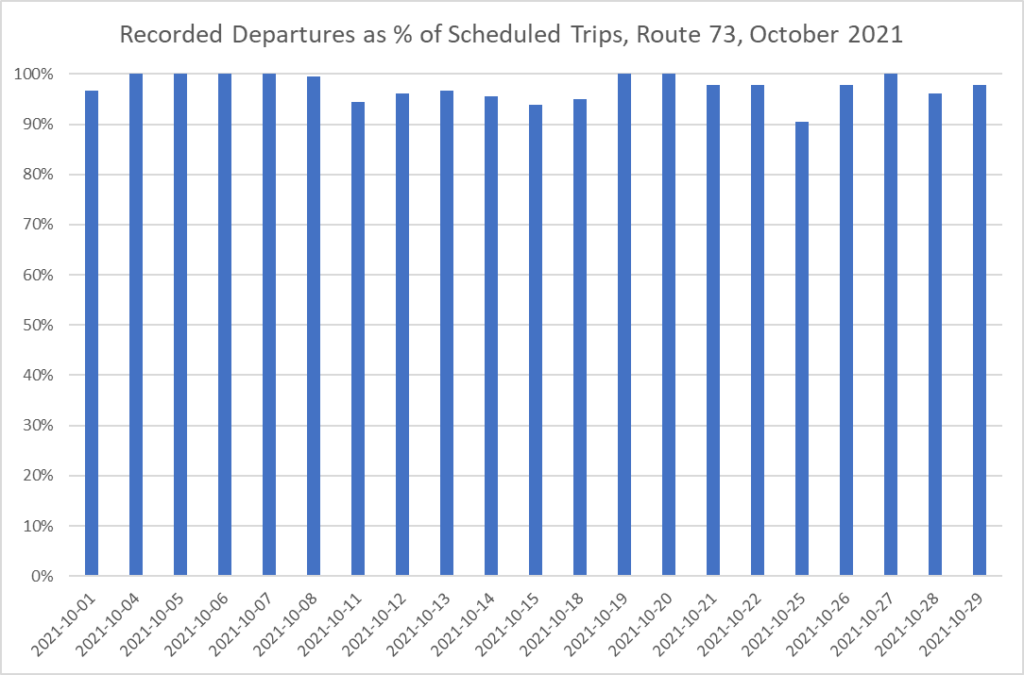
For planners under pressure to preserve published service schedules, one temptation is to schedule more buses than they can actually run. Published schedules need to assume that some bus drivers will not show up for work on any given day — there needs to be a reserve of buses and drivers to fill in. Otherwise, schedule gaps will open up. In public meetings, planners acknowledged that in the Fall of 2021, as many as one in twenty trips were being dropped. It’s hard to get an exact handle on dropped trips from available data, but this data from October 2021 for the 73 bus is consistent with up to ten percent of trips being dropped on some days:
For me, speaking as one rider: with crowding usually at manageable levels right now, the most important concern is reliability of schedule (whether by exact times or by spacing). (See survey of other riders below.) Reliability is especially valuable now that smart phone apps are available showing when buses are supposed to arrive. The apps allow better planning, including planning of multi-route trips, but they are useless if buses don’t run as advertised.
Modestly larger spacing is not an issue if buses come on time. I very much hope that T planners will realistically size overall service to match available drivers, keeping some capacity in reserve so that they can sustain all promised schedules, even if several operators are unable to report for duty. That has been their stated intention in recent planning cycles. I hope that they will err on the side of reliability, even if it means reducing stated schedule frequency until they are able to rebuild their operator workforce (which by all indications will take several years).
Addendum — Survey Results
As I released this post, I conducted a survey of current and former bus riders by email invitation to my constituent lists and to community lists.
1,164 people responded to the survey; all but 58 of them identified a bus within my senate district as their primary bus.
Here are the highlights of the results of the survey.
- 48% (554 out of 1,164 respondents) said they were riding less or not riding anymore since since COVID. This is consistent with the durable loss of ridership noted above.
- Among the 554 who are riding less, reasons offered were:
- Working from home (29%)
- Other job/life changes (28%)
- Health concerns (16%)
- Service not good (14%)
- Other (10%)
- Service no longer available (4% — three quarters of whom had been riding the 55)
- Asked for their “biggest complaint about bus service right now” riders chose
- Not frequent enough (36%)
- Not reliable, can’t trust (24%)
- No complaints (23%)
- Not at times I need (6%)
- Other (9%)
- Not clean (1%)
- Disorderly/noisy (1%)
- Asked to make a choice between reliability and frequency, 56% emphasized reliability and 44% emphasized frequency.
- 8 routes had more than 50 respondents that identified them as their primary bus (1, 55, 57, 66, 71, 73, 74/5, 86). The results did not vary dramatically across these bus routes, except:
- riders of the 55 bus were much more likely to report that they were riding less or not at all and most of them blamed service cuts (and, indeed, the 55 lost all peak hour service); they were the riders least likely to have no current complaints (only 3%).
- riders of the 72/74/75 were least likely to complain about service levels (only 7%) as a reason for riding less, likely because most of them had experienced a relatively recent service increase due to route adjustments in the first phase of Bus Network Redesign; however, they were average in the extent to which they were riding less or not at all (48%).
- riders of the 86 were especially likely to complain of infrequent service (57%)
- the 26 responding riders of the Brighton Turnpike bus (502/504), a smaller group in the survey, were almost as unhappy as the 55 riders, with only 4% having no complaints and 80% complaining about frequency and reliability issues. The 502 and 504 were previously separate routes and we’ve heard complaints about crowding to the point where not all can board.
- Asked about frequency vs. reliability in the abstract, 56% emphasized reliability. However, in terms of the routes that they are riding, people were more likely to complain about frequency (36%) than reliability (24%).
The raw anonymous survey responses can be downloaded in this spreadsheet.
I haven’t responded individually to each comment below, but I’ve read them all (as of 3/2) and will continue to review additional comments. We will share them with the T. I appreciate the time all have given to responding.